
Only logged in customers who have purchased this product may leave a review.
19€
19€
Compatible from

Favorites: 1
Views: 929
Reviews: 0
English below .
Le système Murray Math est une méthode de trading qui utilise des niveaux de support et de résistance pour aider les traders à identifier les tendances du marché et à prendre des décisions de trading. Il a été développé par Andrew Murray et est basé sur la théorie des nombres et les concepts de géométrie.
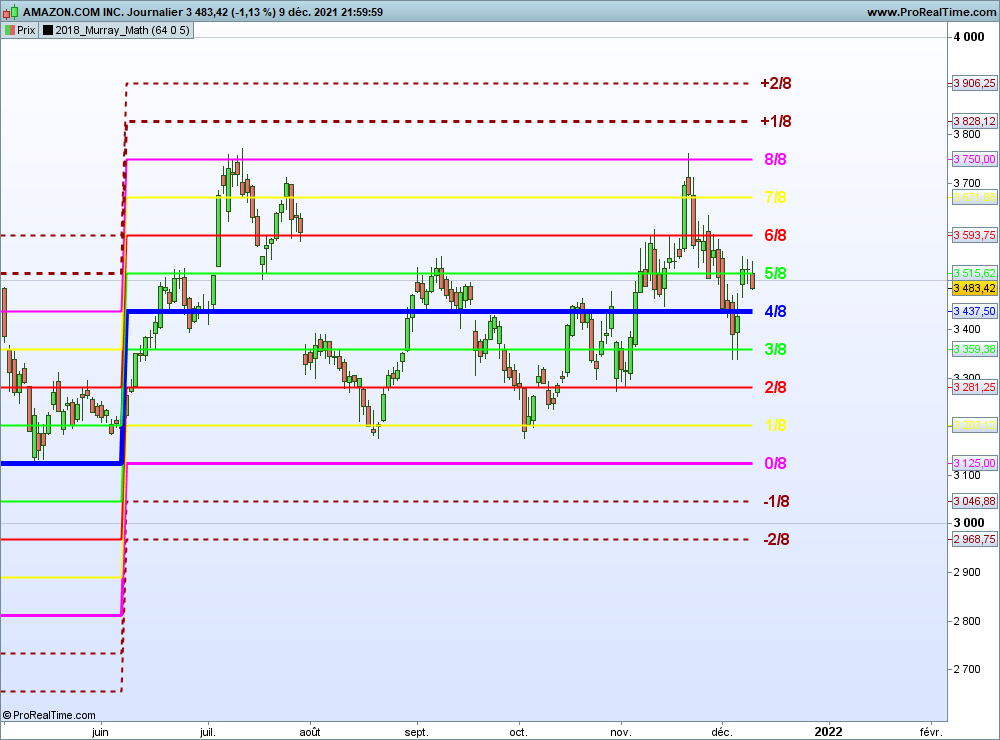
Le système Murray Math divise un graphique de prix en huit lignes horizontales, qui sont appelées “lignes Murrey”. Ces lignes sont positionnées de manière à former une grille sur le graphique. Les niveaux de support et de résistance sont identifiés en fonction de la relation entre le prix actuel et ces lignes.
Voici quelques-unes des principales lignes Murrey et leurs significations :
- La ligne 0/8 est considérée comme un niveau de support majeur.
- La ligne 8/8 est considérée comme un niveau de résistance majeur.
- Les lignes 1/8 et 7/8 sont des niveaux de support et de résistance importants.
- Les lignes 2/8 et 6/8 sont des niveaux de support et de résistance moins significatifs.
- Les lignes 3/8 et 5/8 sont considérées comme des zones neutres ou d’indécision.
Les traders utilisent ces niveaux pour prendre des décisions de trading, notamment pour identifier les points d’entrée et de sortie, ainsi que pour définir leurs objectifs de profit et leurs stops.
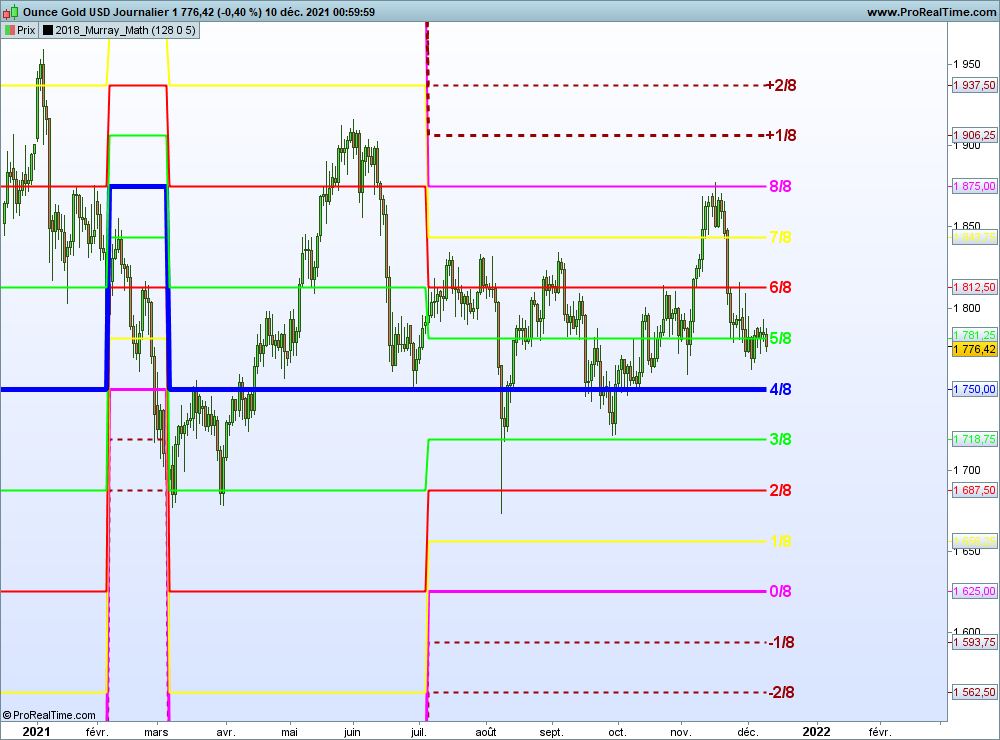
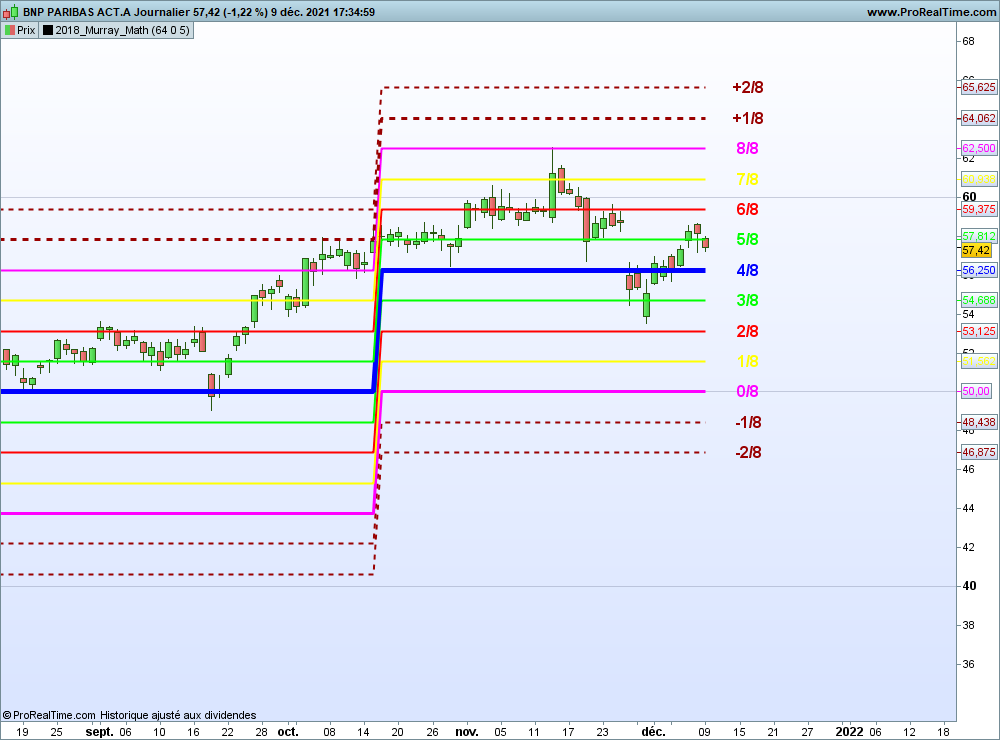
Le système Murray Math peut être utilisé sur divers marchés financiers, y compris les devises, les actions et les matières premières. Cependant, il est important de noter que comme toute méthode de trading, il comporte des avantages et des inconvénients, et il doit être utilisé avec prudence. Les résultats peuvent varier en fonction de la manière dont le système est appliqué et de la volatilité du marché. Il est recommandé de s’informer davantage et de pratiquer avant de l’adopter comme une stratégie de trading principale
Cet indicateur est la traduction du code MT4 (Metatrader) de Vladislav Goshkov.
Vous trouvez ,des explications sur Murrey Math lignes ,en lisant le PDF de Tim Kruzel .
The Murray Math system is a trading method that uses support and resistance levels to help traders identify market trends and make trading decisions. It was developed by Andrew Murray and is based on number theory and geometry concepts.
The Murray Math system divides a price chart into eight horizontal lines, which are called “Murrey lines.” These lines are positioned to form a grid on the chart. Support and resistance levels are identified based on the relationship between the current price and these lines.
Here are some of the main Murrey lines and their meanings:
The 0/8 line is considered a major support level.
The 8/8 line is considered a major resistance level.
Lines 1/8 and 7/8 are important support and resistance levels.
Lines 2/8 and 6/8 are less significant support and resistance levels.
Lines 3/8 and 5/8 are considered neutral or indecision zones.
Traders use these levels to make trading decisions, including identifying entry and exit points, as well as setting their profit targets and stops.
The Murray Math system can be used in various financial markets, including currencies, stocks and commodities. However, it is important to note that like any trading method, it has advantages and disadvantages, and it should be used with caution. Results may vary depending on how the system is applied and market volatility. It is recommended to educate yourself further and practice before adopting it as a primary trading strategy
This indicator is based on algorithm, proposed by Vladislav Goshkov (VG)
Murrey Math Lines
The Murrey Math lines consist of 8 “pivot points” with each line having a different meaning to the price action. Essentially what the Murrey math trading lines strategy does is to divide the price into 8 important levels with the 8/8, 4/8 and the 0/8 levels being the most significant pivots.
The Murrey lines have nine main components or variables plus 4 extra pivots that can reveal extreme overbought or oversold conditions and each of them will tell you a different story about the price action as follow:
·
· [+2/8]P – Extreme Overshoot conditions, can reverse anytime
· [+1/8]P – Overshoot conditions
· [8/8]P – Ultimate resistance, extremely overbought conditions
· [7/8]P – Weak level, place to stop and reverse
· [6/8]P – Strong pivot reverse
· [5/8]P – Top of trading range
· [4/8]P – Major support/resistance pivotal point
· [3/8]P – Bottom of trading range
· [2/8]P – Strong, Pivot, reverse
· [1/8]P – Weak, place to stop and reverse
· [0/8]P – Hardest line to fall below, oversold conditions
· [-1/8]P – Oversold conditions
· [-2/8]P – Extreme oversold conditions, can reverse anytime
·
More Items by Sohocool
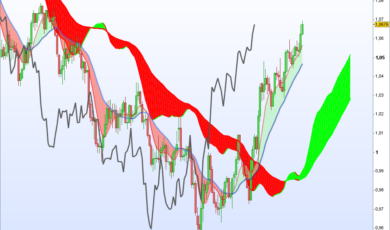
ICHIMOKU AVERAGES V2 Updated
English below. L’indicateur Ichimoku Kinko Hyo, souvent abrégé en Ichimoku, (...)
19€
0
19€
3
Ready to Join Our Trading Marketplace!
Over 1,000,000 potential customers are in need for pro quality trading products
Join Us Today
Reviews
There are no reviews yet.