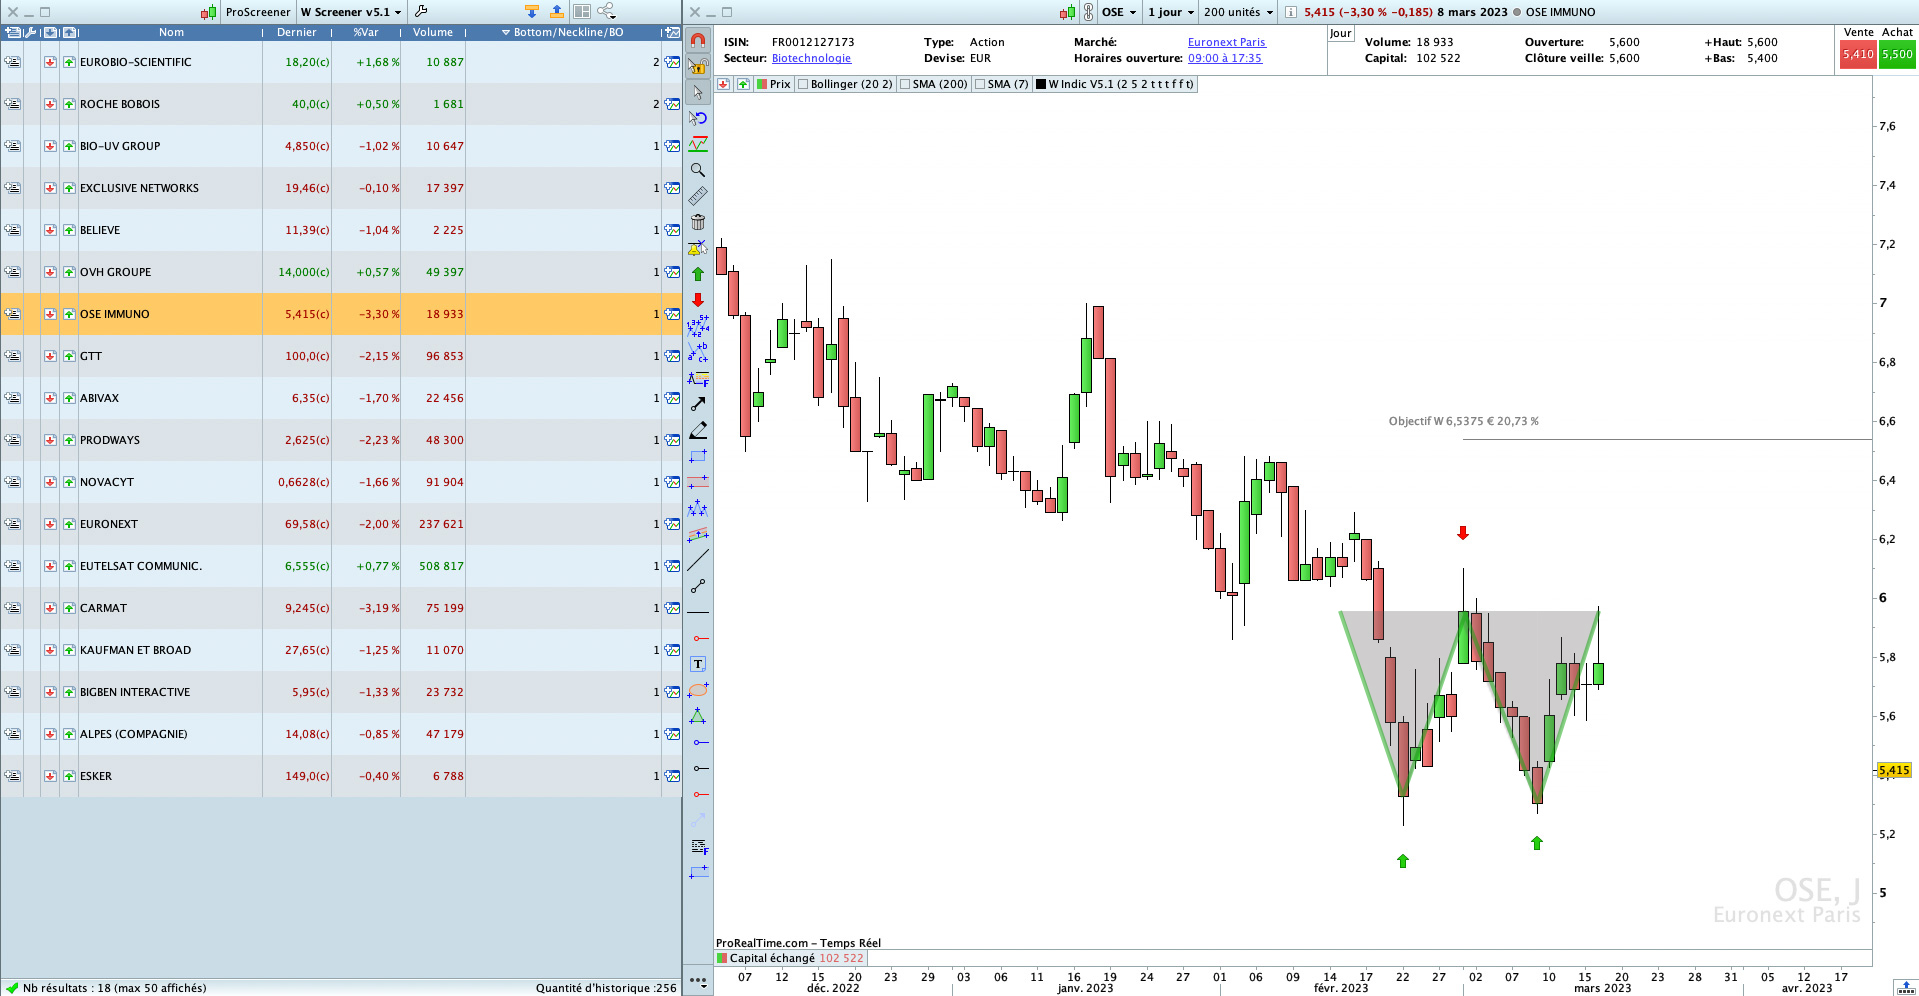
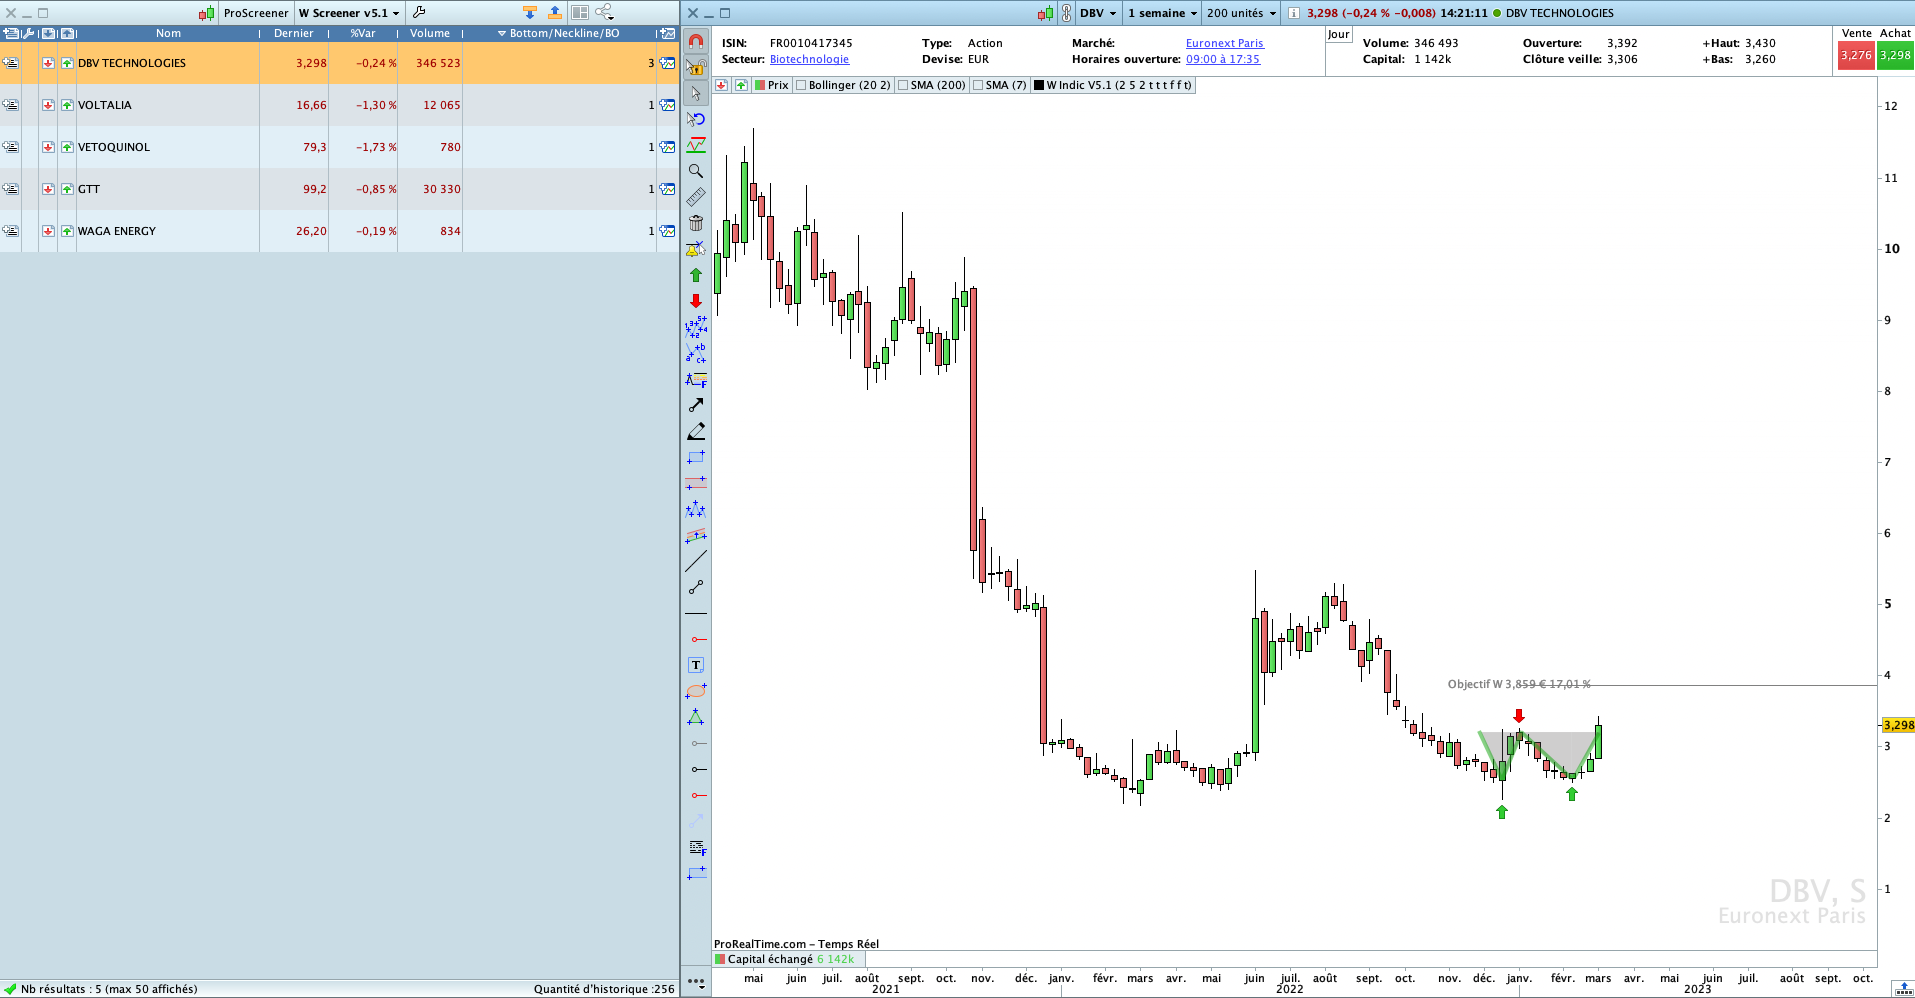
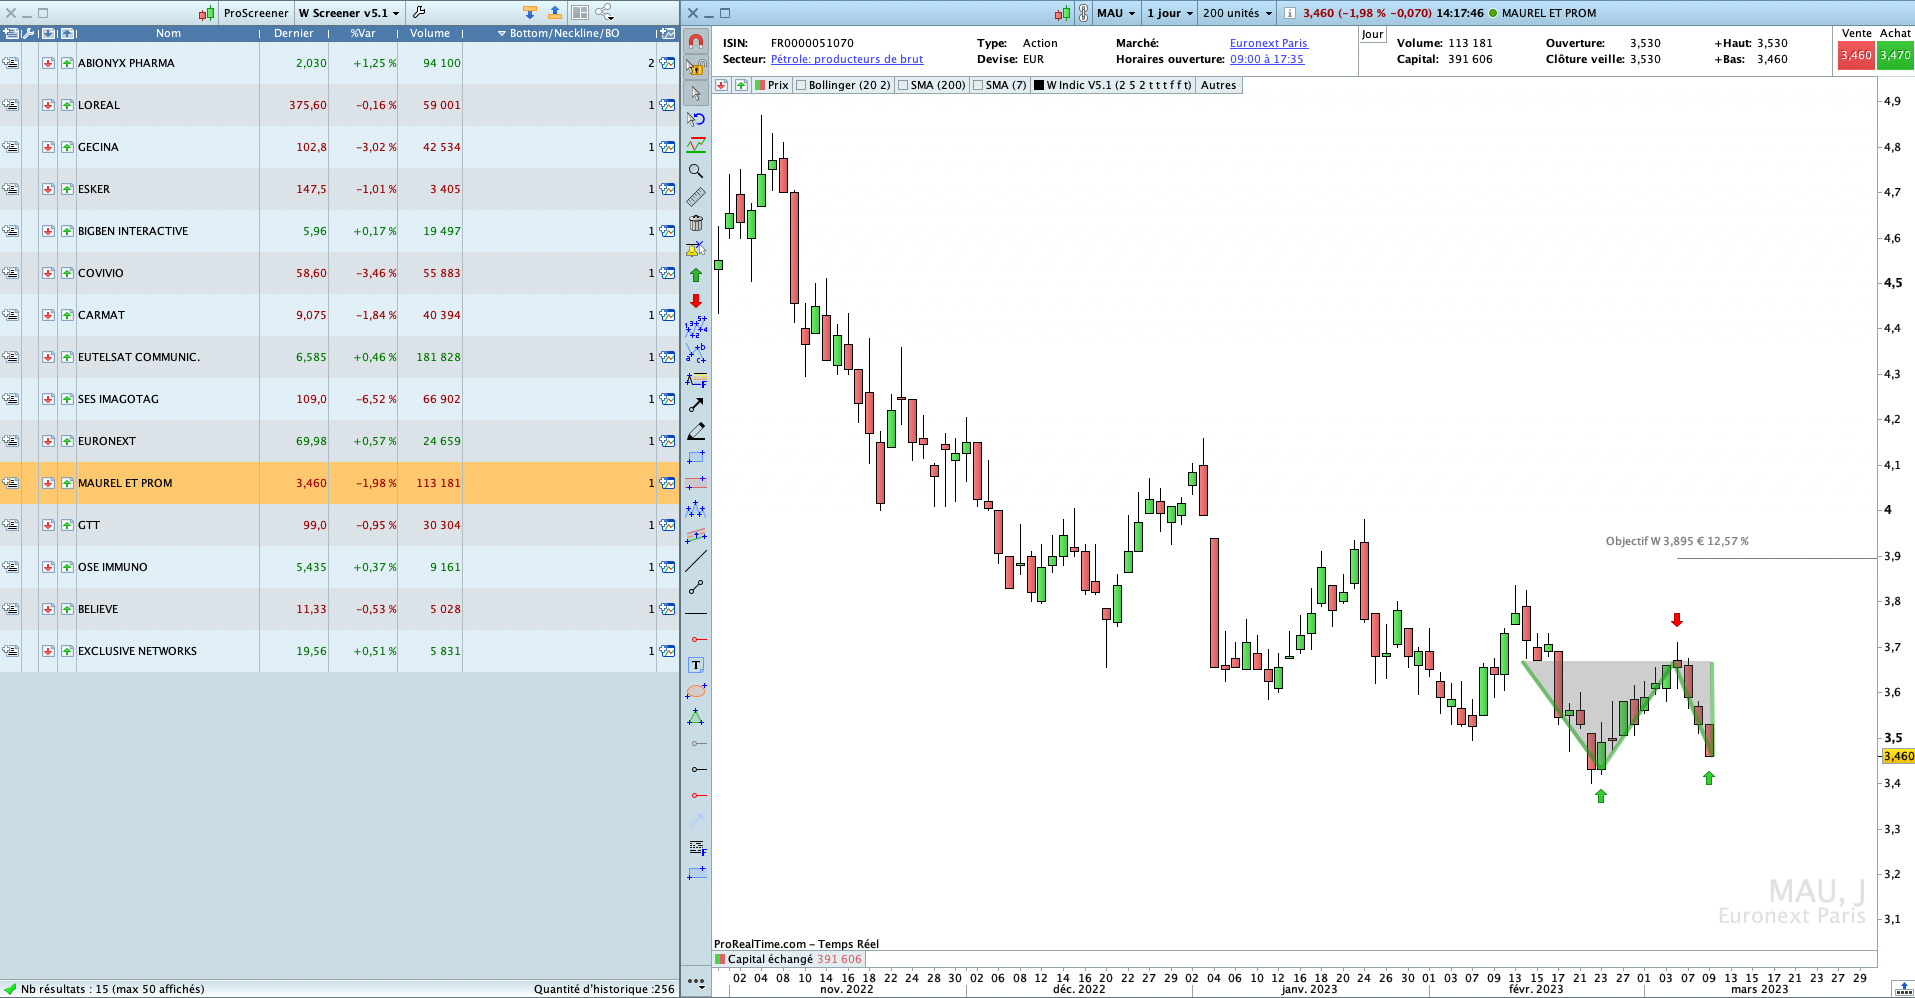
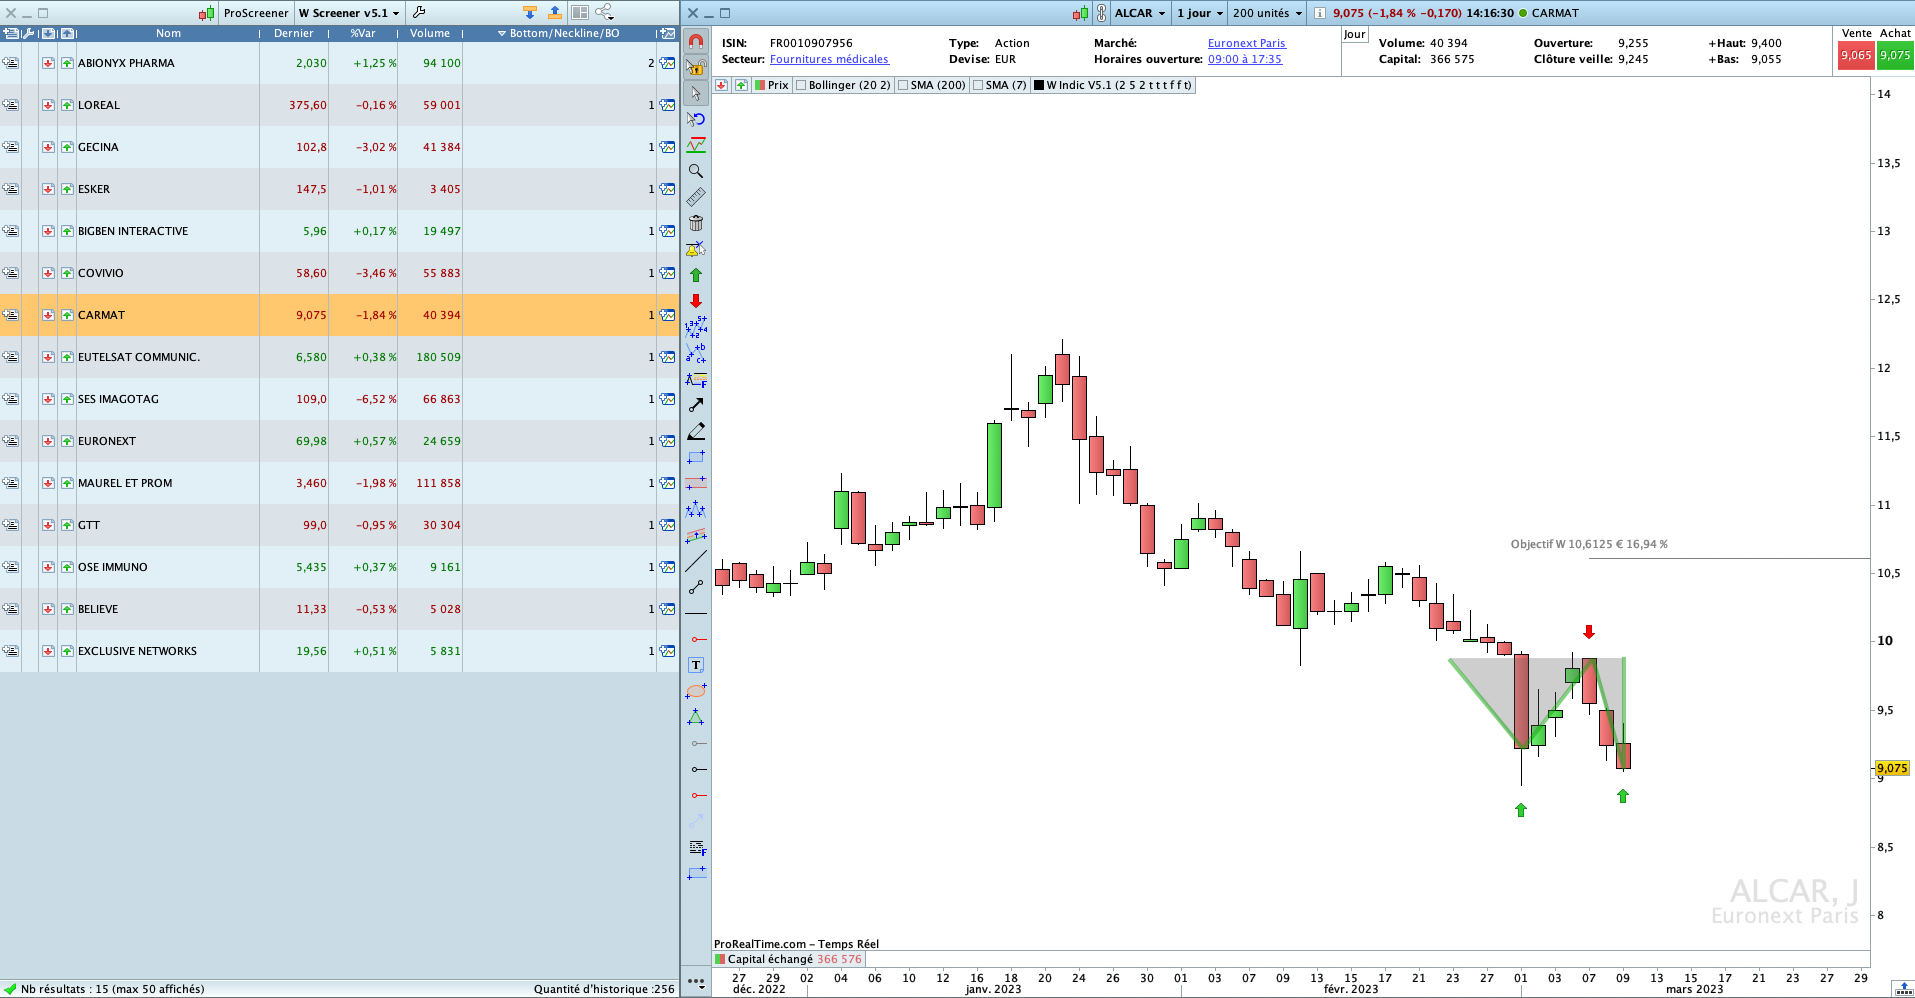
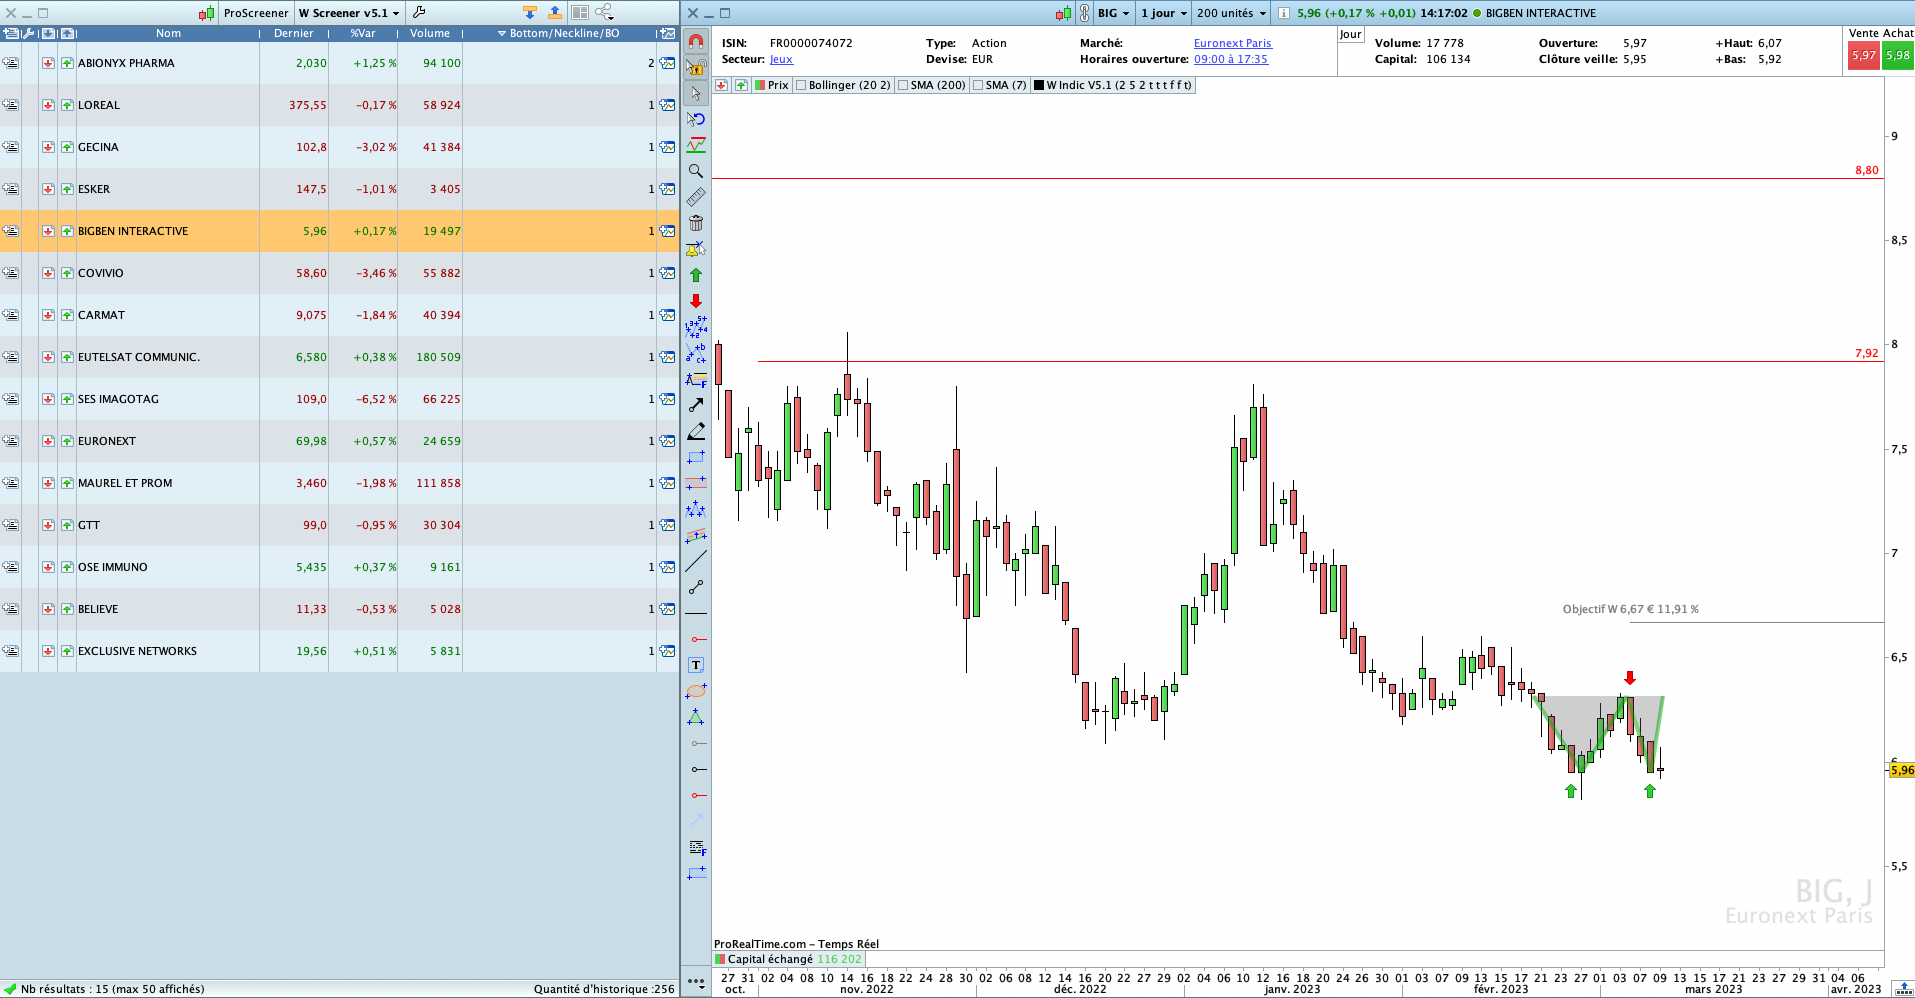
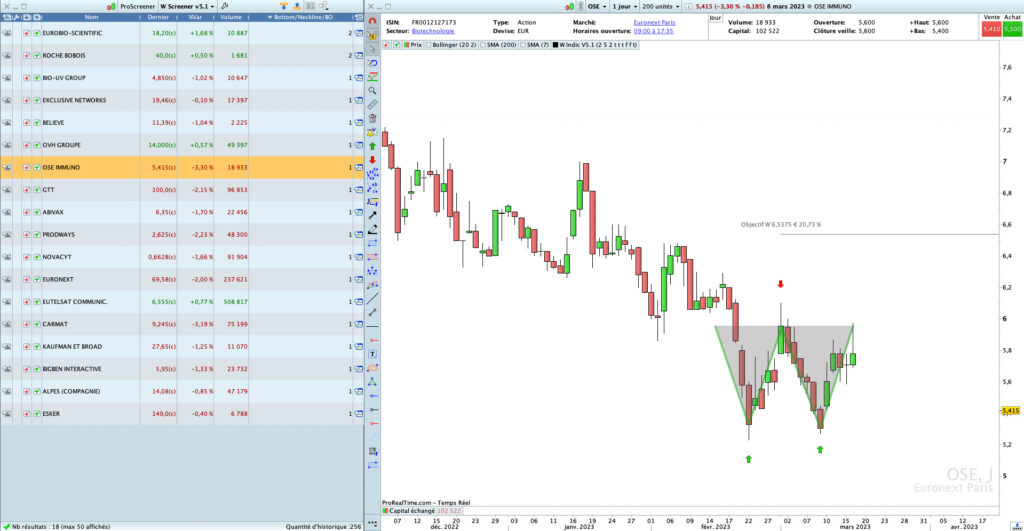
The Double Bottom, W, is a bullish reversal pattern. The screener will scan the market in the timeframe defined to find Double Bottoms.
Depending on everyone criteria, as well as the timeframe scanned, many parameters are adjustable to allow everyone to have the tool that suits them, and this without having to modify the slightest line of code.
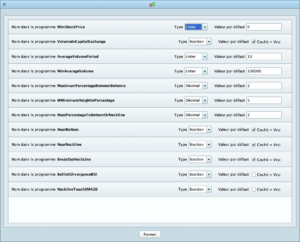
To adjust screeners parameters, simply open the Variables 🔧 menu :
A first general filtering of stocks is carried out on the Daily time frame according to 2 criterias :
- minimum stock price (for those who do not wish to have a penny in the results for example)
- minimum average volume (expressed in number of transactions or capital exchanged) to have the desired level of liquidity on the stock.
Results Rankings
Results are sorted in the column “Bottom / Neckline / BO” :
Adjustable validation criteria :
- Maximum percentage between bottoms
- W minimum height
- Maximum distance between actual price and keypoints
Available filters :
- Actual price near bottoms
- Actual price near neckline
- Actual price breaking out neck line
- Bullish divergence RSI on bottoms
- Neckline touching sma20
General filter :
- Mini stock price
- Mini average volume
- Average volume expressed in number of transaction or capital exchanged
Characteristics :
- Works on all TimeFrames
- ProRealTime V11 and later versions compatible
- Free ProRealTime (daily closings) compatible
- Automatic and free updates
- Double Bottom Indicator included
Watch the video user’s guide on our Youtube channel, subtitles available in English :
🇫🇷 W, Double Bottom / 🇮🇹 W, Doppio fondo / 🇩🇪 W, Doppelter Boden / 🇪🇸 W, Doble fondo


Valoraciones
No hay valoraciones aún.