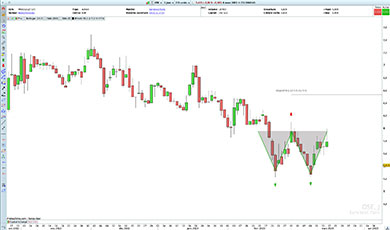
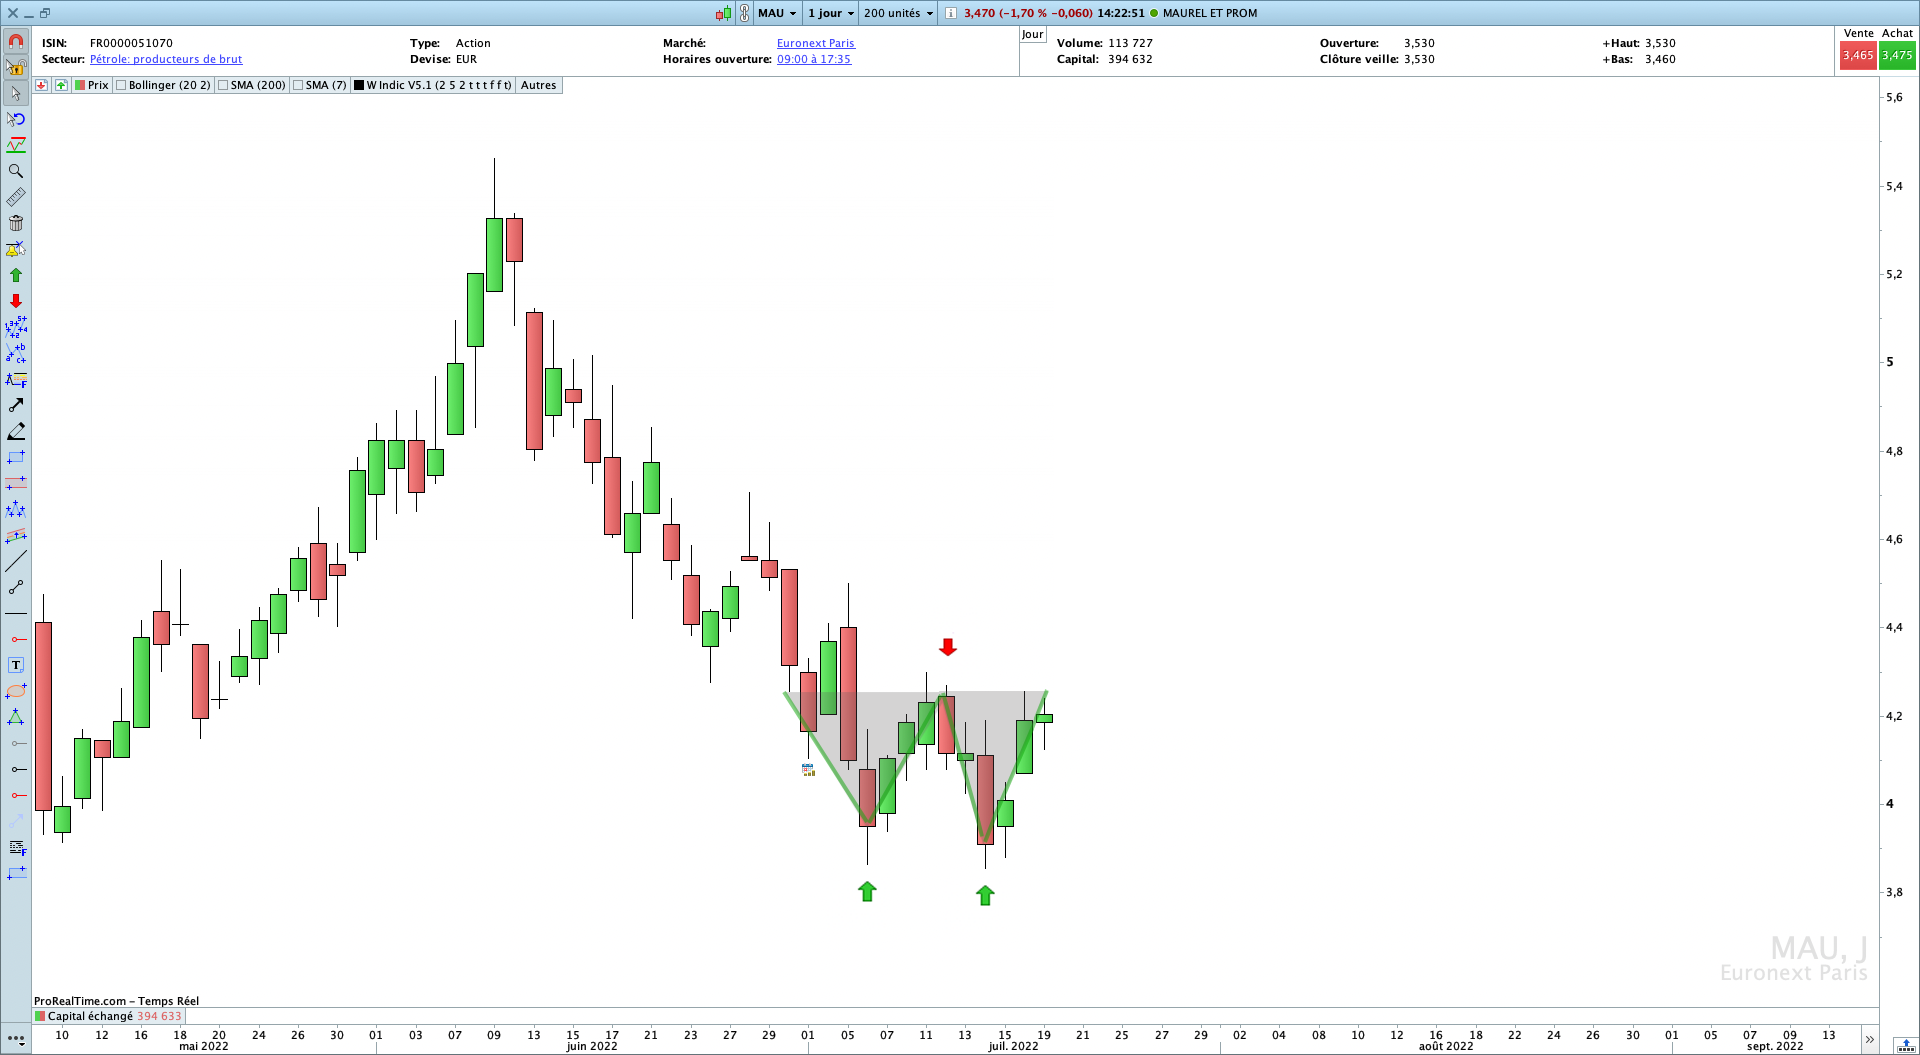
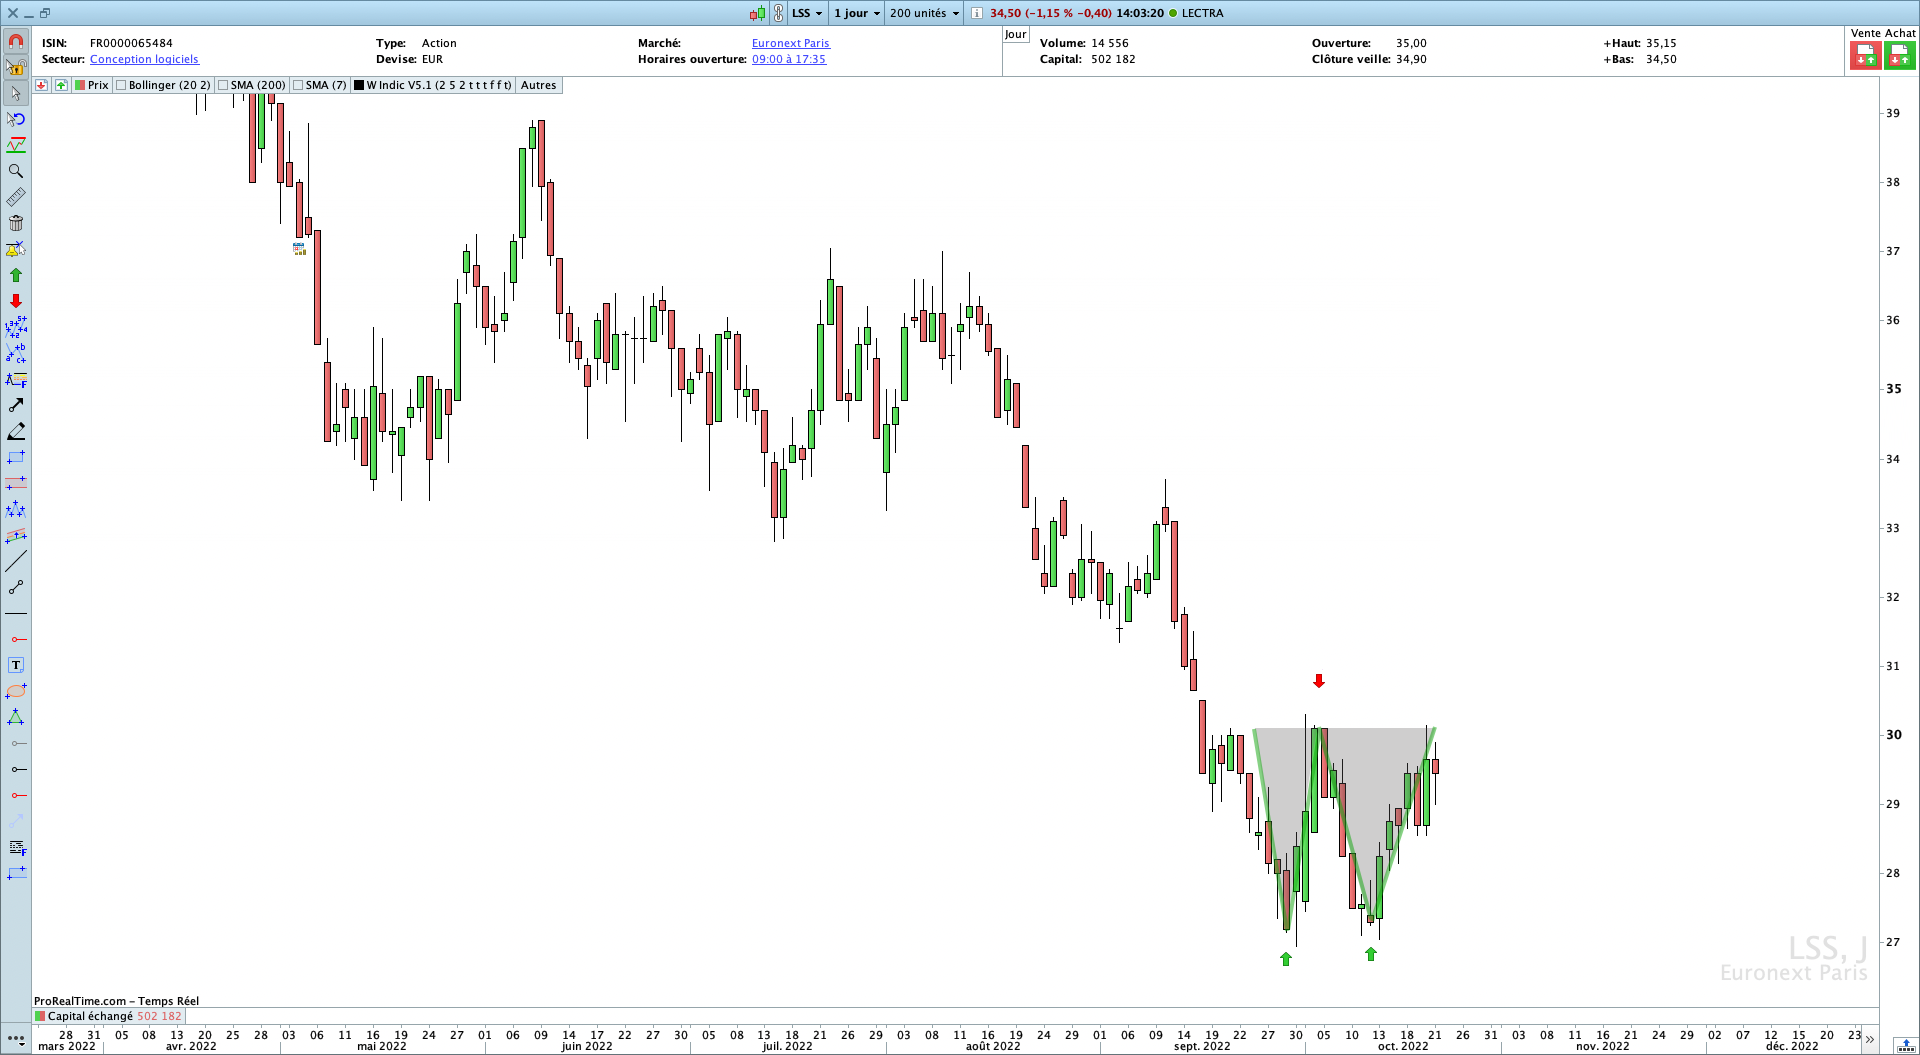
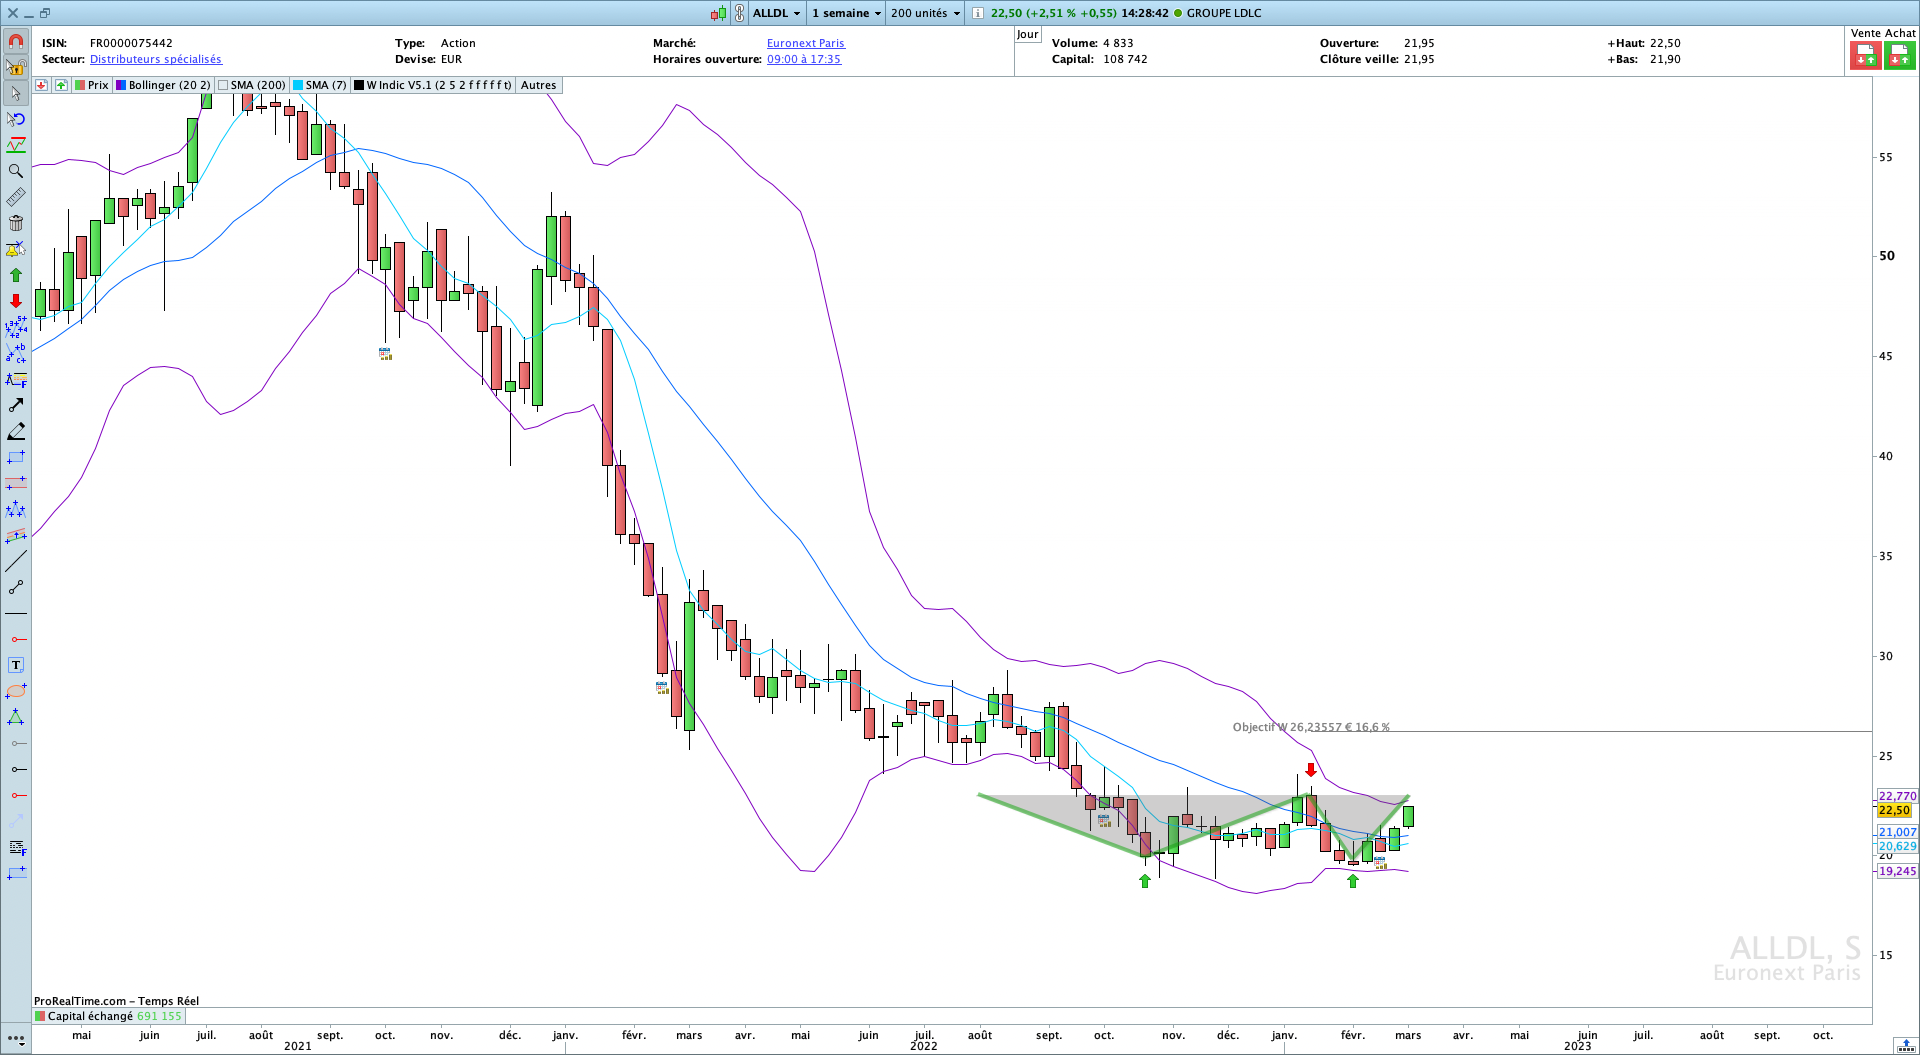

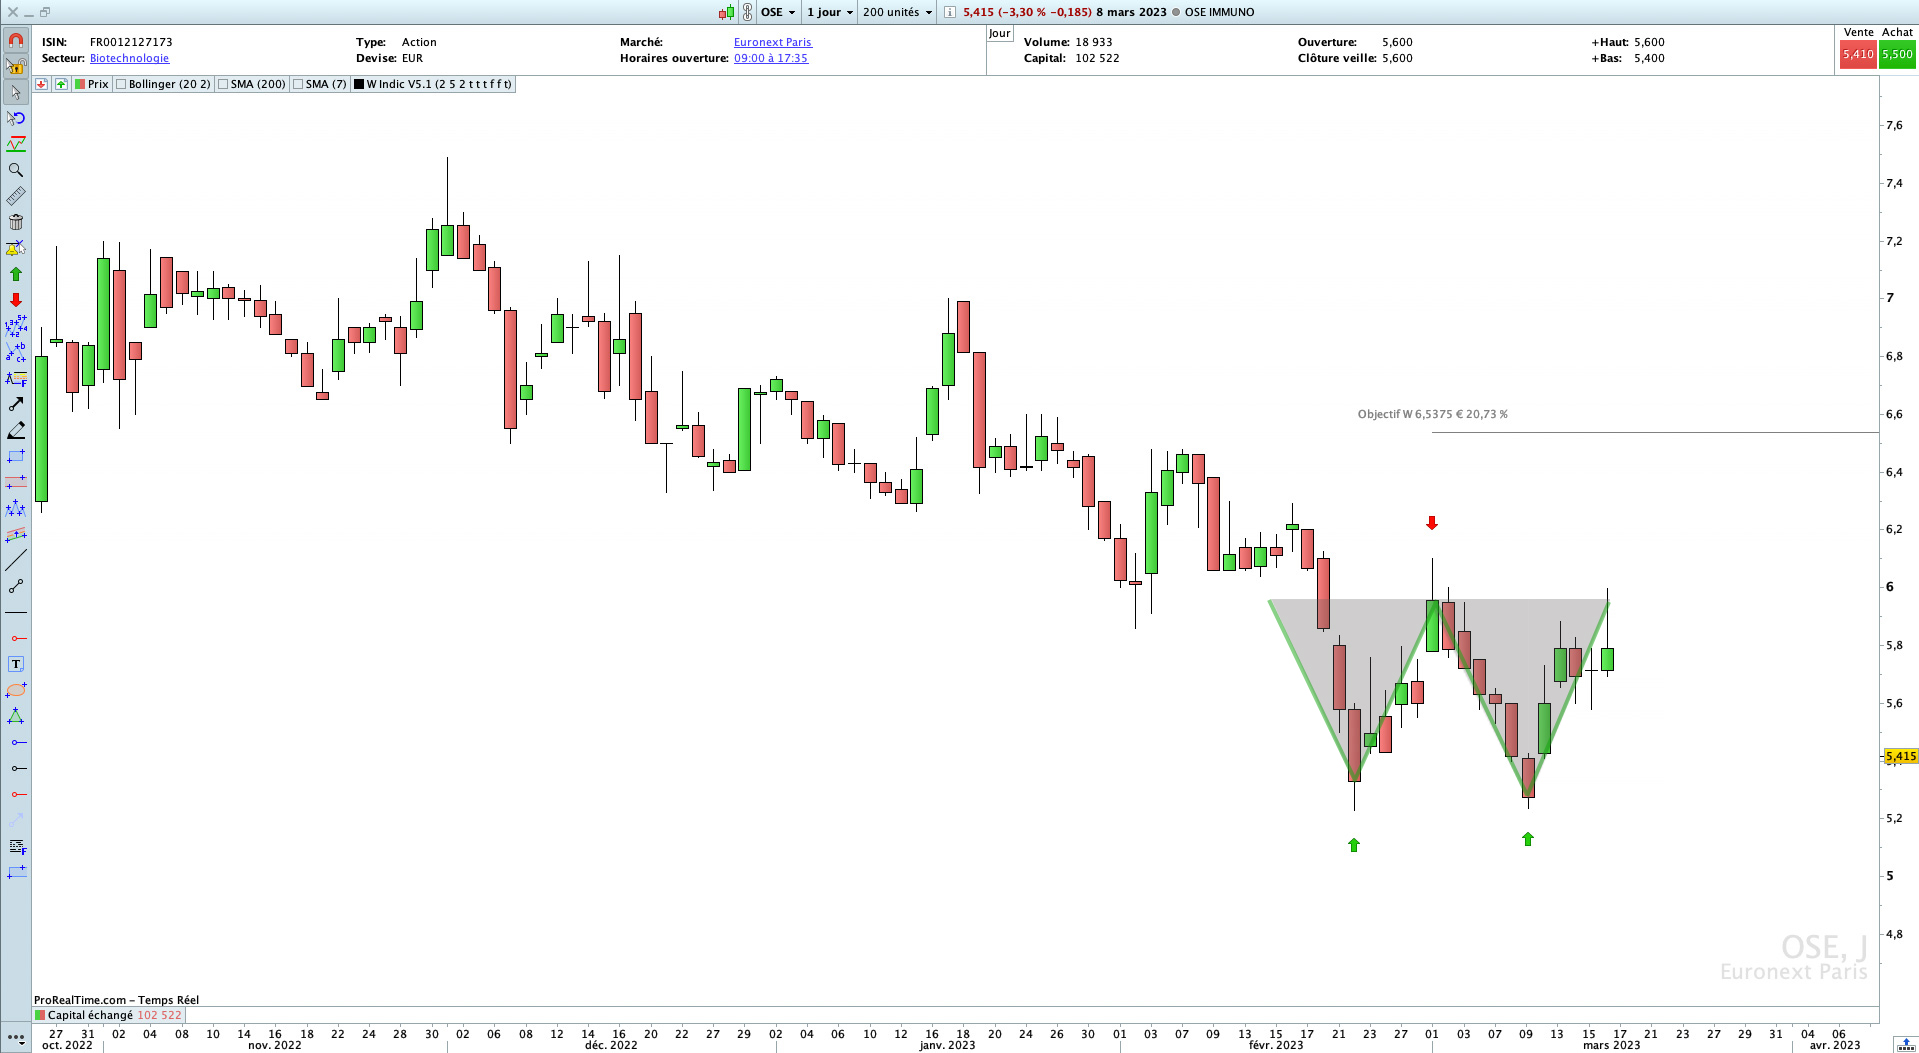
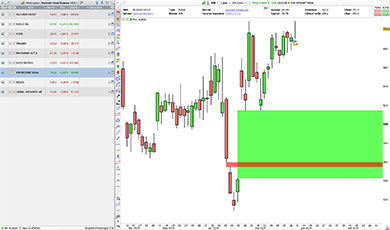
The Double Bottom, W, is a bullish reversal pattern. The indicator will display Double Bottoms on your charts.
Differents display options are available :
- Arrows under bottoms and above neckline,
- Triangles in the W
- W’s lines,
- Theoretical objective
Depending on everyone criteria, as well as the timeframe used, many parameters are adjustable to allow everyone to have the tool that suits them, and this without having to modify the slightest line of code.
To adjust indicator parameters, simply open the Configuration menu :
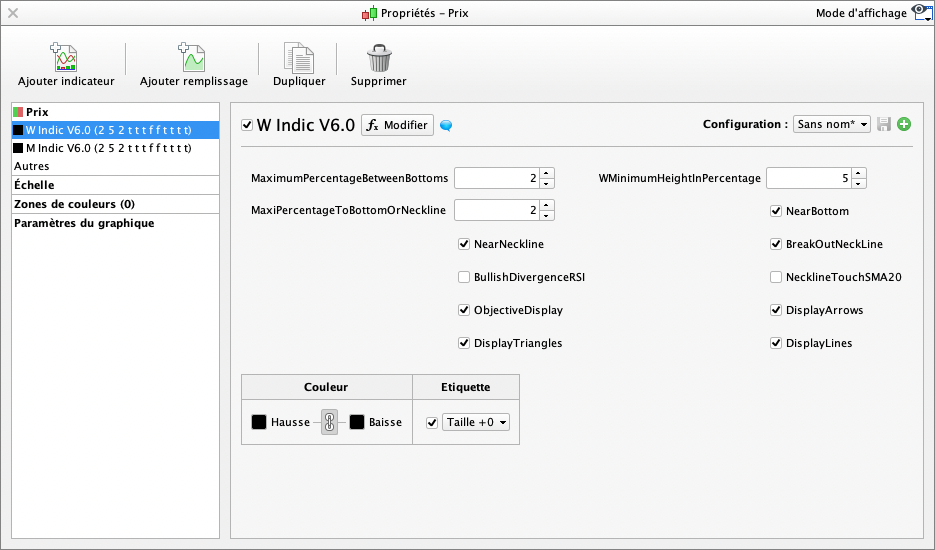 The values shown above are given, as examples and do not constitute an optimal or recommended setting, everyone should find his own settings.
Adjustable validation criteria :
- Maximum percentage between bottoms
- W minimum height
- Maximum distance between actual price and keypoints
Available filters :
- Actual price near bottoms
- Actual price near neckline
- Actual price breaking out neck line
- Bullish divergence RSI on bottoms
- Neckline touching sma20
Display Options :
- Arrows on keypoints
- W’s triangles
- W’s lines
- Theoretical objective
Characteristics :
- Works on all TimeFrames
- ProRealTime V11 and later versions compatible
- Free ProRealTime (daily closings) compatible
- Automatic and free updates
Watch the video user’s guide on our Youtube channel, subtitles available in English :
🇫🇷 W, Double Bottom / 🇮🇹 W, Doppio fondo / 🇩🇪 W, Doppelter Boden / 🇪🇸 W, Doble fondo
Bewertungen
Es gibt noch keine Bewertungen.