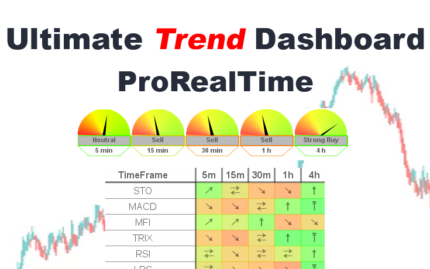
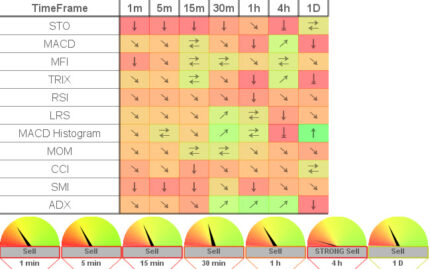
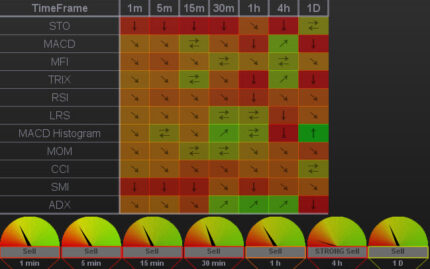
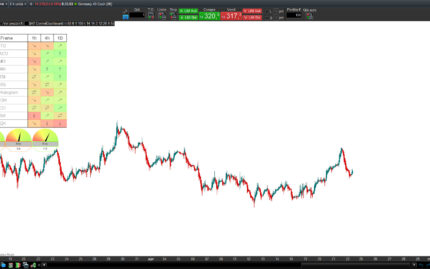
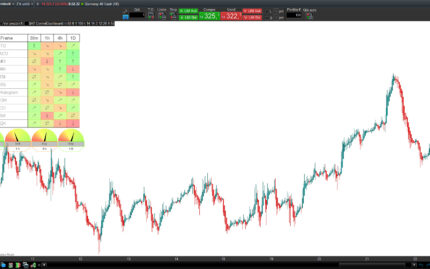
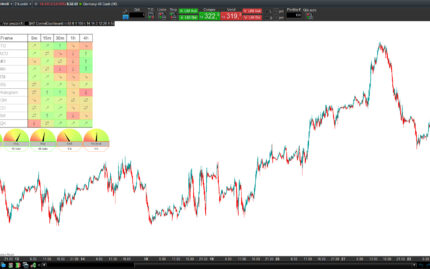
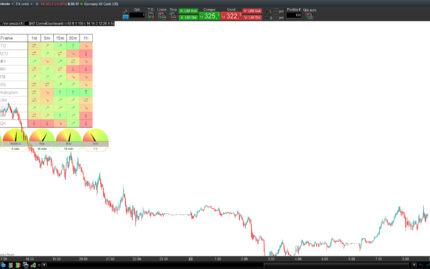
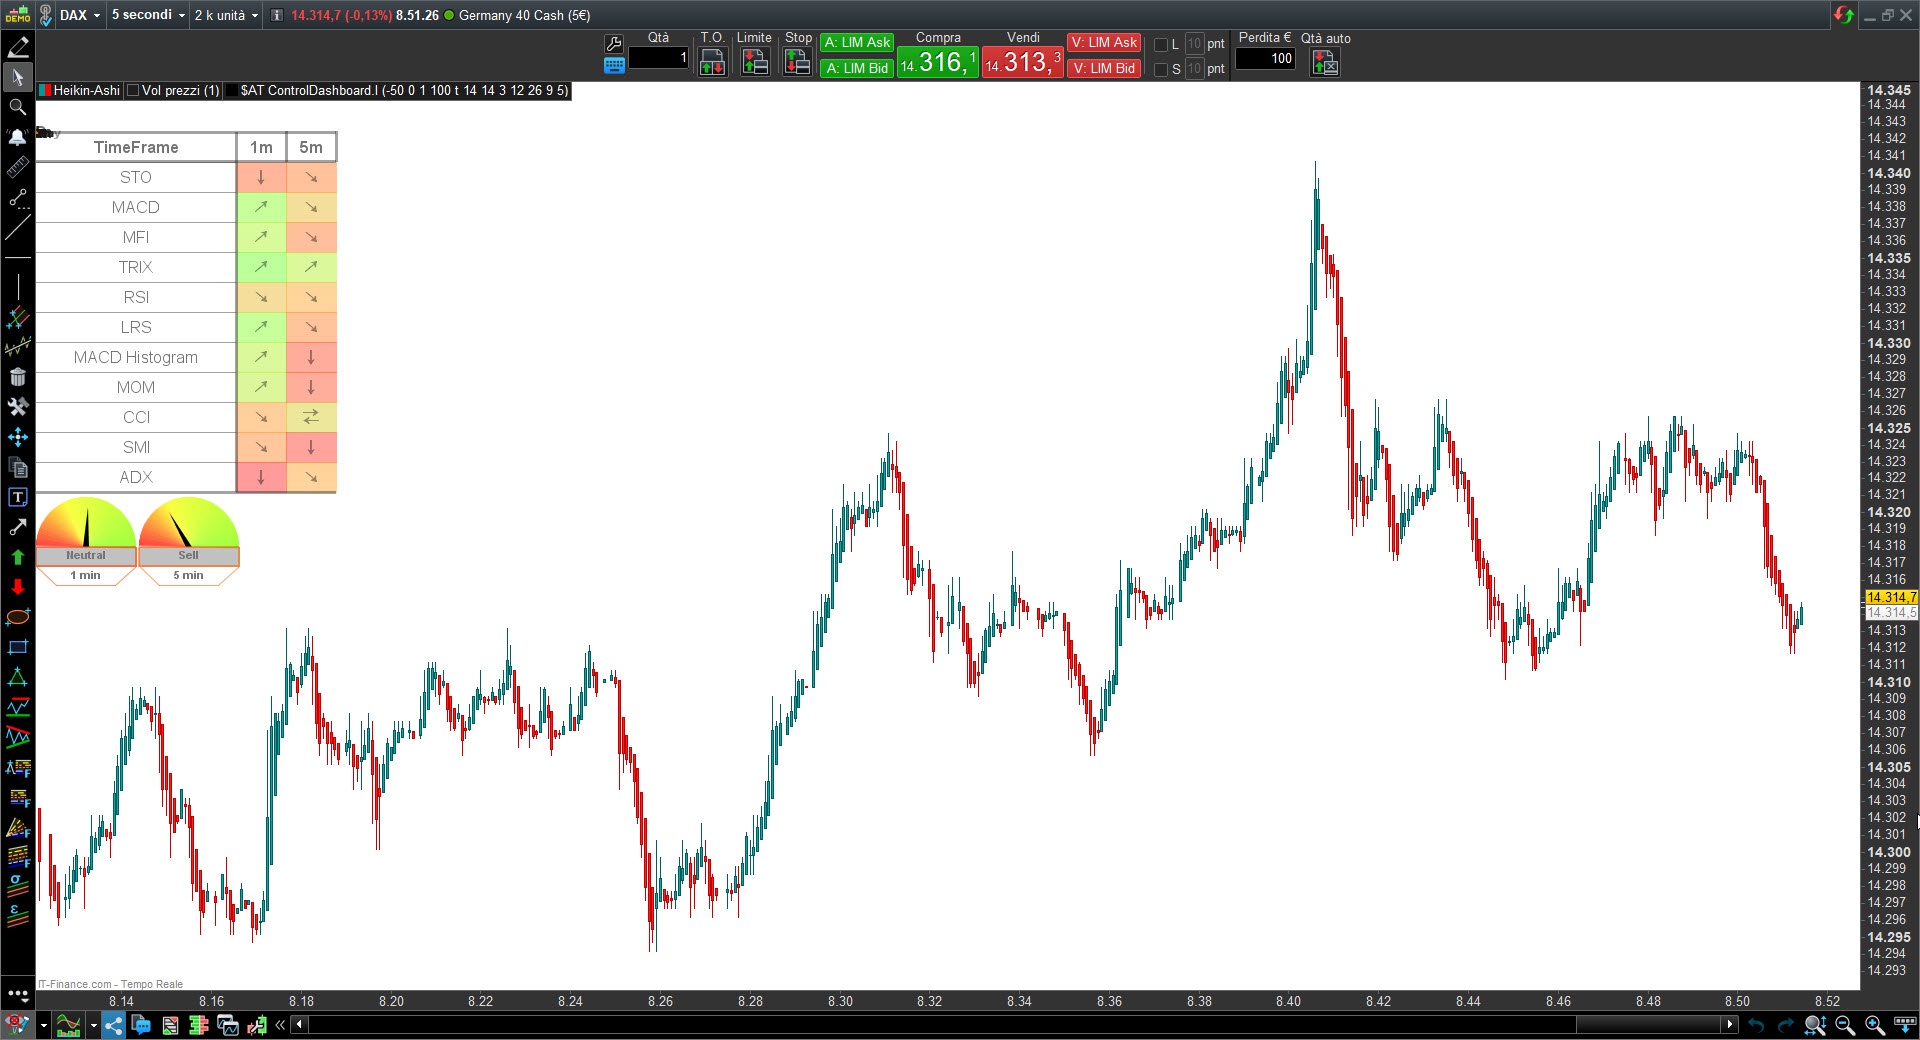
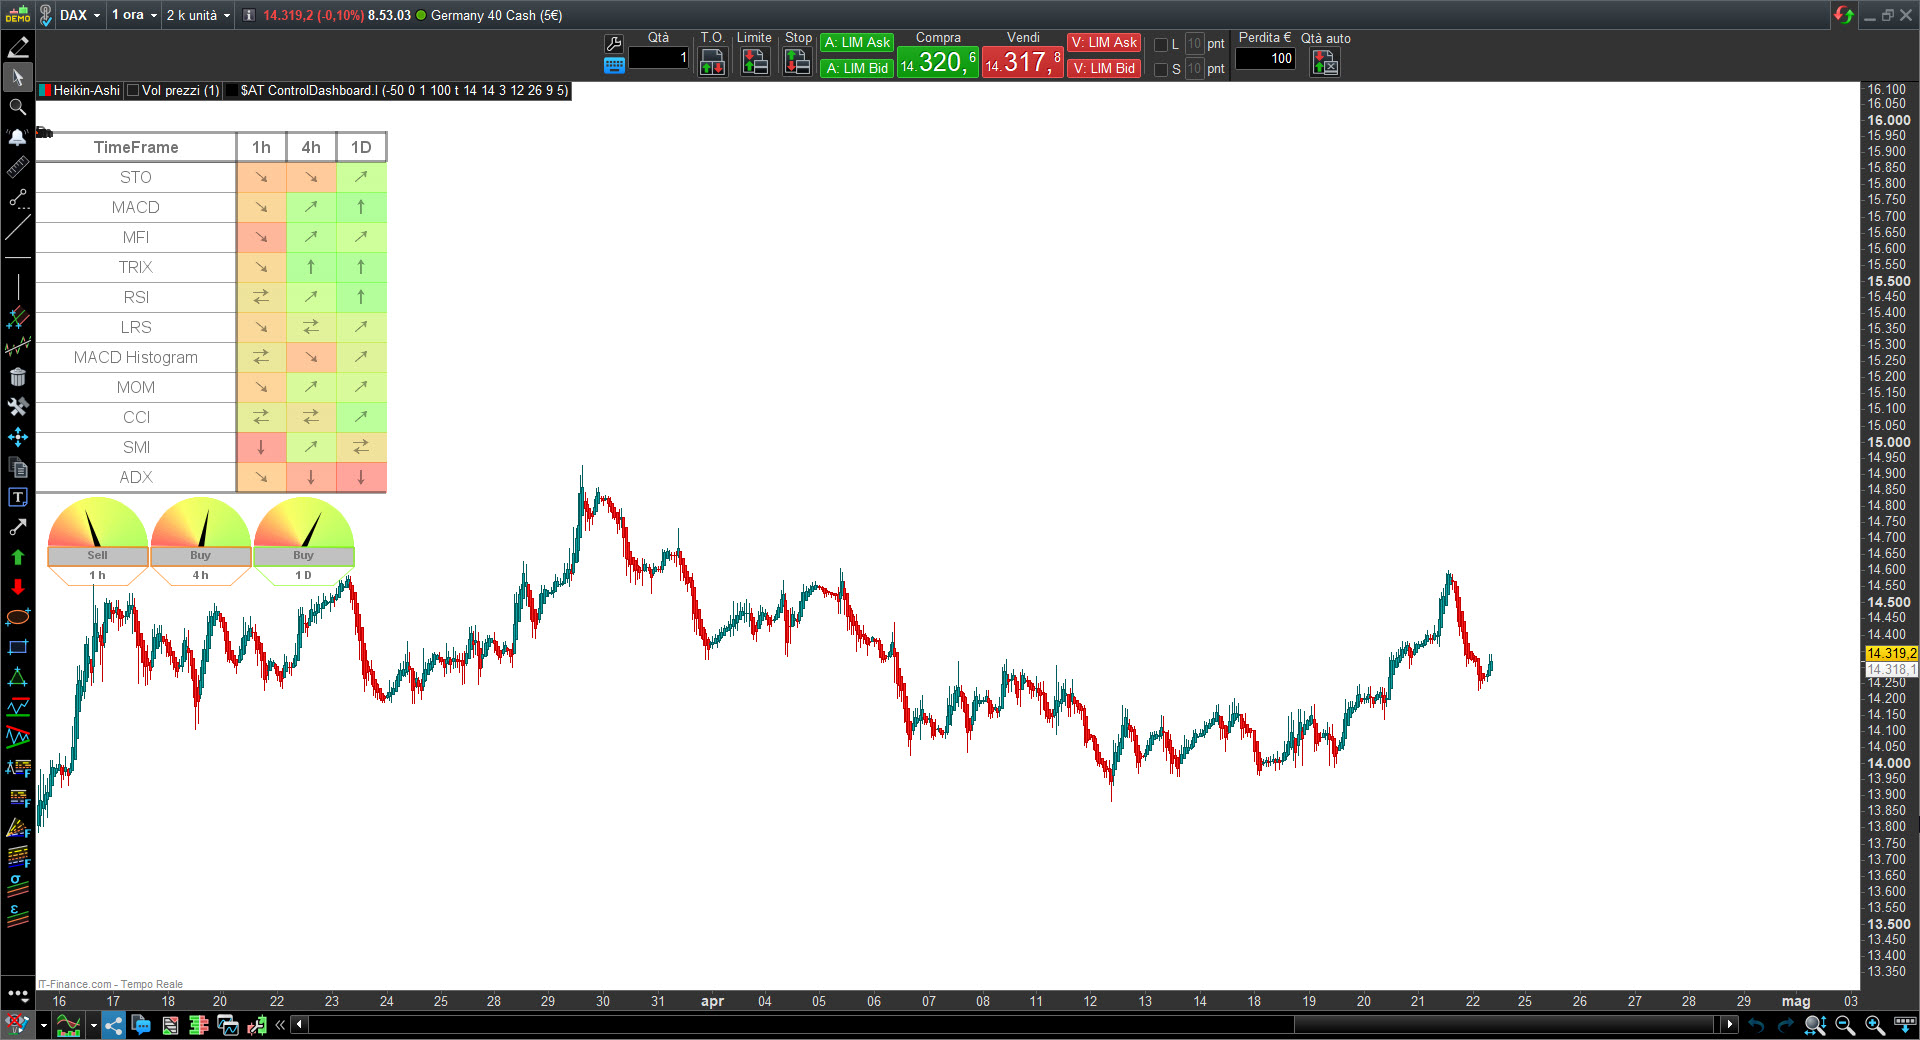
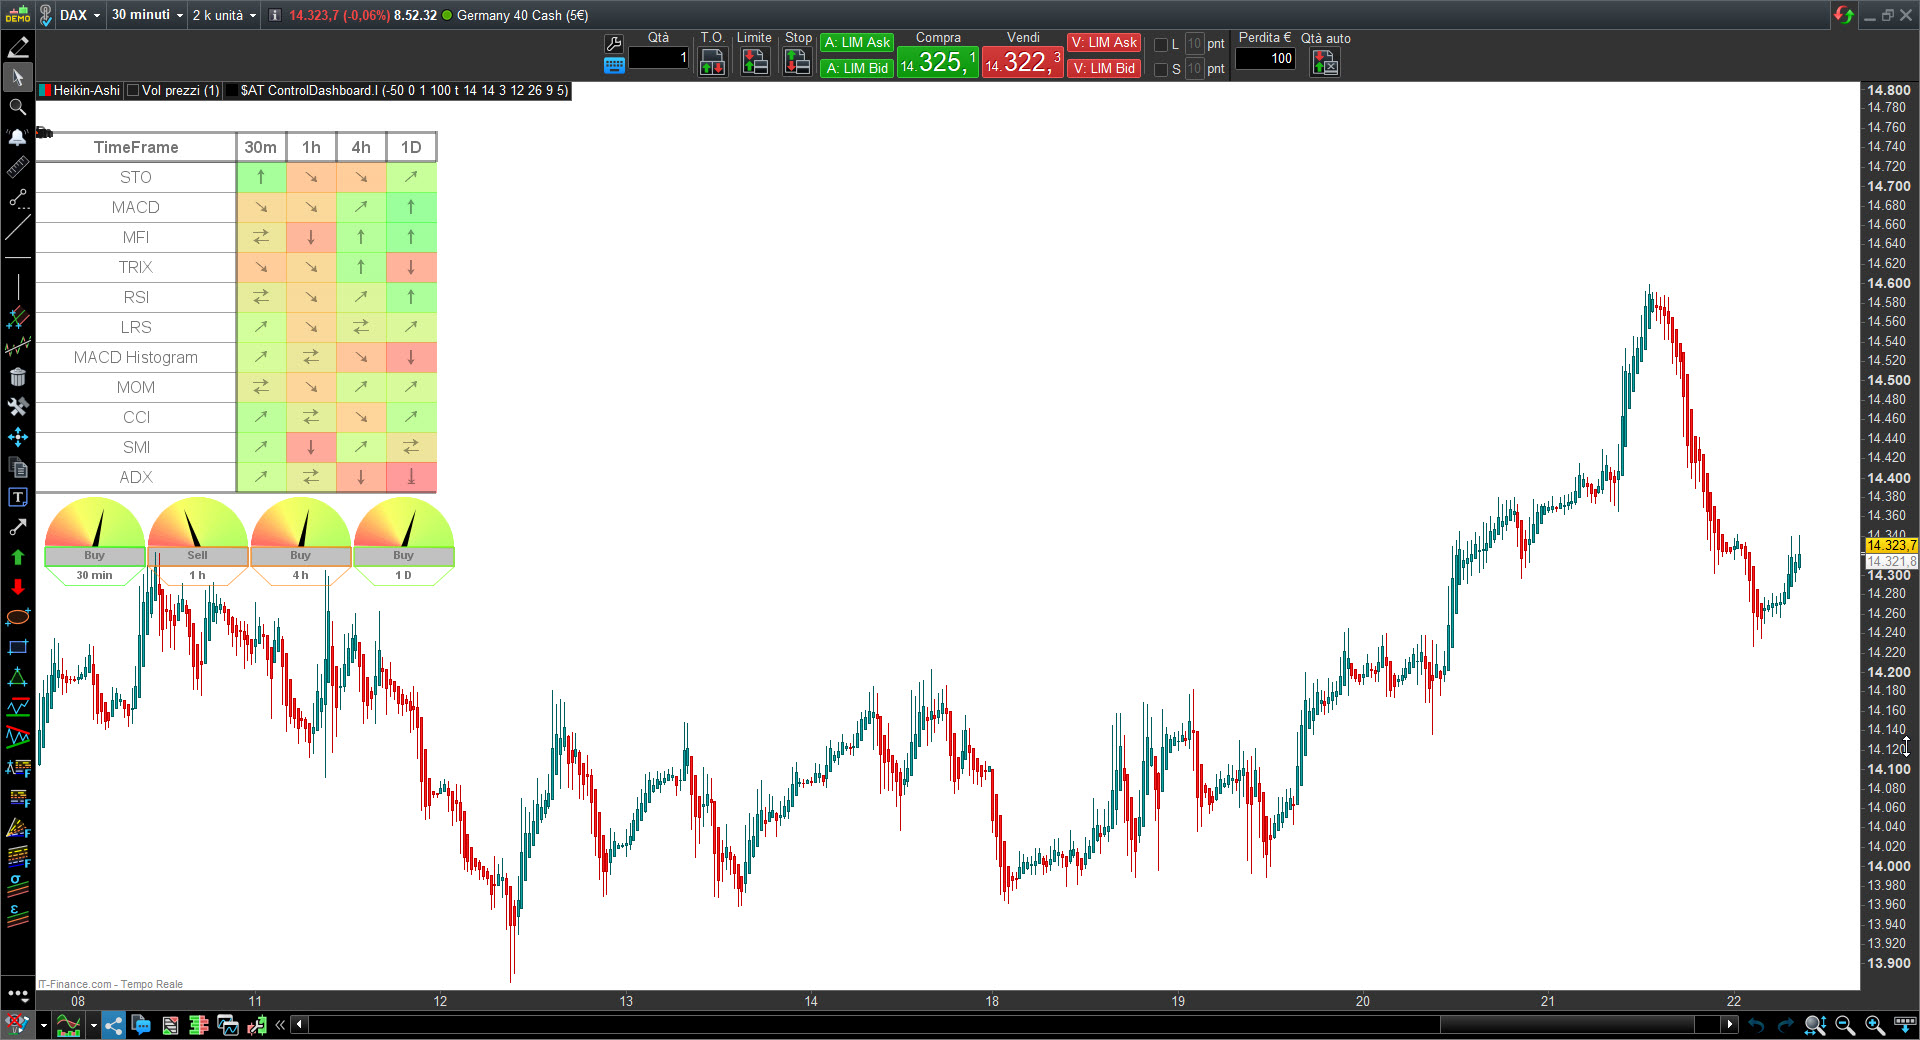
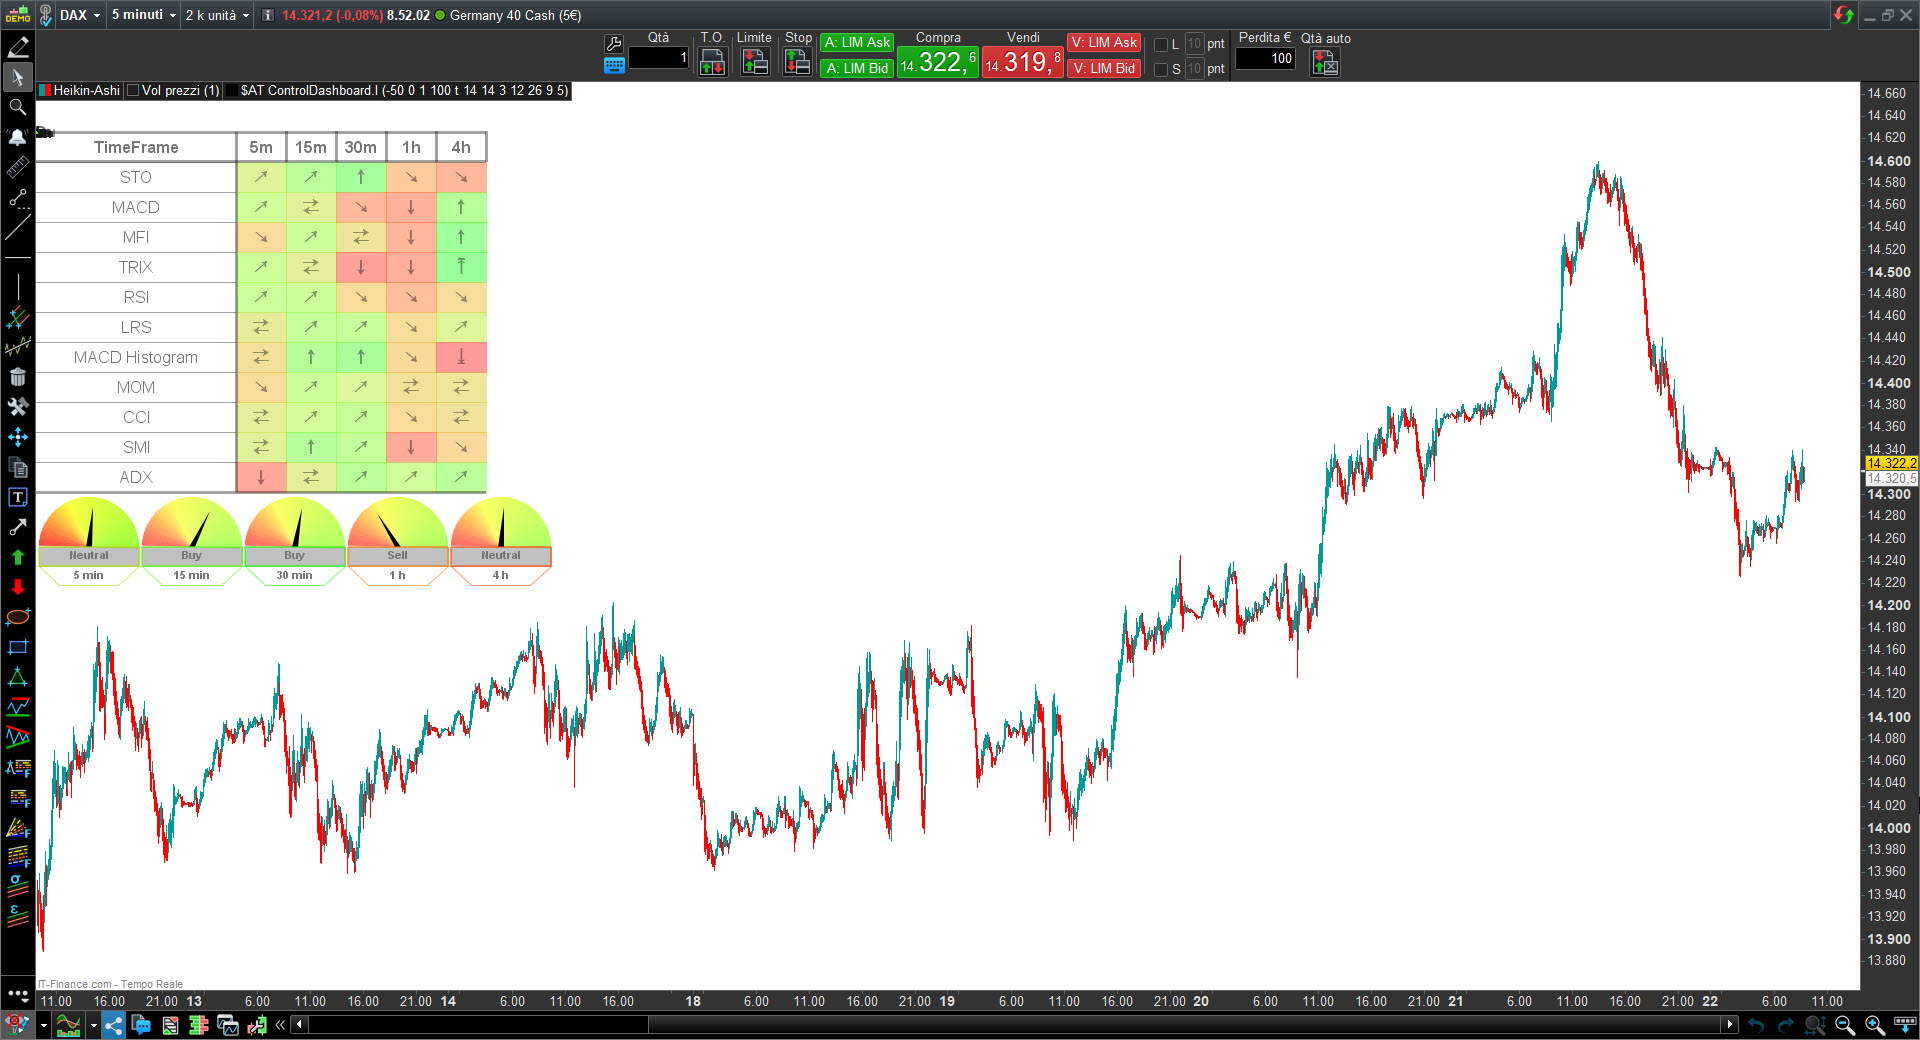
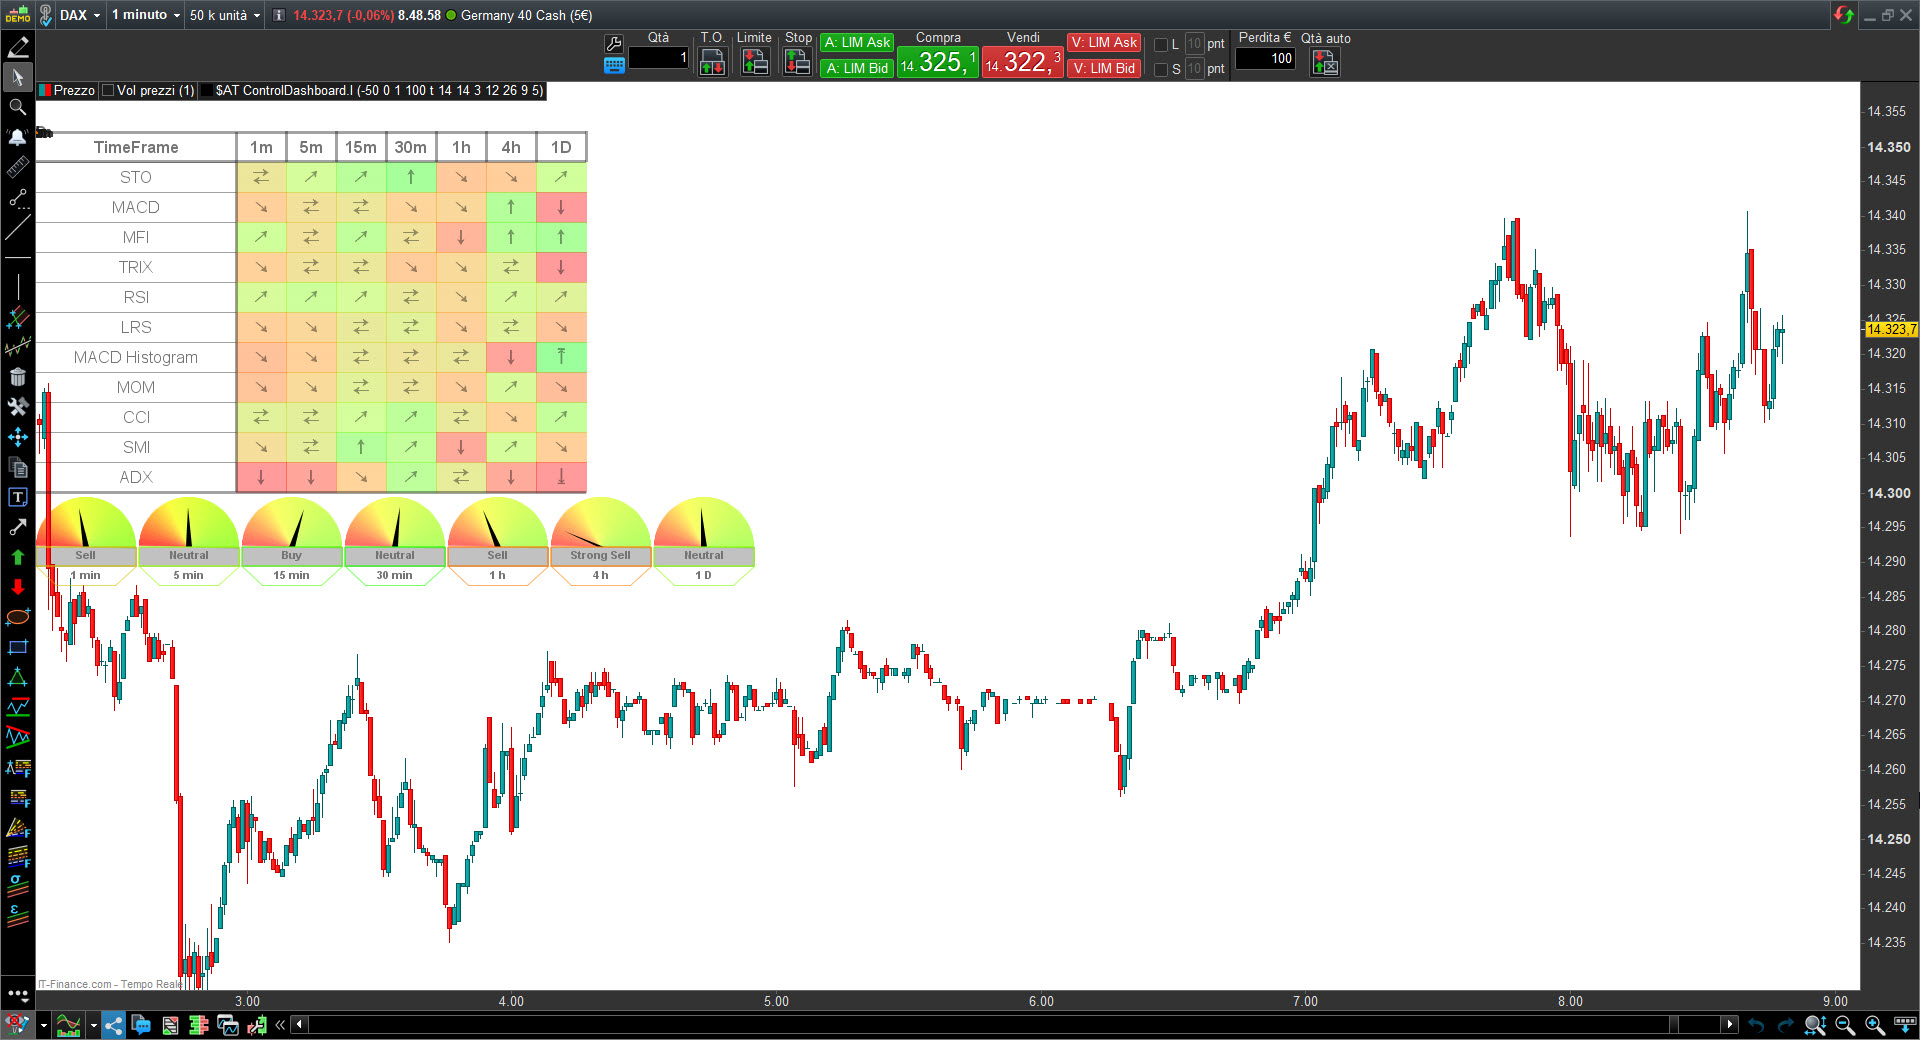
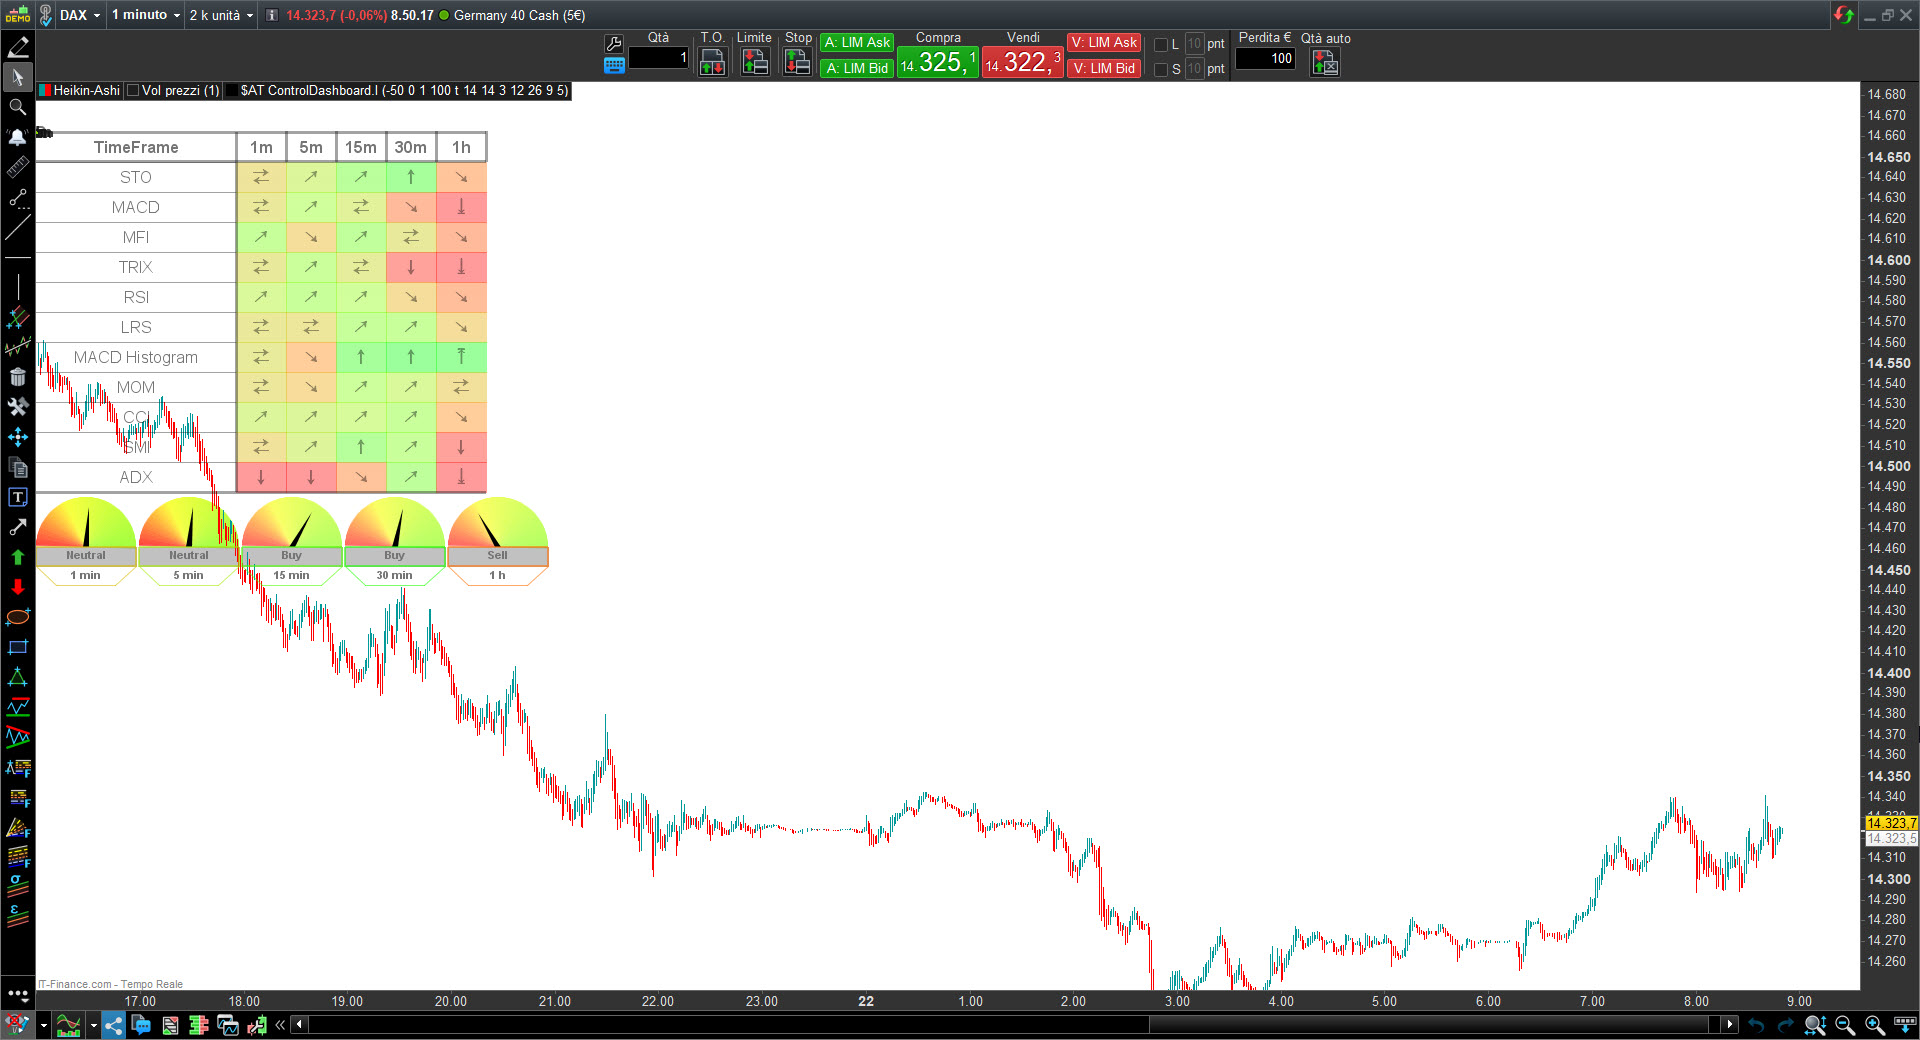
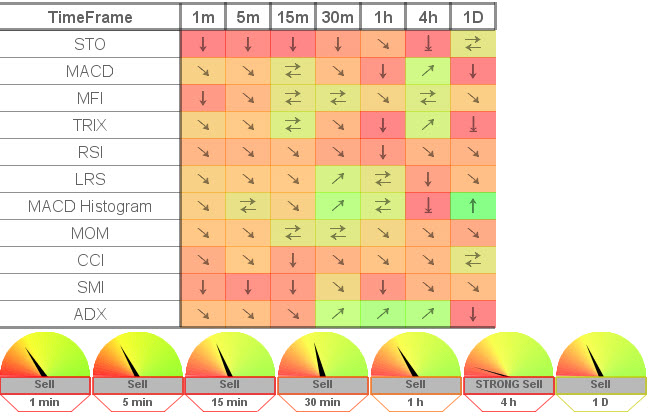
The Ultimate Trend DashBoard for ProRealTime provides the traders with a visual representation of the BULLISH or BEARISH market trend of all timeframes. The speedmeters provide BUY and SELL trading signals, up to 7 different timeframes.
This indicator show you in real time the trends of market as results of a mixed of oscillators for each timeframe.
The adjustable dashboard settings:
- Positioning
- Sizing
- Opacity
SpeedMeter:
For each timeframe, a speedmeter shows you market sentiment signals: BUY, SELL, STRONG BUY, STRONG SELL or NEUTRAL, that results from a analyze of all oscillators.
In prorealtime, the multi time frame function provides that only the upper time frames can be displayed, since the data of the higher time frames are not available.
To obtain the data of the higher timeframes it is necessary to load on the chart a number of historical bars at least equal to the number of bars necessary to contain the data of the candlesticks of the higher timeframes.
This is technically mandatory to obtain the required data to give signals by codes. Without these datas, no signals, so please follow the above instructions.
Interface settings:
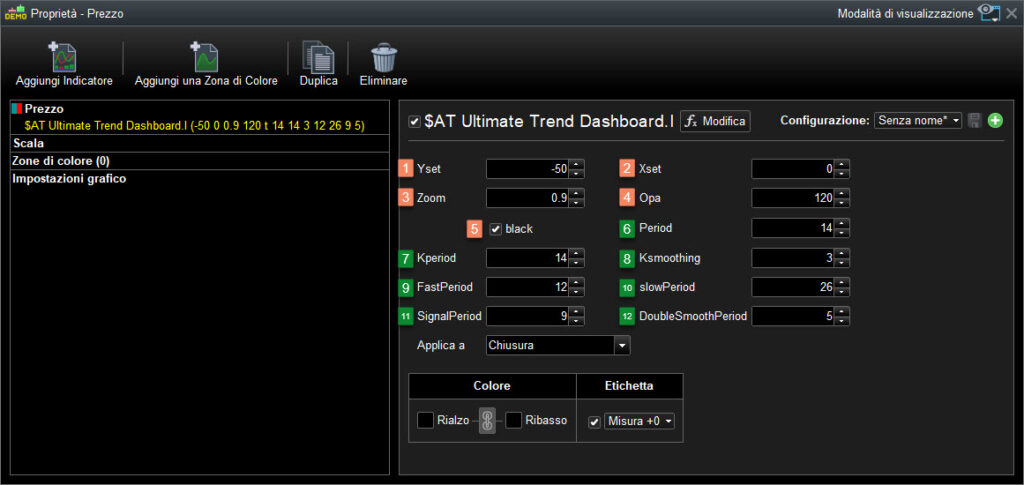
- Yset: Move the dashboard on the Y axis, (up / down)
- Xset: Move the dashboard on the X axis, (left/ right)
- Zoom: To set up Zoom (Set up dimensions of the dashboard)
- Opa: To set up opacity
- Black: To set text and dashboard lines in black color for light background
- Period: Set period of the following oscillators: RSI ; CCI ; ADX ; MOM ; MFI ; TRIX ; LRS.
- Kperiod: Set period of the following oscillators: STO ; SMI.
- Ksmoothing: Set period of the following oscillators: STO ; SMI.
- FastPeriod: Set period of the following oscillators: MACD.
- SlowPeriod: Set period of the following oscillators: MACD.
- SignalPeriod: Set period of the following oscillators: MACD .
- DoubleSmoothPeriod: Set period of the following oscillators: STO ; SMI.
Advantages of using the “Ultimate Trend Dashboard”:
Get instantaneously the trading bias of 11 different oscillators in real time and up to 7 different timeframes! (from 1 minute timeframe to daily timeframe).
- LRS = Linear Regression Slope
- RSI = Relative Strength index oscillator
- MACD = Moving Average Convergence Divergence oscillator
- MACD histogram = Moving Average Convergence Divergence oscillator
- CCI = Commodity Channel index oscillator
- STO = Stochastic oscillator
- SMI = Stochastic Momentum index oscillator
- ADX = Average directional oscillator index
- MOM = Momentum oscillator
- MFI = Money Flow Index oscillator
- TRIX = Triple Exponential Average oscillator
————————————————————————————-
The indicator is completely customizable with a large range of settings available
This product works in any Futures, Forex or Stock/ETF Markets

lundbergselection (Verifizierter Besitzer) –
Das Ultimate Trend Dashboard hat meinen Handelsansatz erheblich verbessert, da es mühelos komplexe Oszillatoren zusammenfasst und eine klare Marktstimmung liefert. Seine Vielseitigkeit ist unübertroffen und eignet sich für alle, vom Scalper bis zum Swing-Trader. Ein herausragendes Merkmal ist die Kompatibilität mit allen ProRealTime-Instrumenten und -Zeitfenstern, die einen umfassenden Überblick gewährleistet. Seine Aktualisierungen in Echtzeit sind von unschätzbarem Wert. Dieses Dashboard vereinfacht die Entscheidungsfindung und stärkt das Vertrauen in die Trades. Eine Top-Auswahl für ProRealTime-Benutzer.