This indicator detect trend on stocks and index.
It has been optimized for small timeframes.
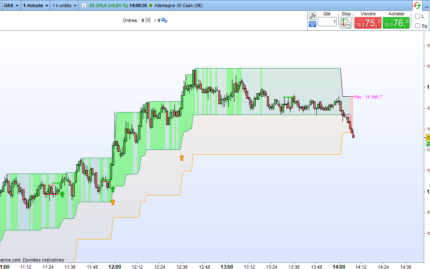
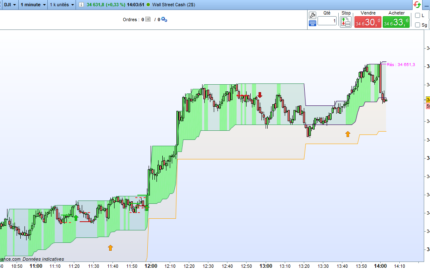
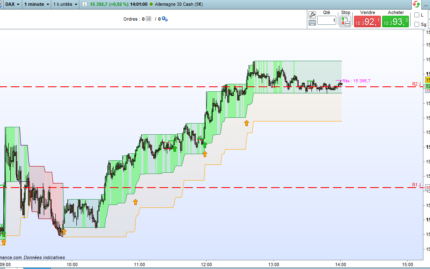
I use this indicator in timeframe 1 minute on DowJones and Dax when I do daytrading.
But you can use it in daily or weekly timeframes too.
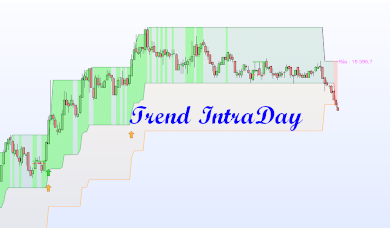
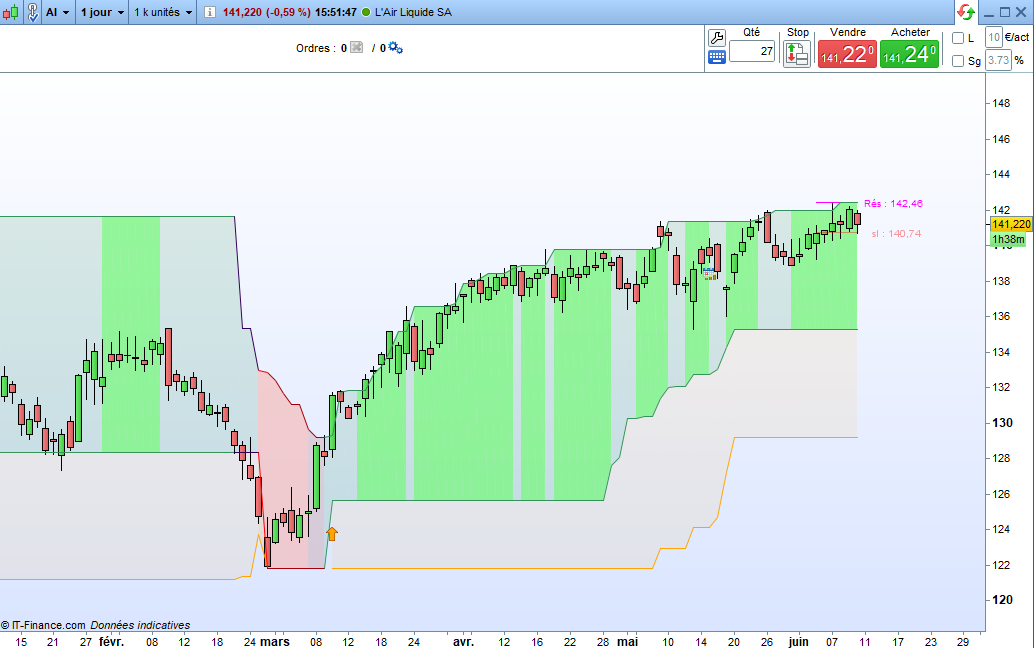
When I do trendfollowing on actions, I only search orange arrows.
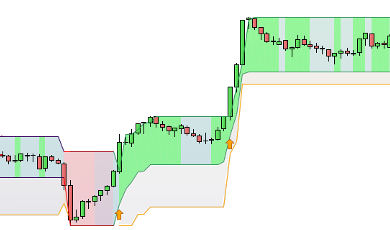
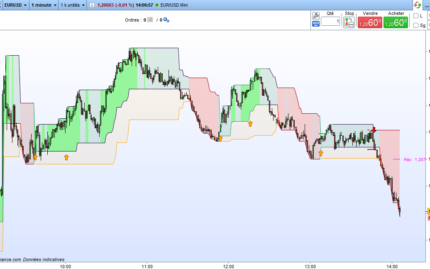
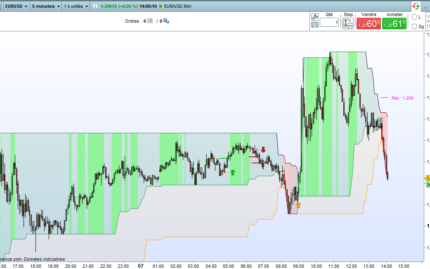
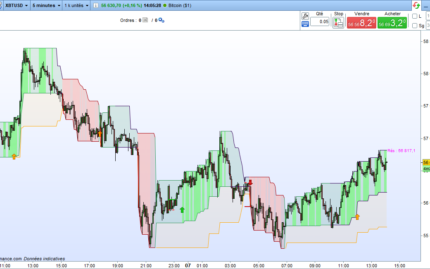
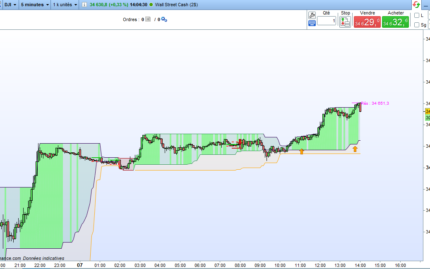
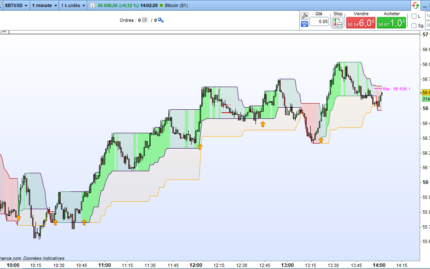
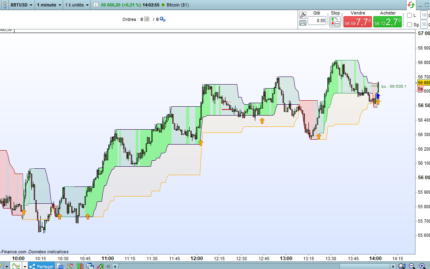
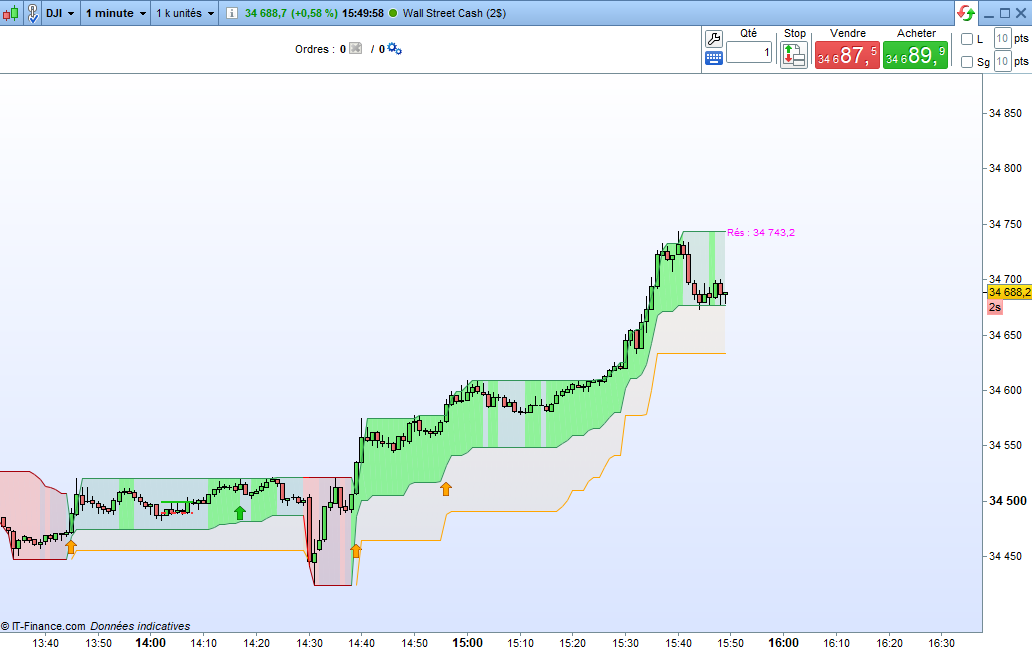
- a stock or index in a downtrend is displayed in a red channel. In this case we should only take sell positions.
- a stock or index in an uptrend is dispayed in a green channel. In this case we should only take buy positions.
Under the green channel, we can see a orange channel which is a no-trade zone. If the price is in this zone, we should wait before entering a position (buy or sell).
This indicator also shows some buying and selling points. Be careful, I advise you not to take a selling position when the signal is given in a uptrend, unless you have other indicators that allow you to identify a trend return.
- when a buying point is detected, a green segment is drawn and a dotted segment is drawn to indicate a possible stoploss. A green arrow is addeted when a signal is quite good.
- when a selling point is detected, a red segment is drawn and a dotted segment is drawn to indicate a possible stoploss. A red arrow is addeted when a signal is quite good.
- a orange arrow is drawn when we begin a uptrend or a there is a good breakout in an uptrend. This is the better signal to take a buying position.
In the video below, you have an example of the use of the “Breakout detector” and “Trend intraday” indicators:
Advantages:
- you can identify quickly the trend and make no overtrading.
- this indicator can be combinated with my “breakout”.
- a screener is available to detect those signals on a list of stocks/index.




Gilles Goblet (Verifizierter Besitzer) –
Auch wenn dieser Indikator für den Intraday-Handel entwickelt wurde, funktioniert er in Verbindung mit dem gleichnamigen Screener auch sehr gut beim Swing-Trading. Ein Lob an den Entwickler.