Works on all Timeframes
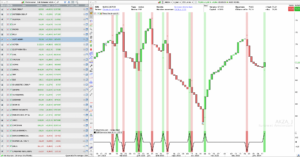
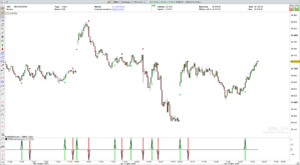
Works on Price Charts as well as 3 Line Break charts.
To adjust indicator parameters, simply open the configuration menu :
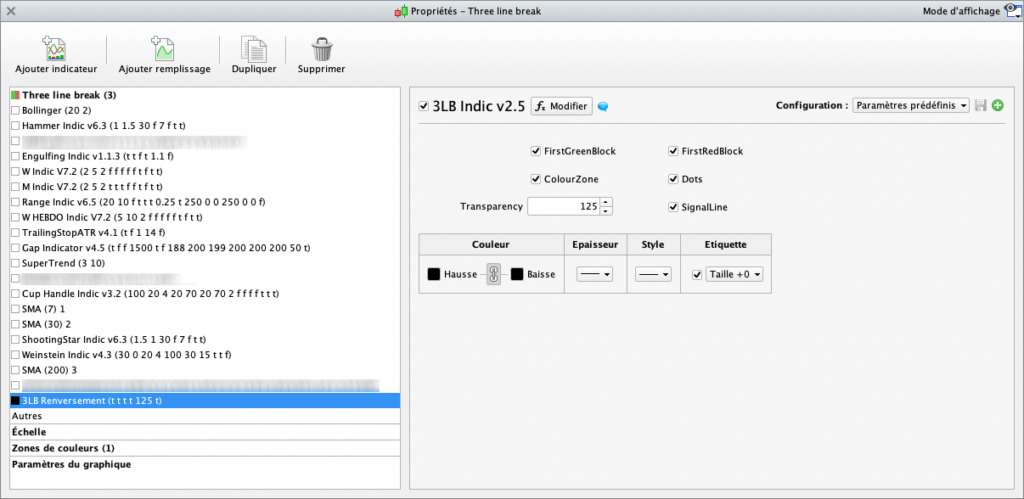 The values shown above are given, as examples and do not constitute an optimal or recommended setting, everyone should find his own settings.
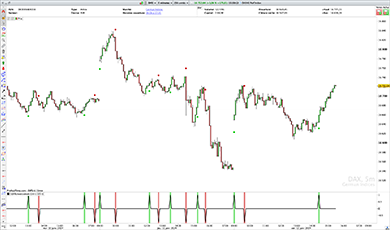
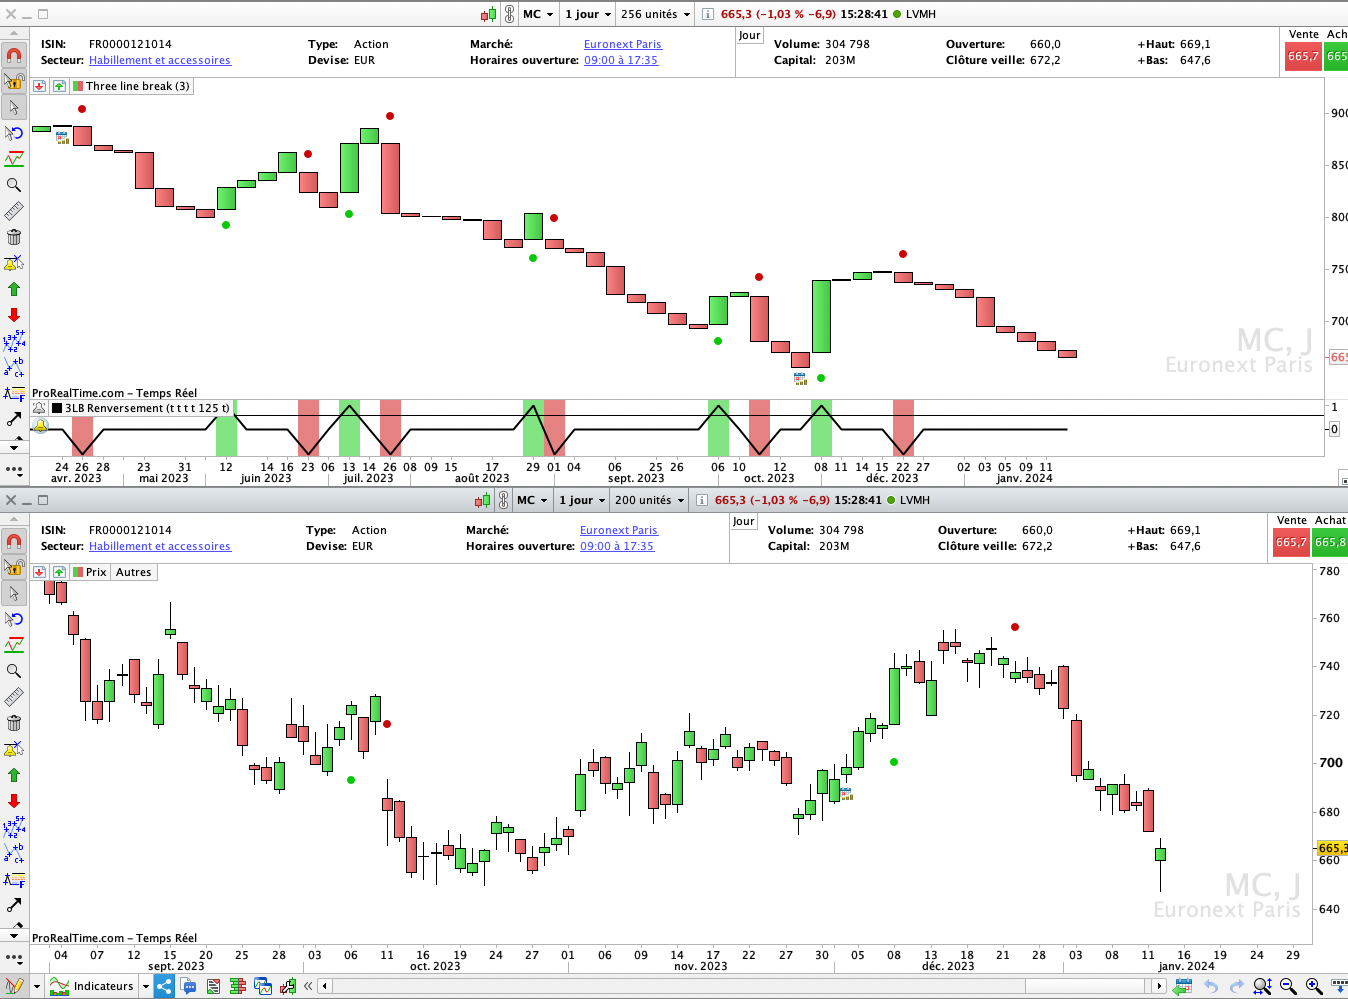
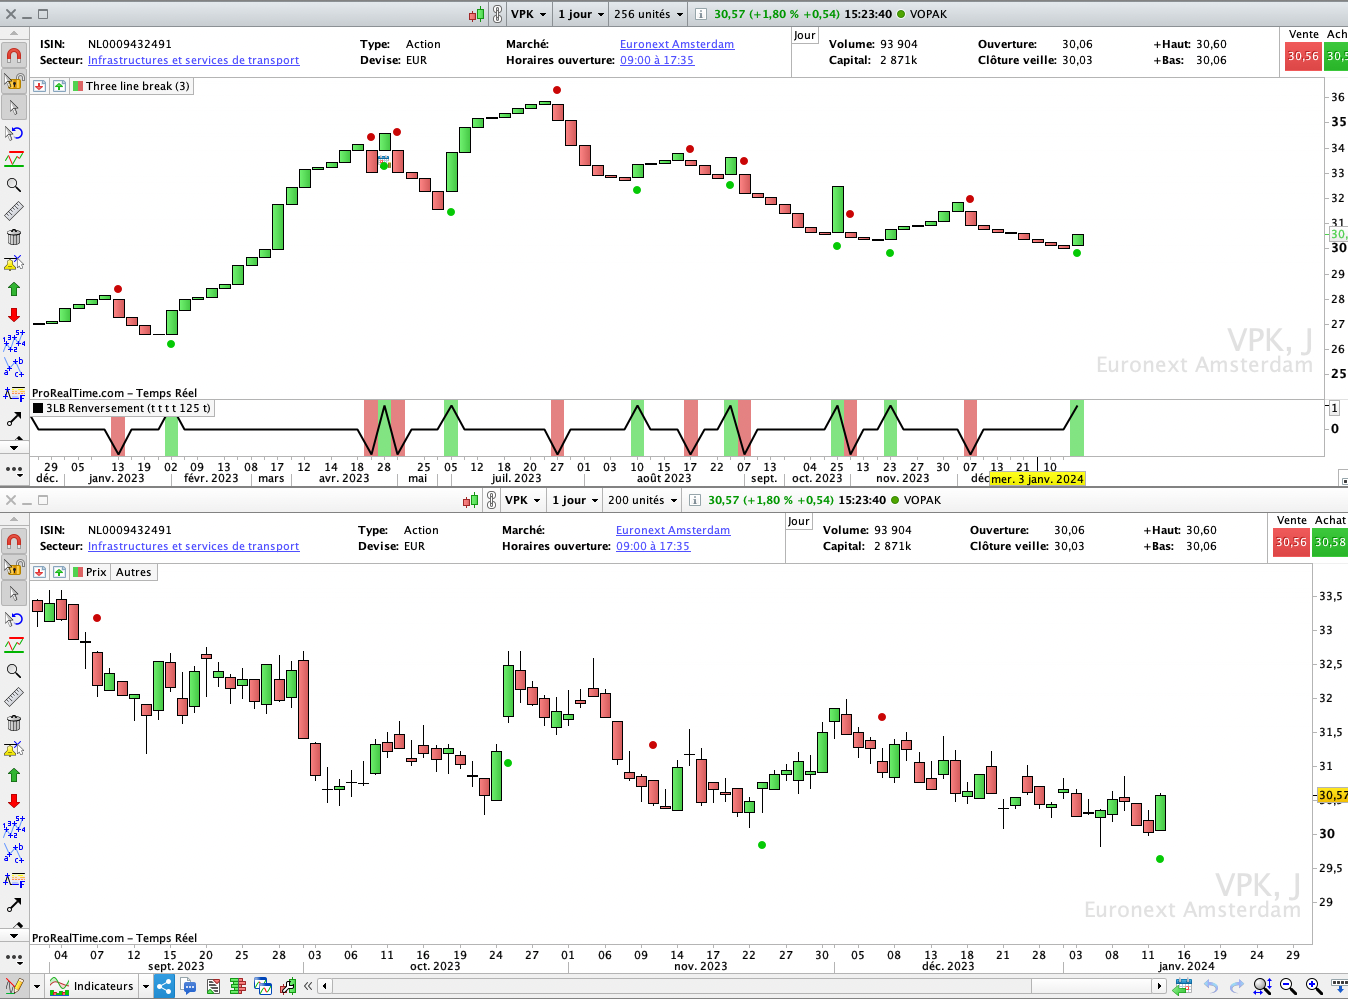
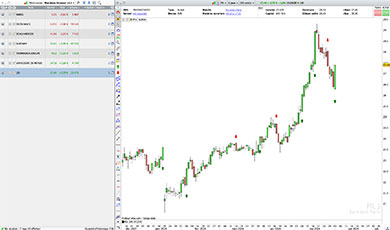
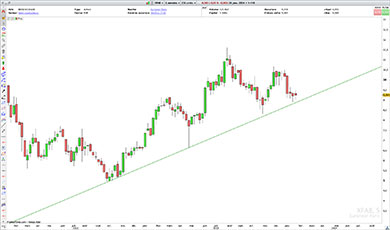
The indicator can be displayed on both 3LB and Price charts.
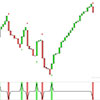
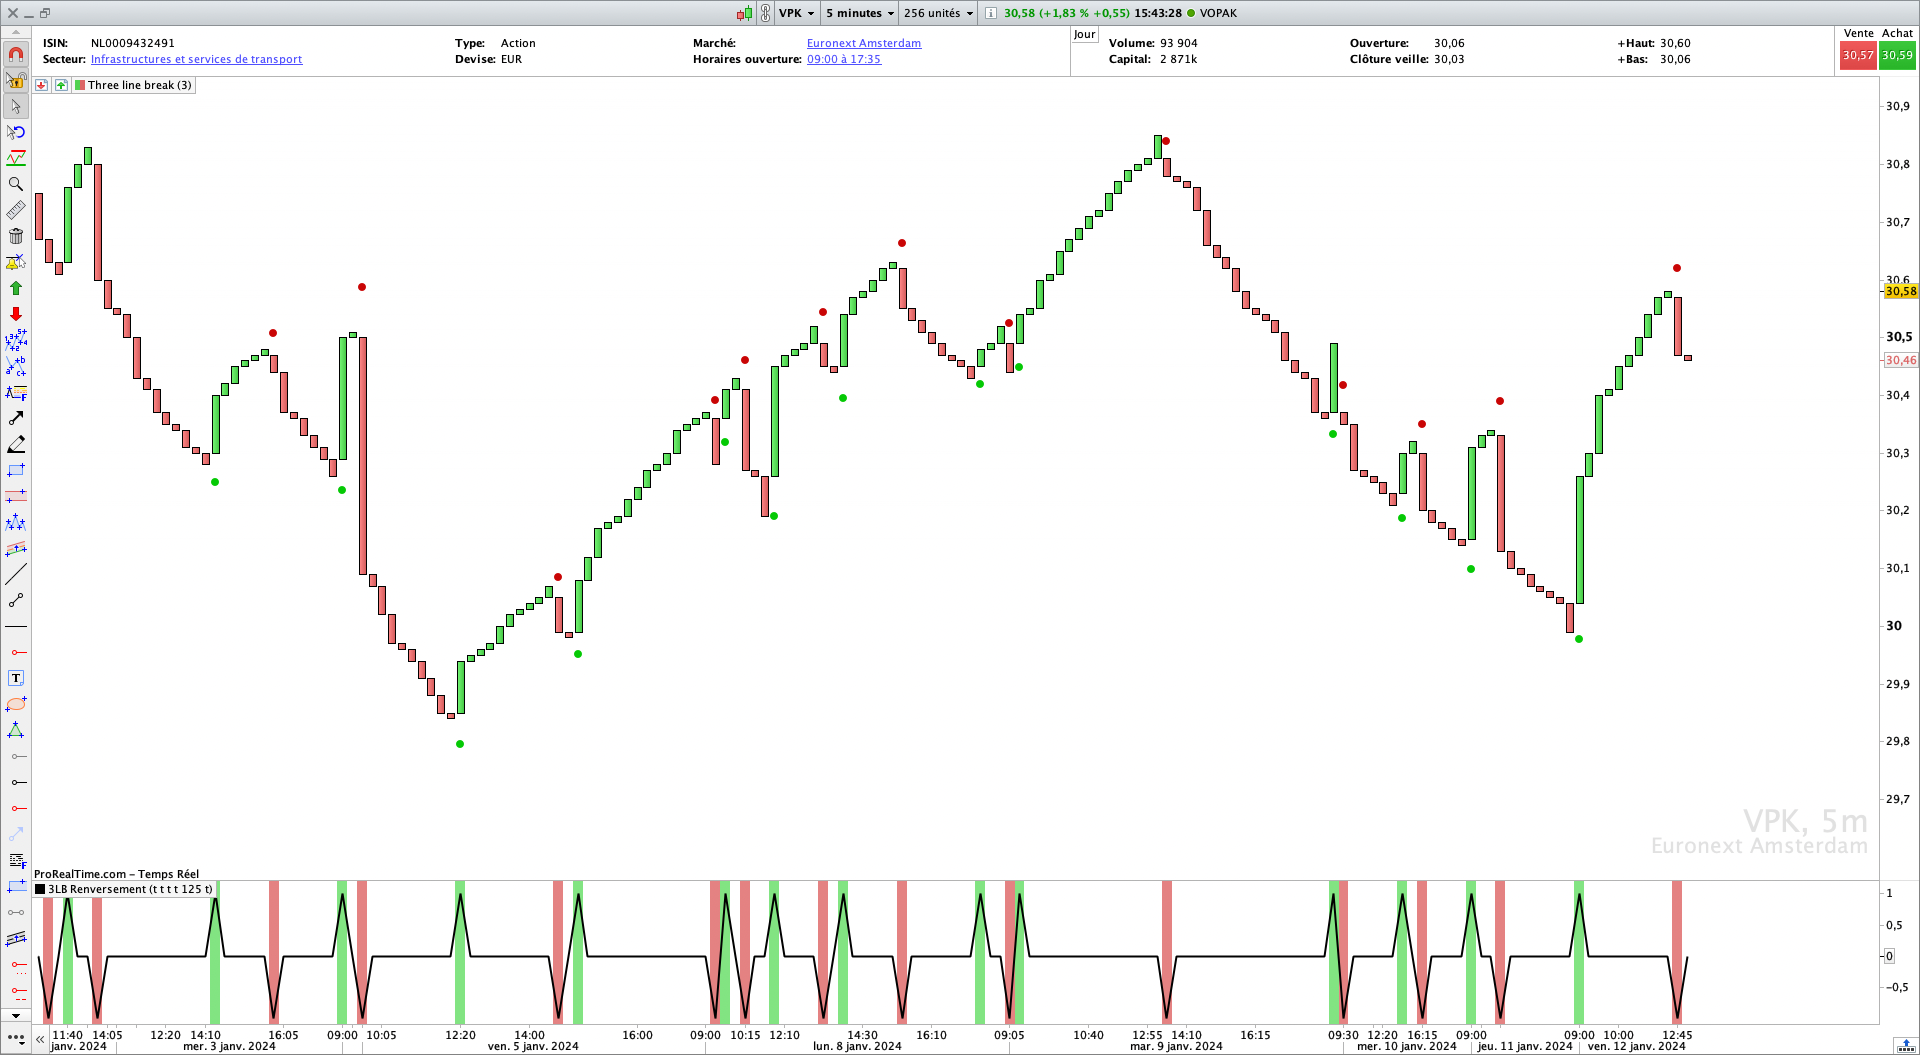
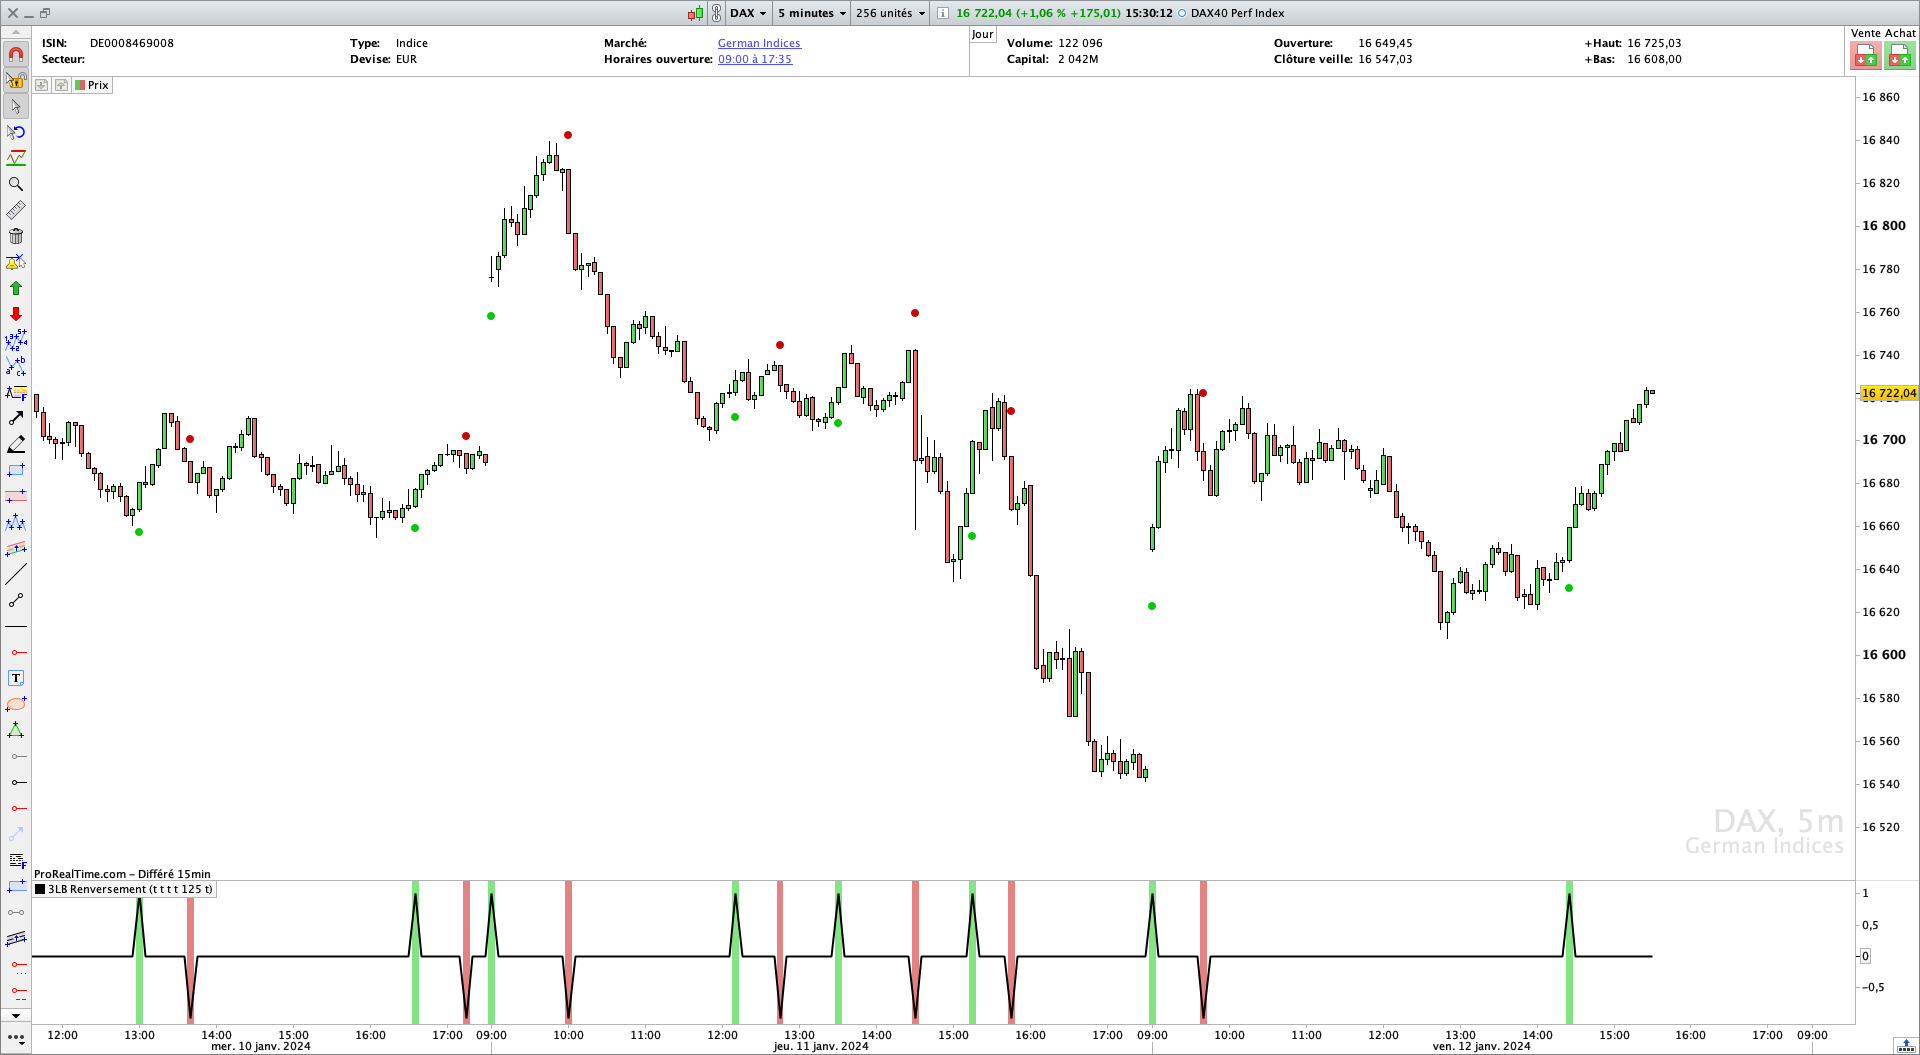
The Green and Red dots in the images below are the 1st green and red blocks on the 3LB chart, and the corresponding candles on the Price chart.
The indicator can be displayed on the chart or in a window below the price (like the RSI, for example).
Display depends on the settings available in the configuration menu.
To avoid overloading the graph, deactivate the coloured areas and the signal line and keep the dots.
The Signal line is useful for setting an alarm when the indicator is in a window below the graph. The signal line is 0 and changes to 1 = first green block and changes to -1 = first red block. Example: set an alarm to 1 to be warned when the first green block appears.
Use our Three Line Break reversal Screener to find stocks making a first green / red block.
Availables filters :
- Draw 1st green block,
- Draw 1st red block..
Display options :
- Colour zones,
- Coloured dots,
- Adjust the display transparency,
- Acitvate the Signal Line.
Characteristics :
- Works on all TimeFrames
- ProRealTime V11 and later versions compatible
- Free ProRealTime (daily closings) compatible
- Automatic and free updates
Watch the video user’s guide on our Youtube channel, subtitles available in English :
🇫🇷 Three Line Break / 🇮🇹 Interruzione di tre linee / 🇩🇪 Drei Zeilenumbrüche / 🇪🇸 Salto de tres líneas



Bewertungen
Es gibt noch keine Bewertungen.