Stochastic Power Trend Indicator
The Stochastic Power Trend Indicator is a tool that provides precise entry points to act when the market is trending, particularly during a pause between successive waves.
The algorithm utilizes stochastic indicators across multiple time frames and triggers in five typical configurations, but only under particularly favorable conditions to maximize the success rate.
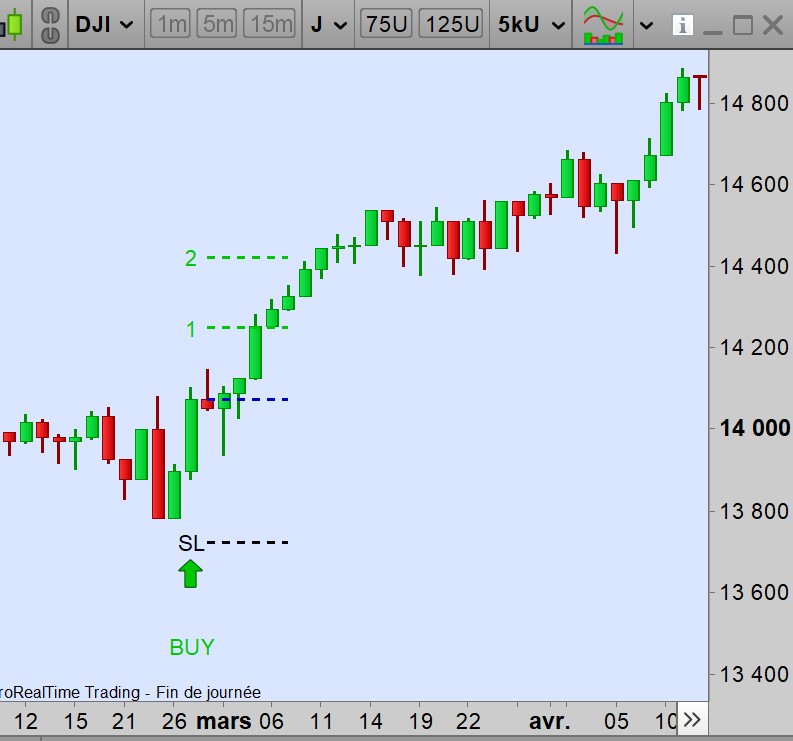
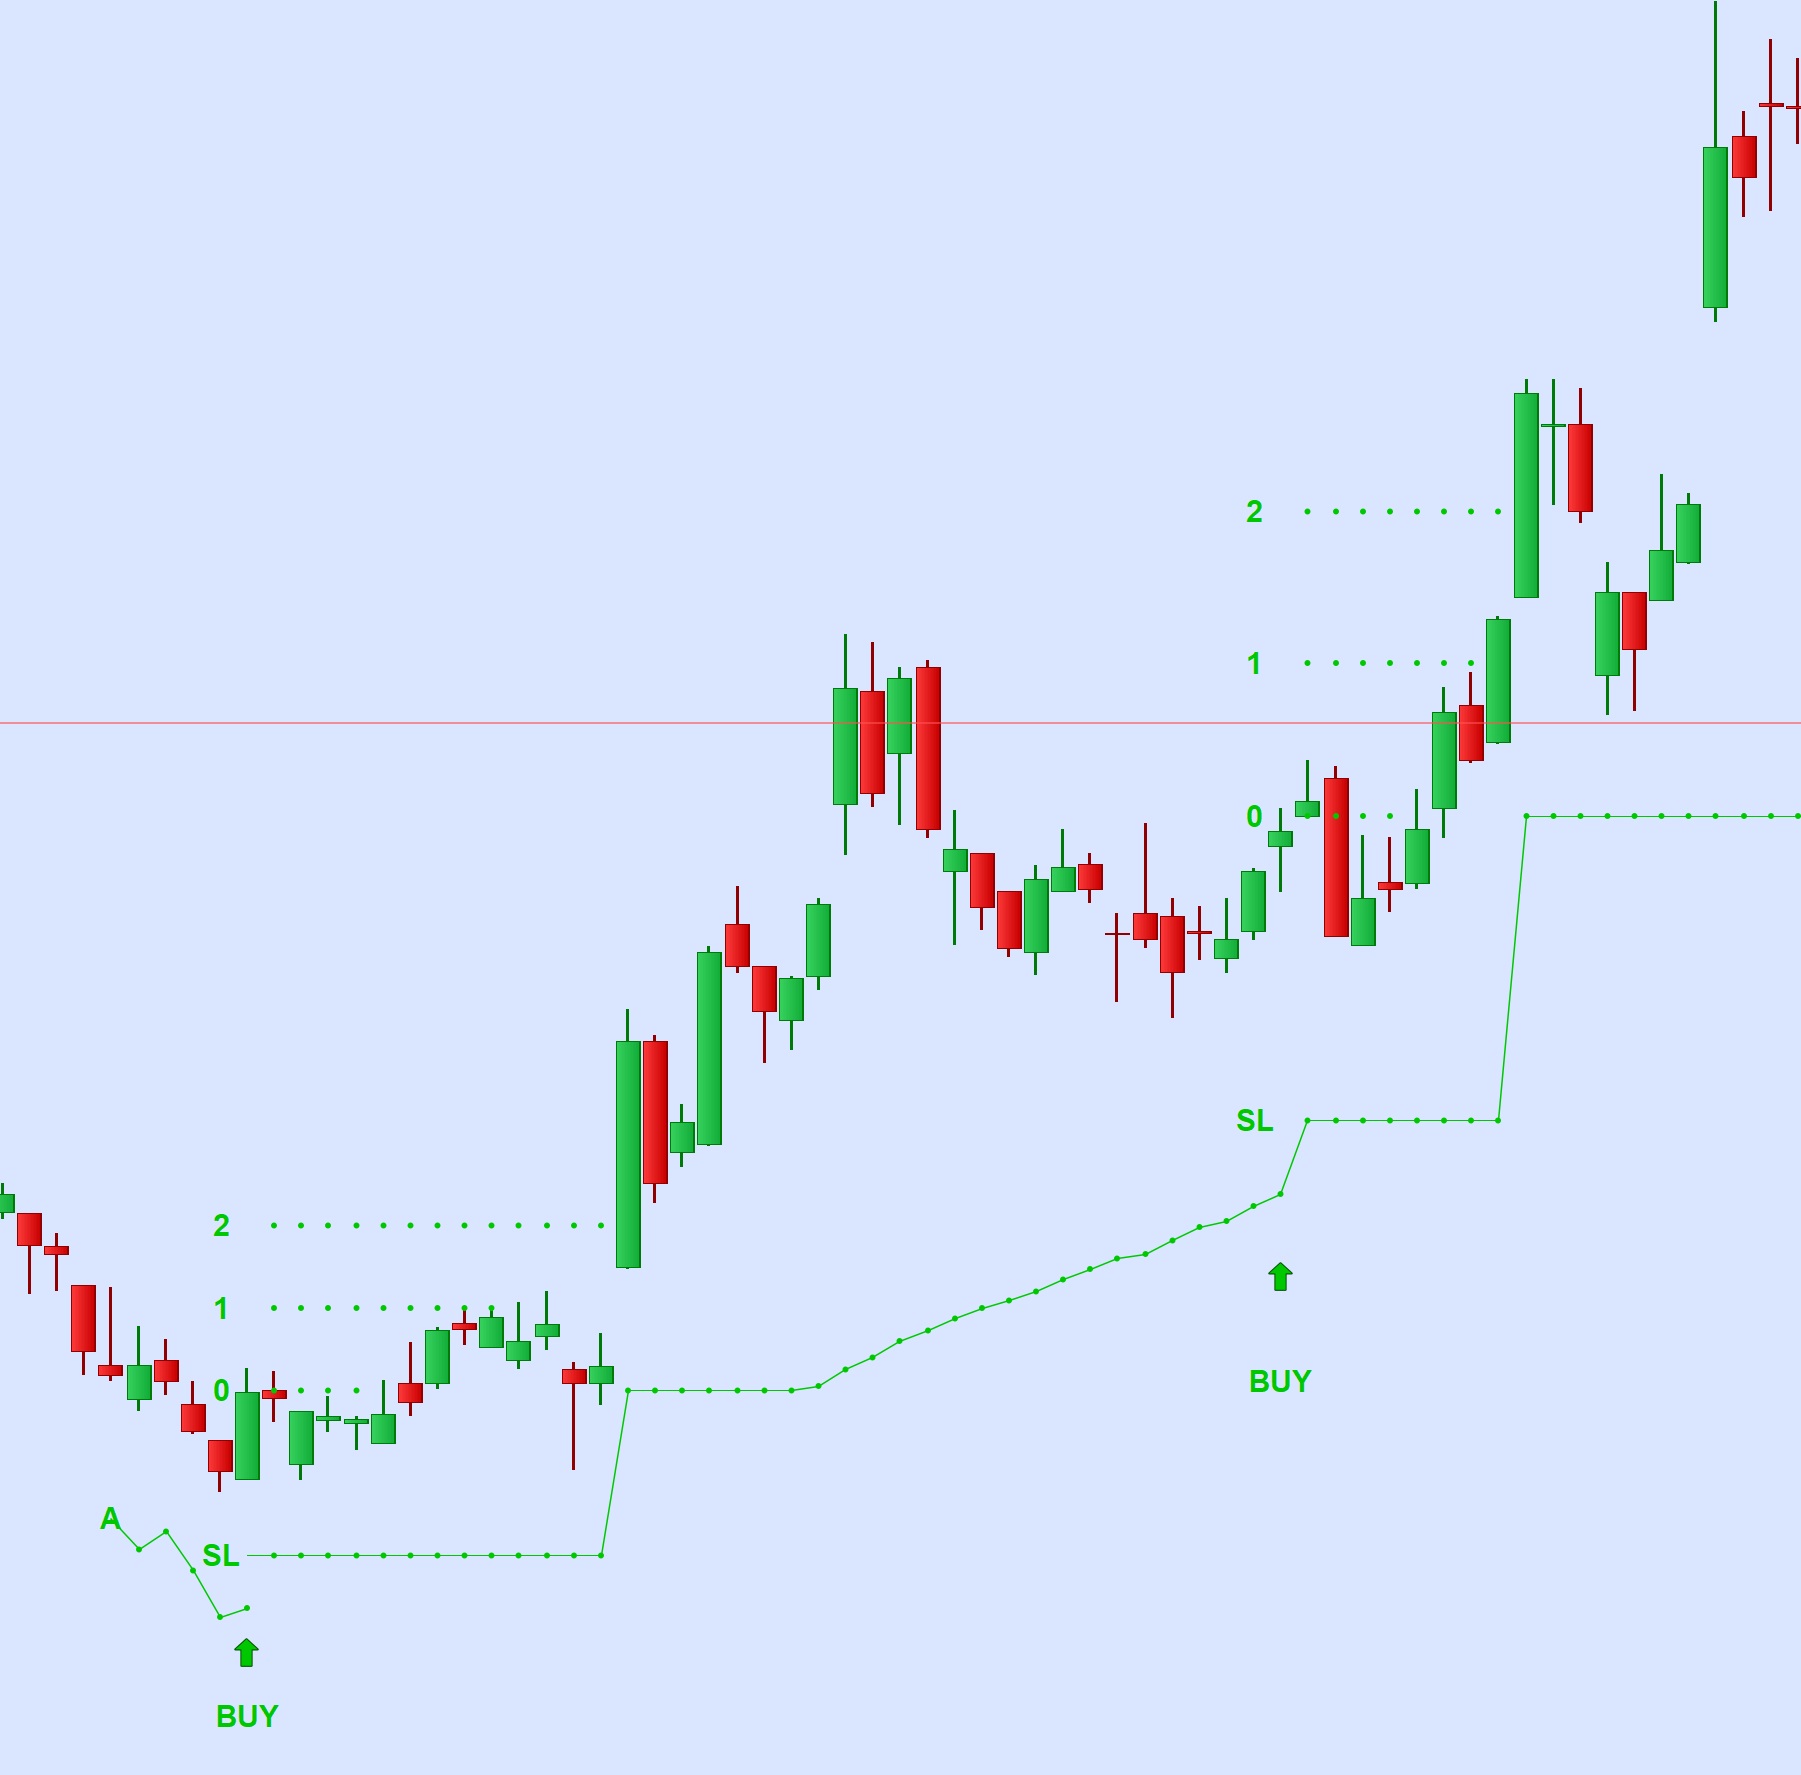
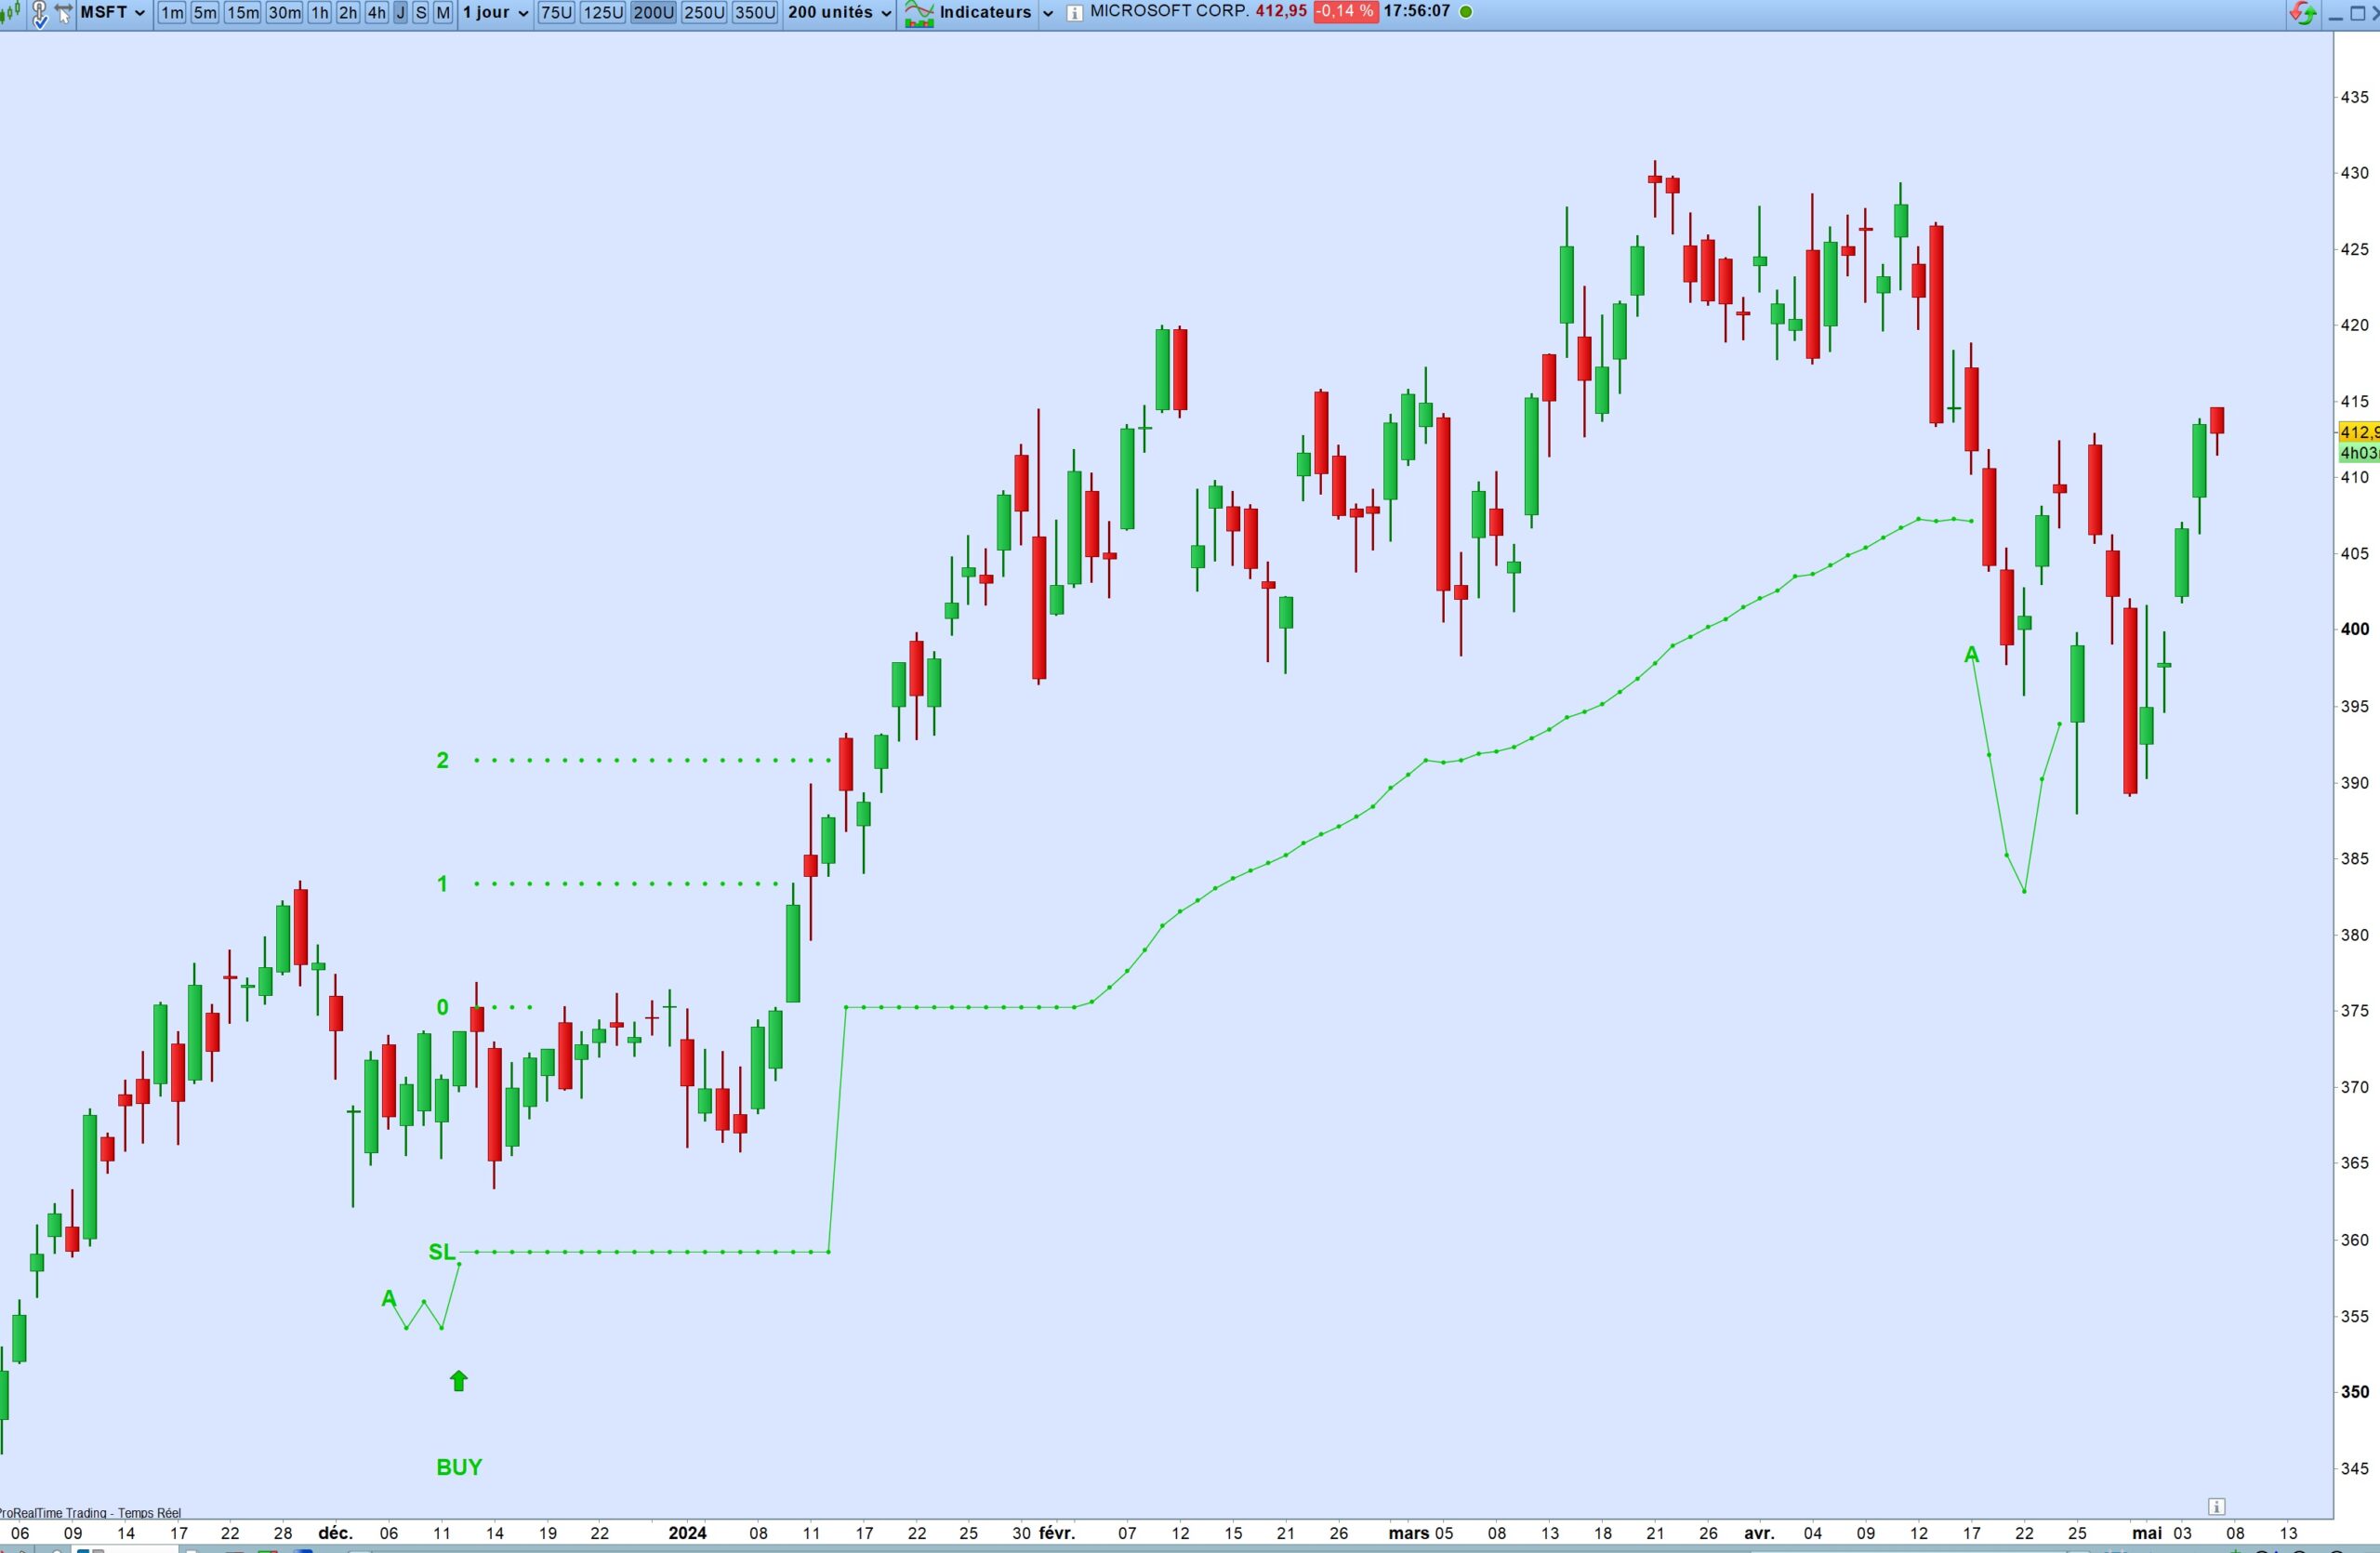
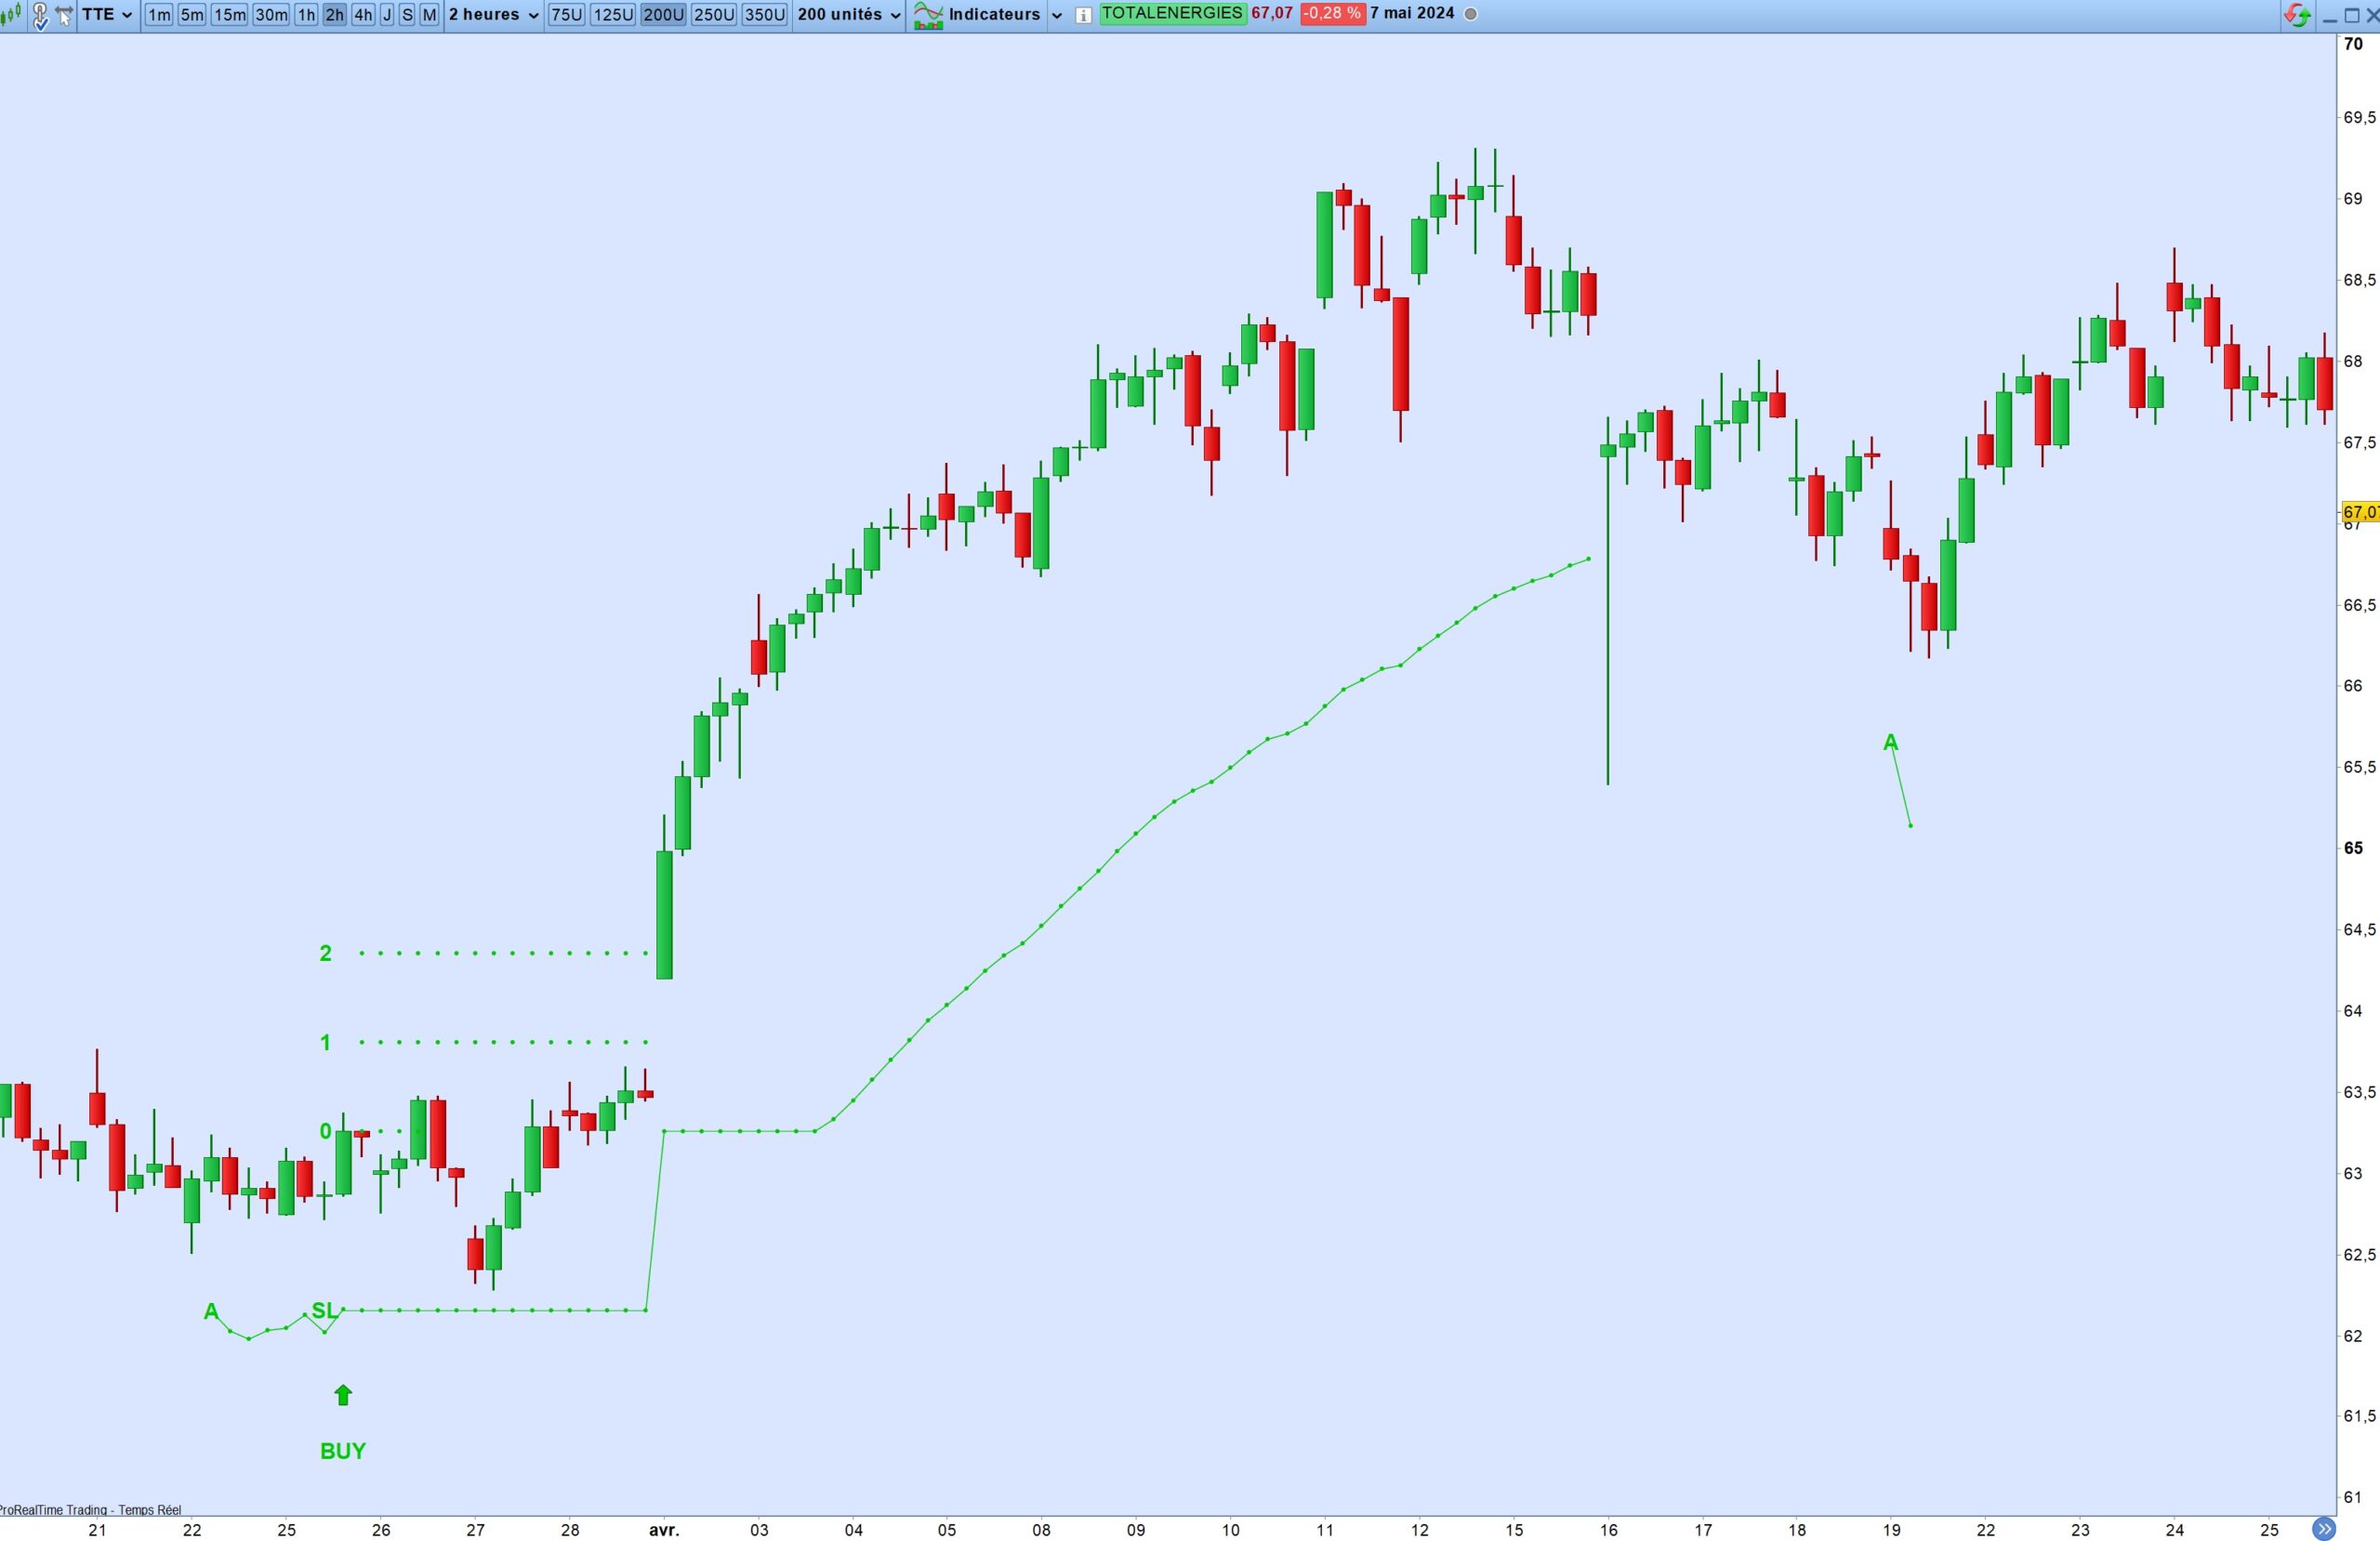
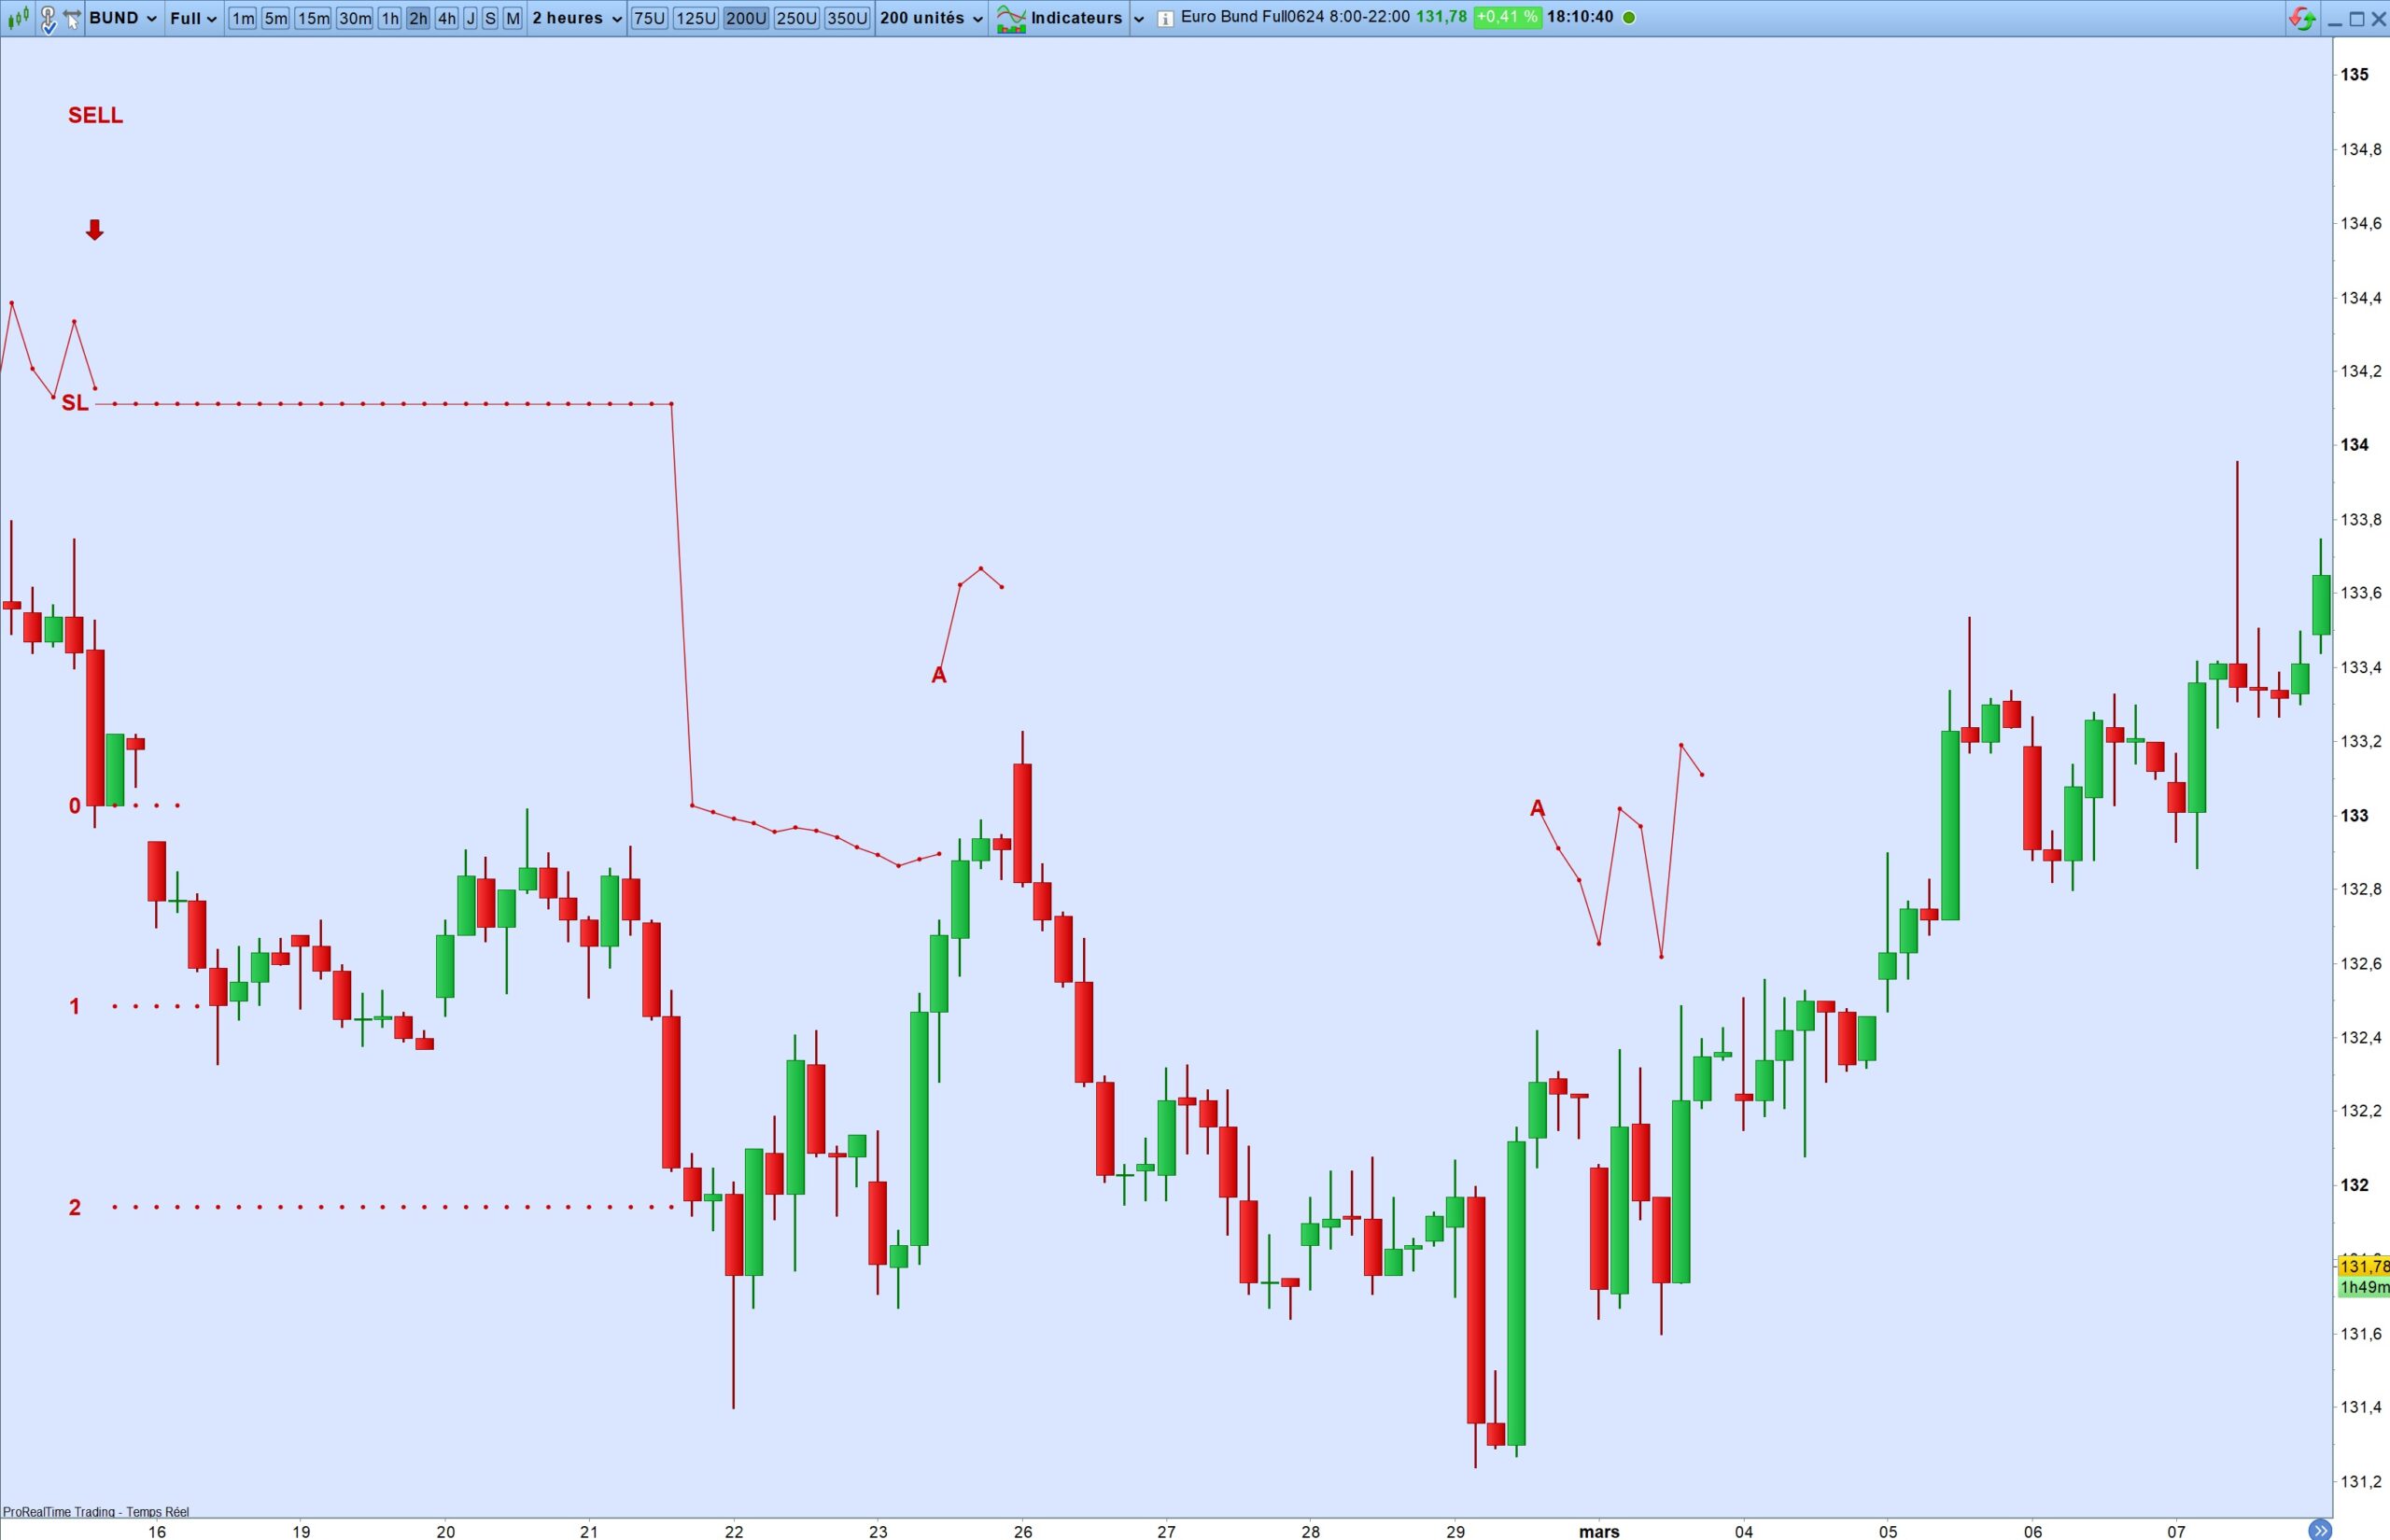
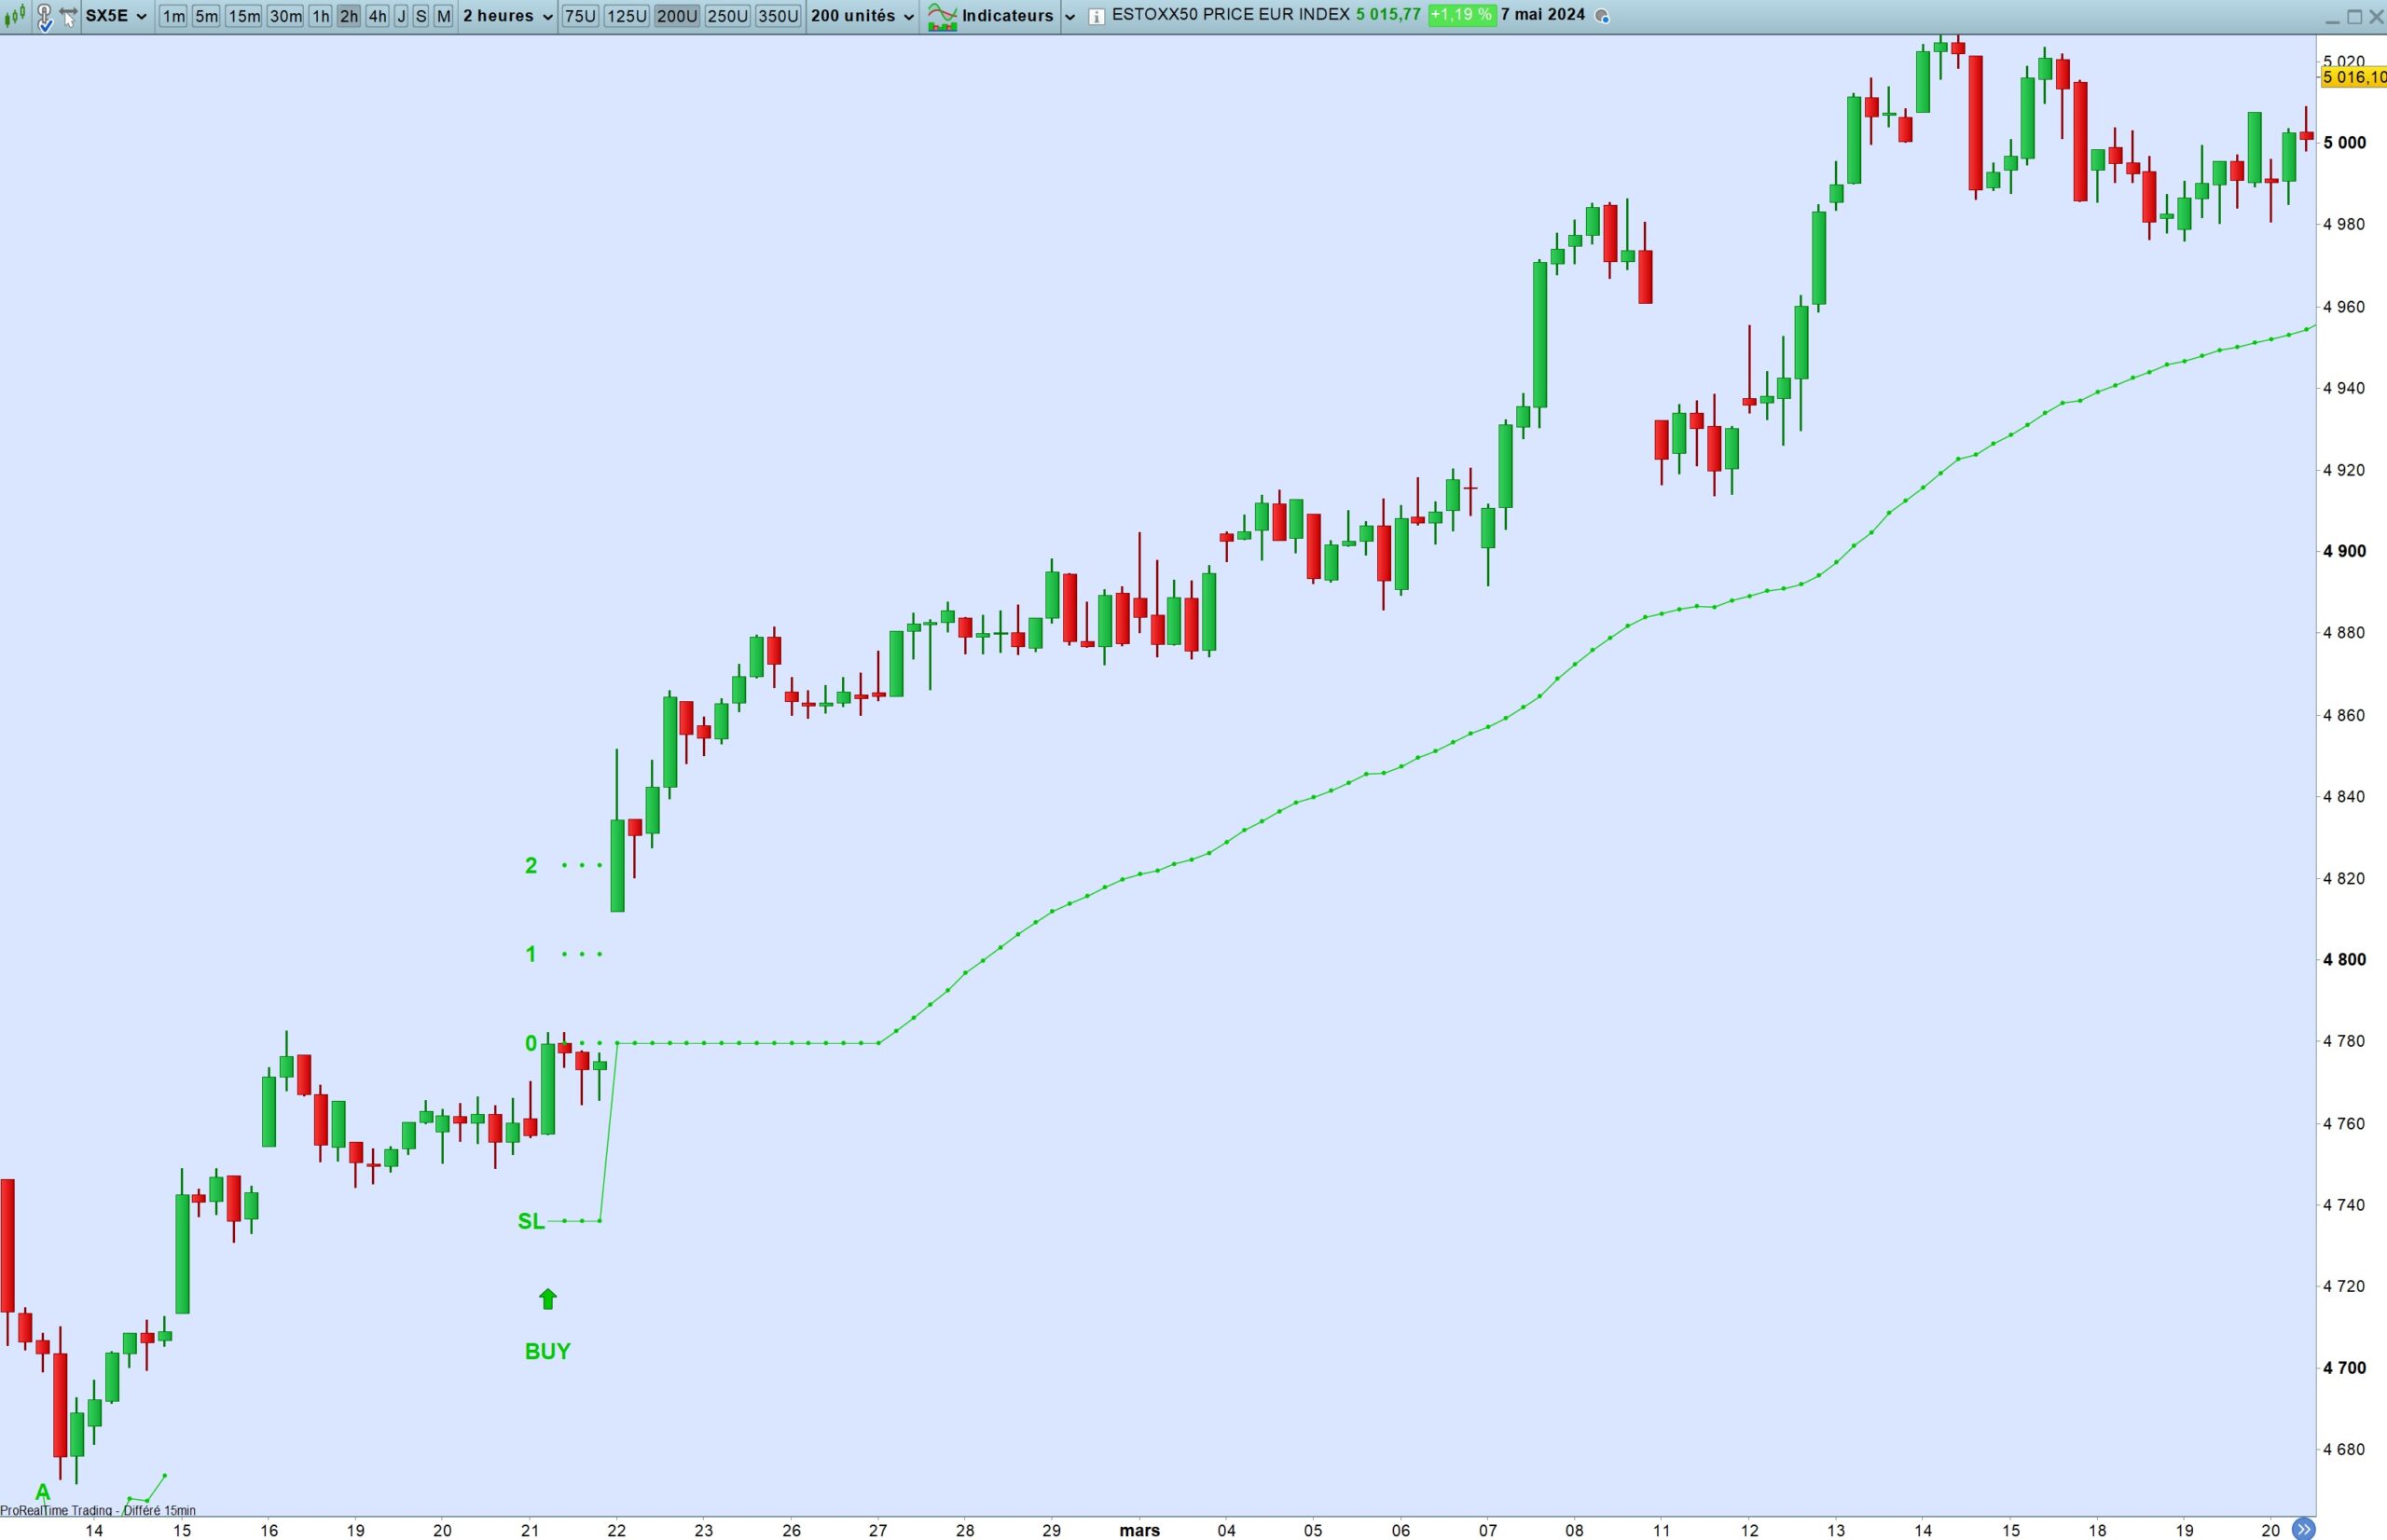
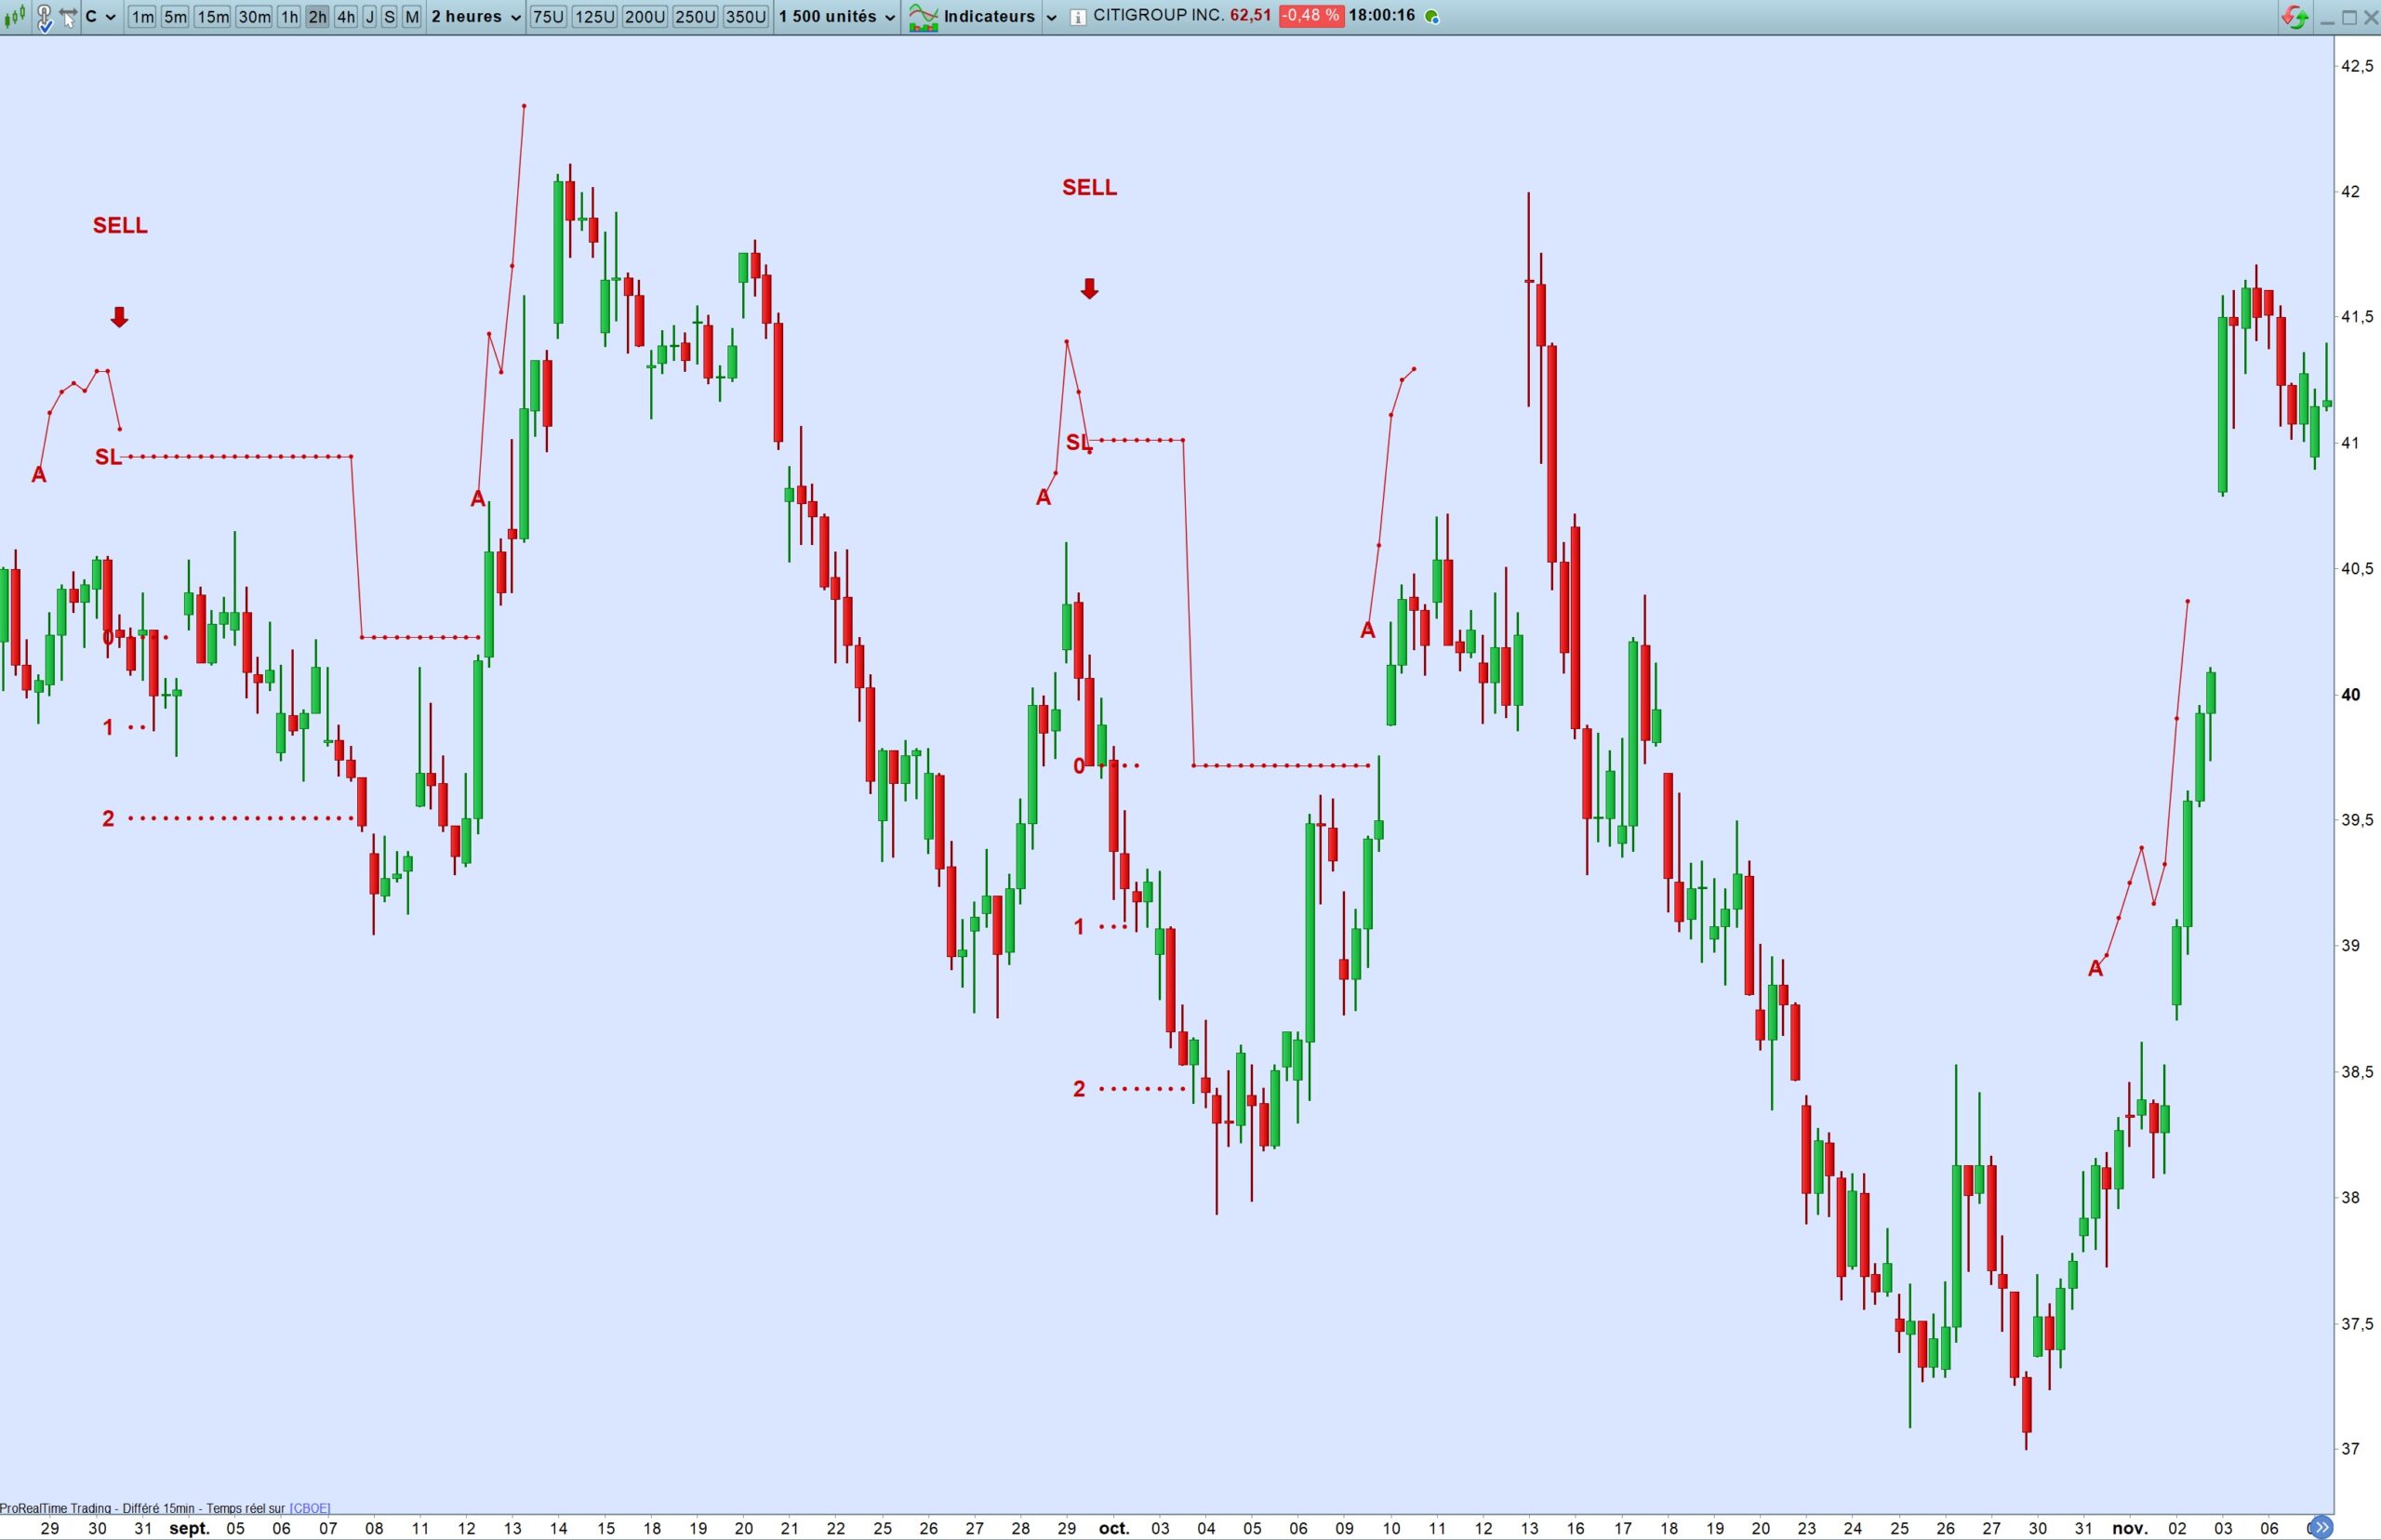
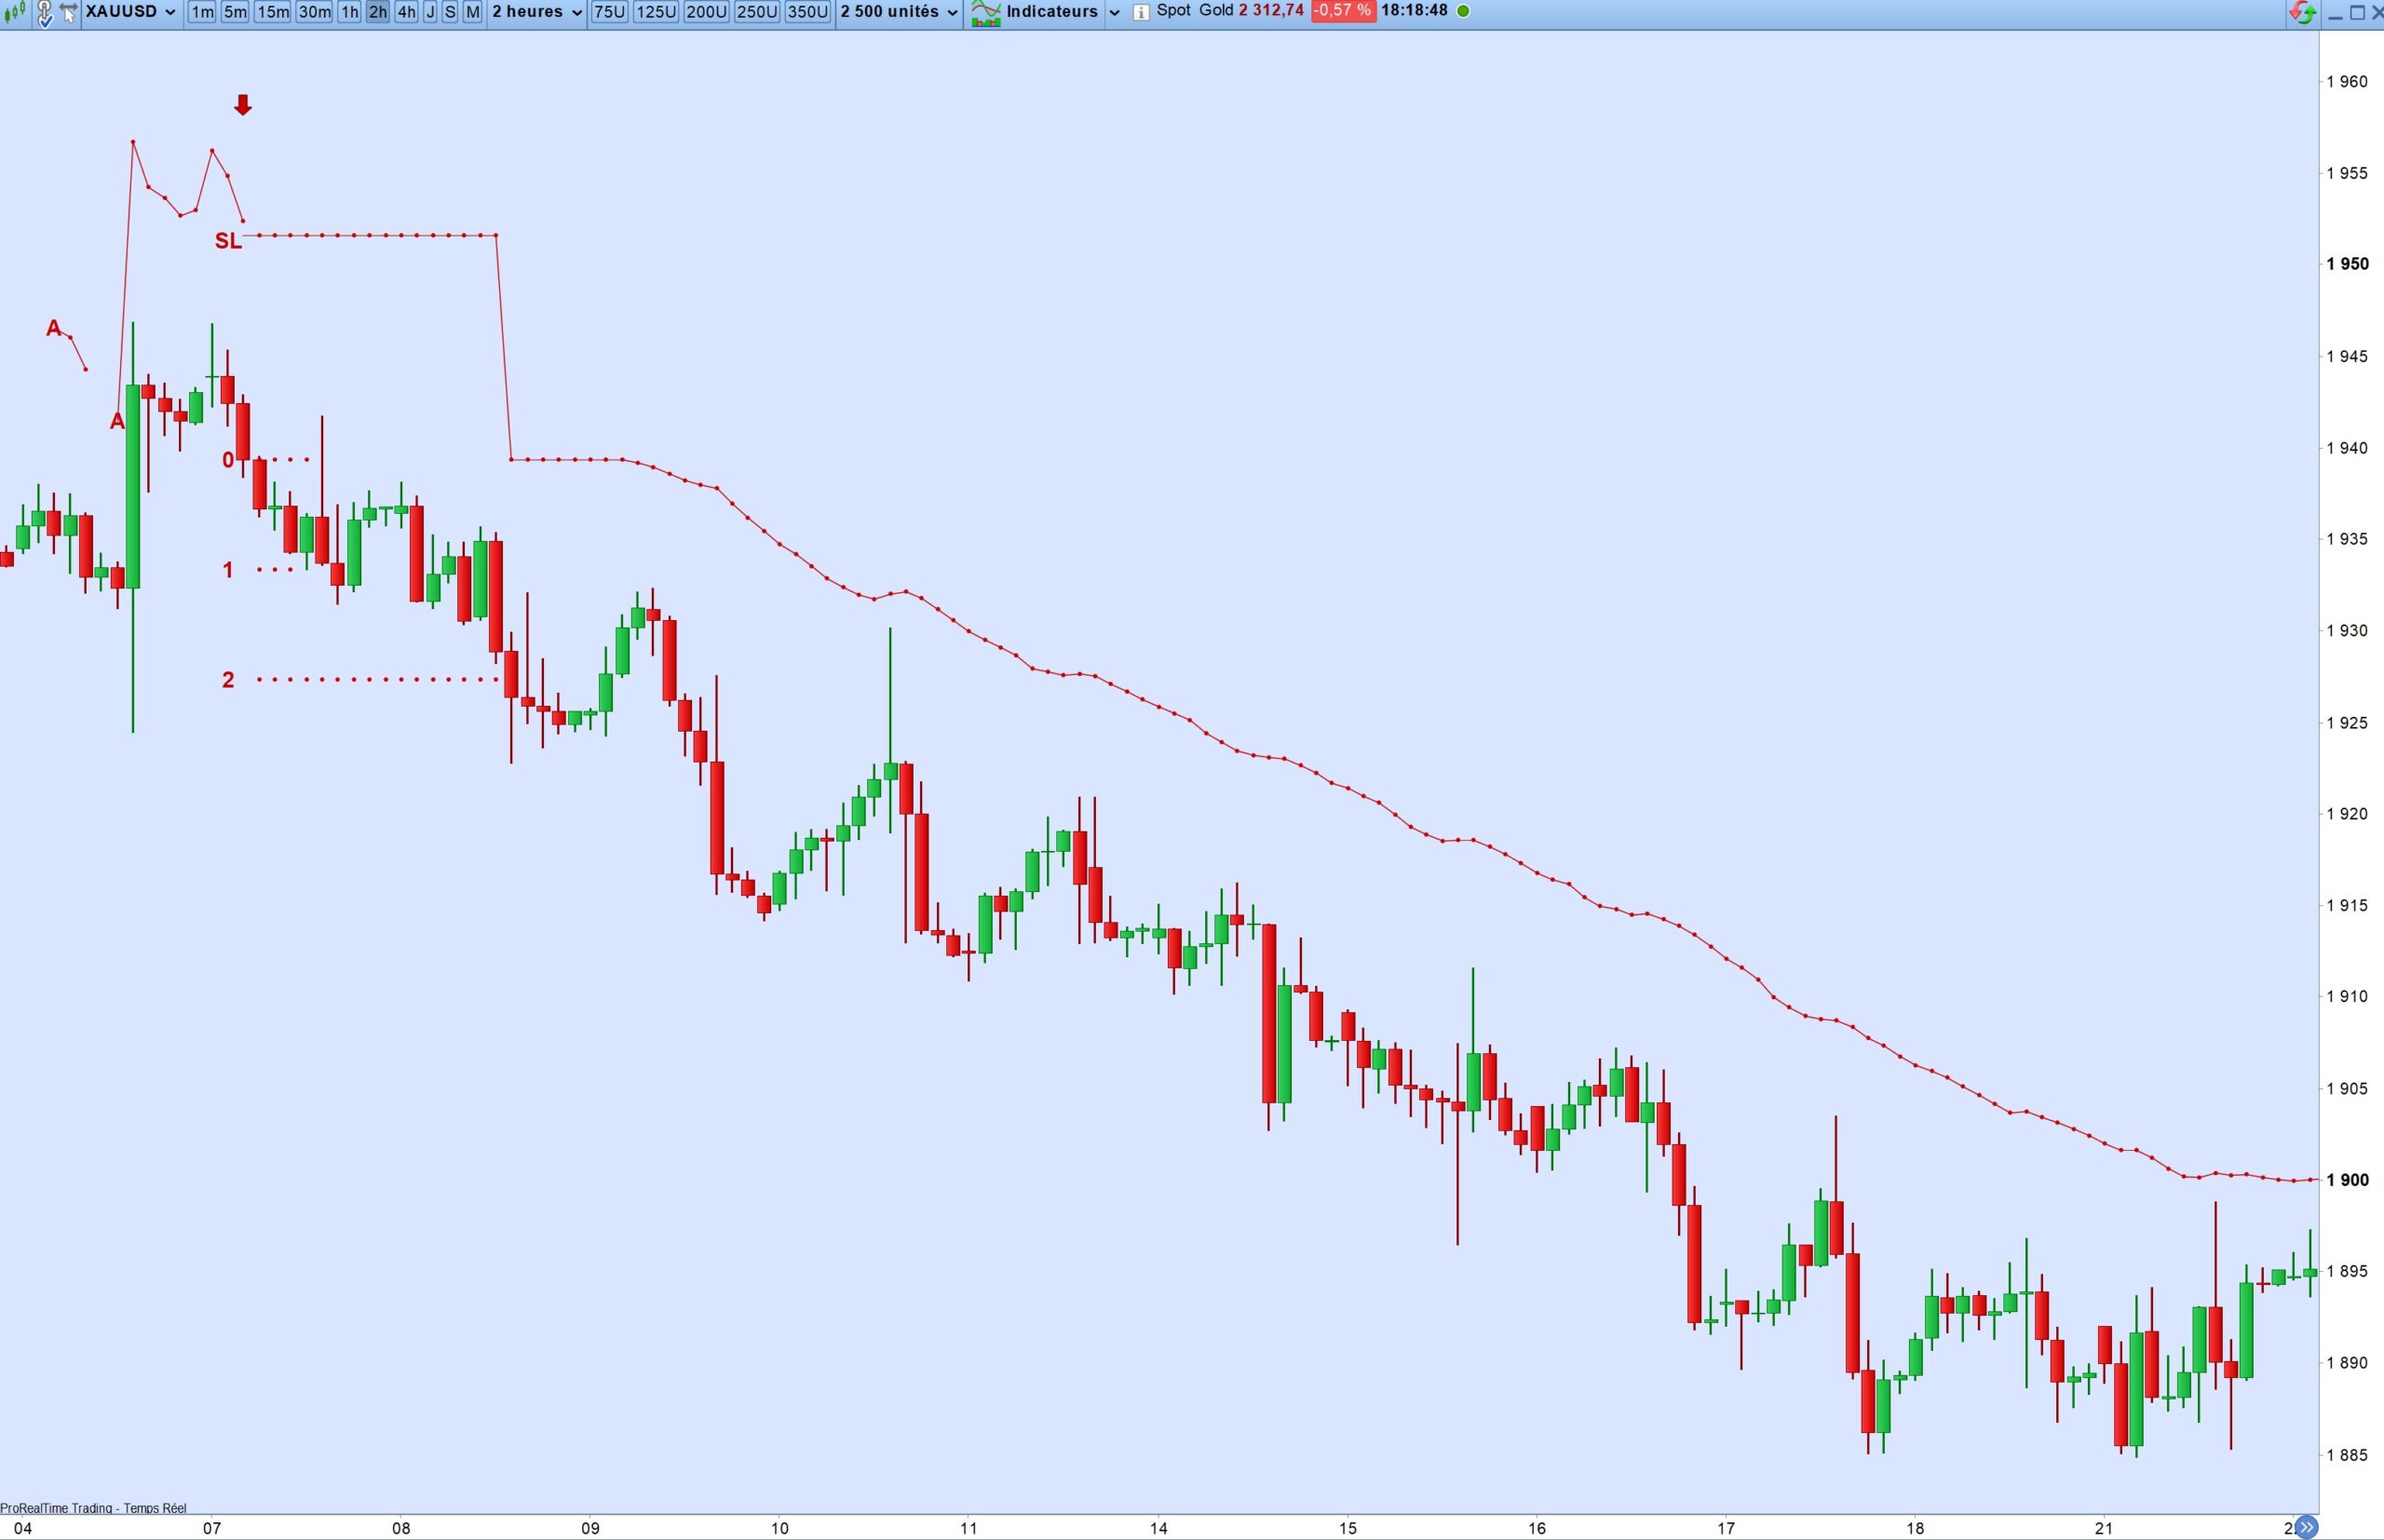
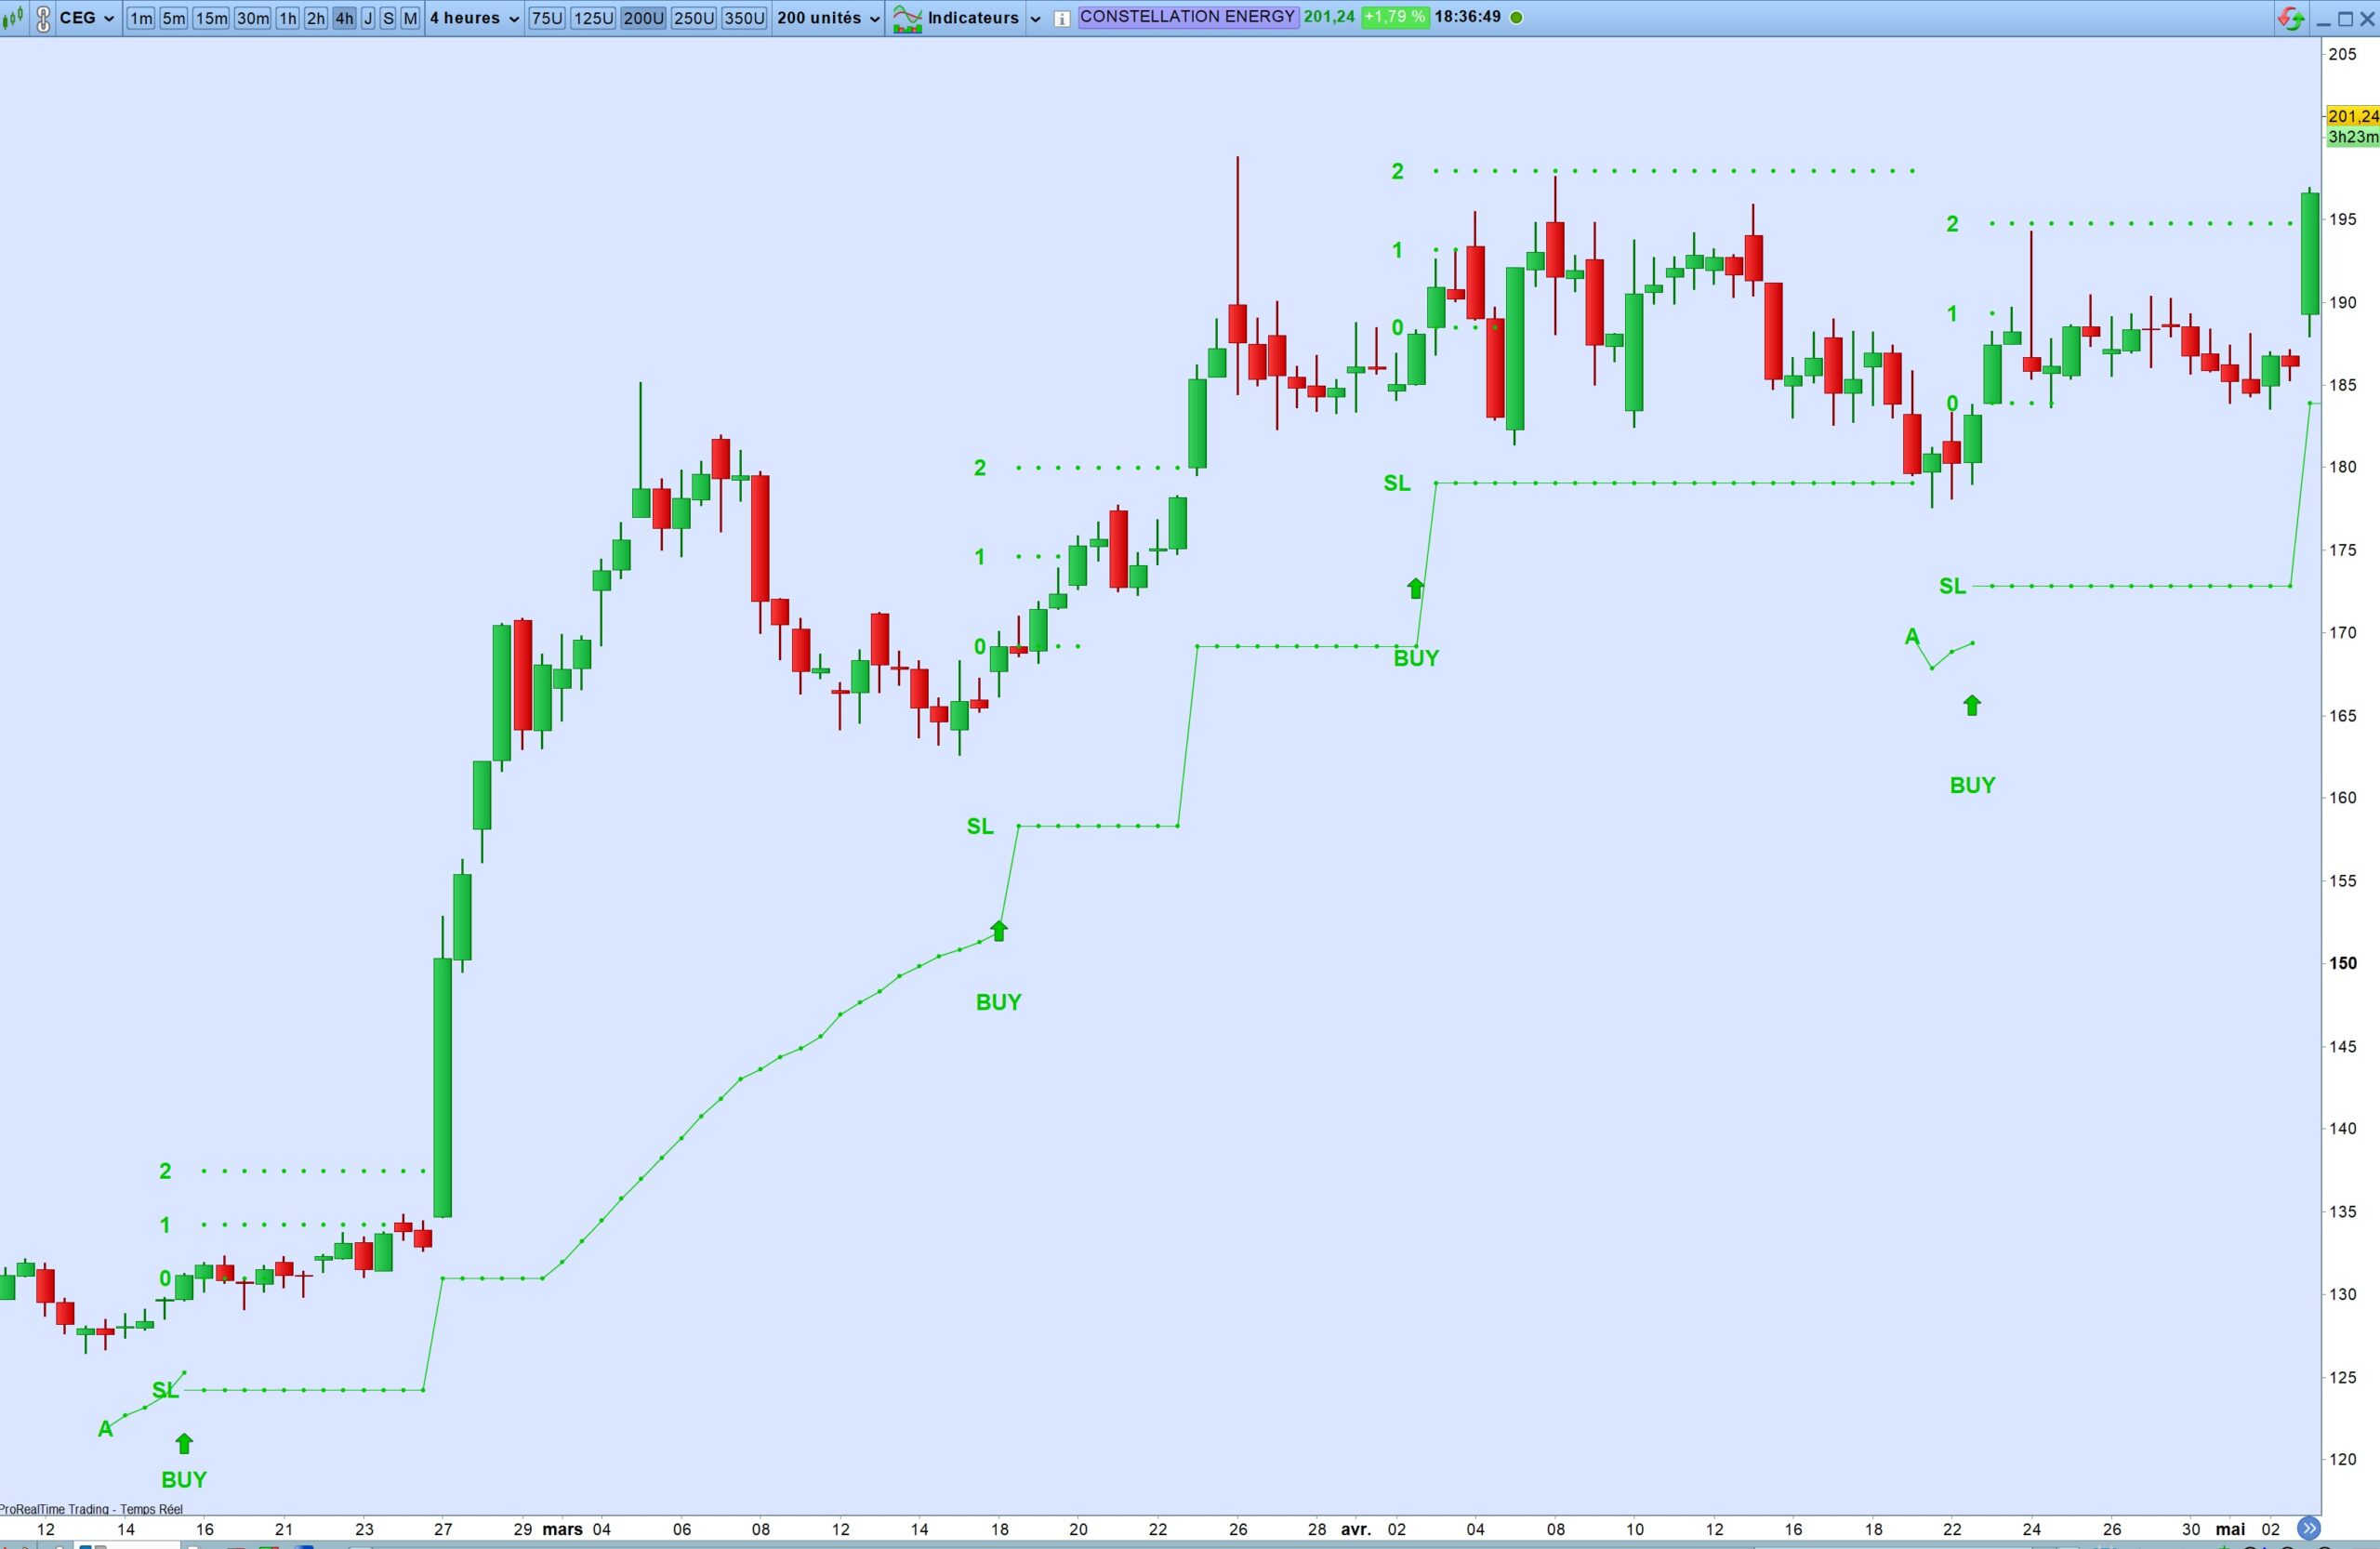
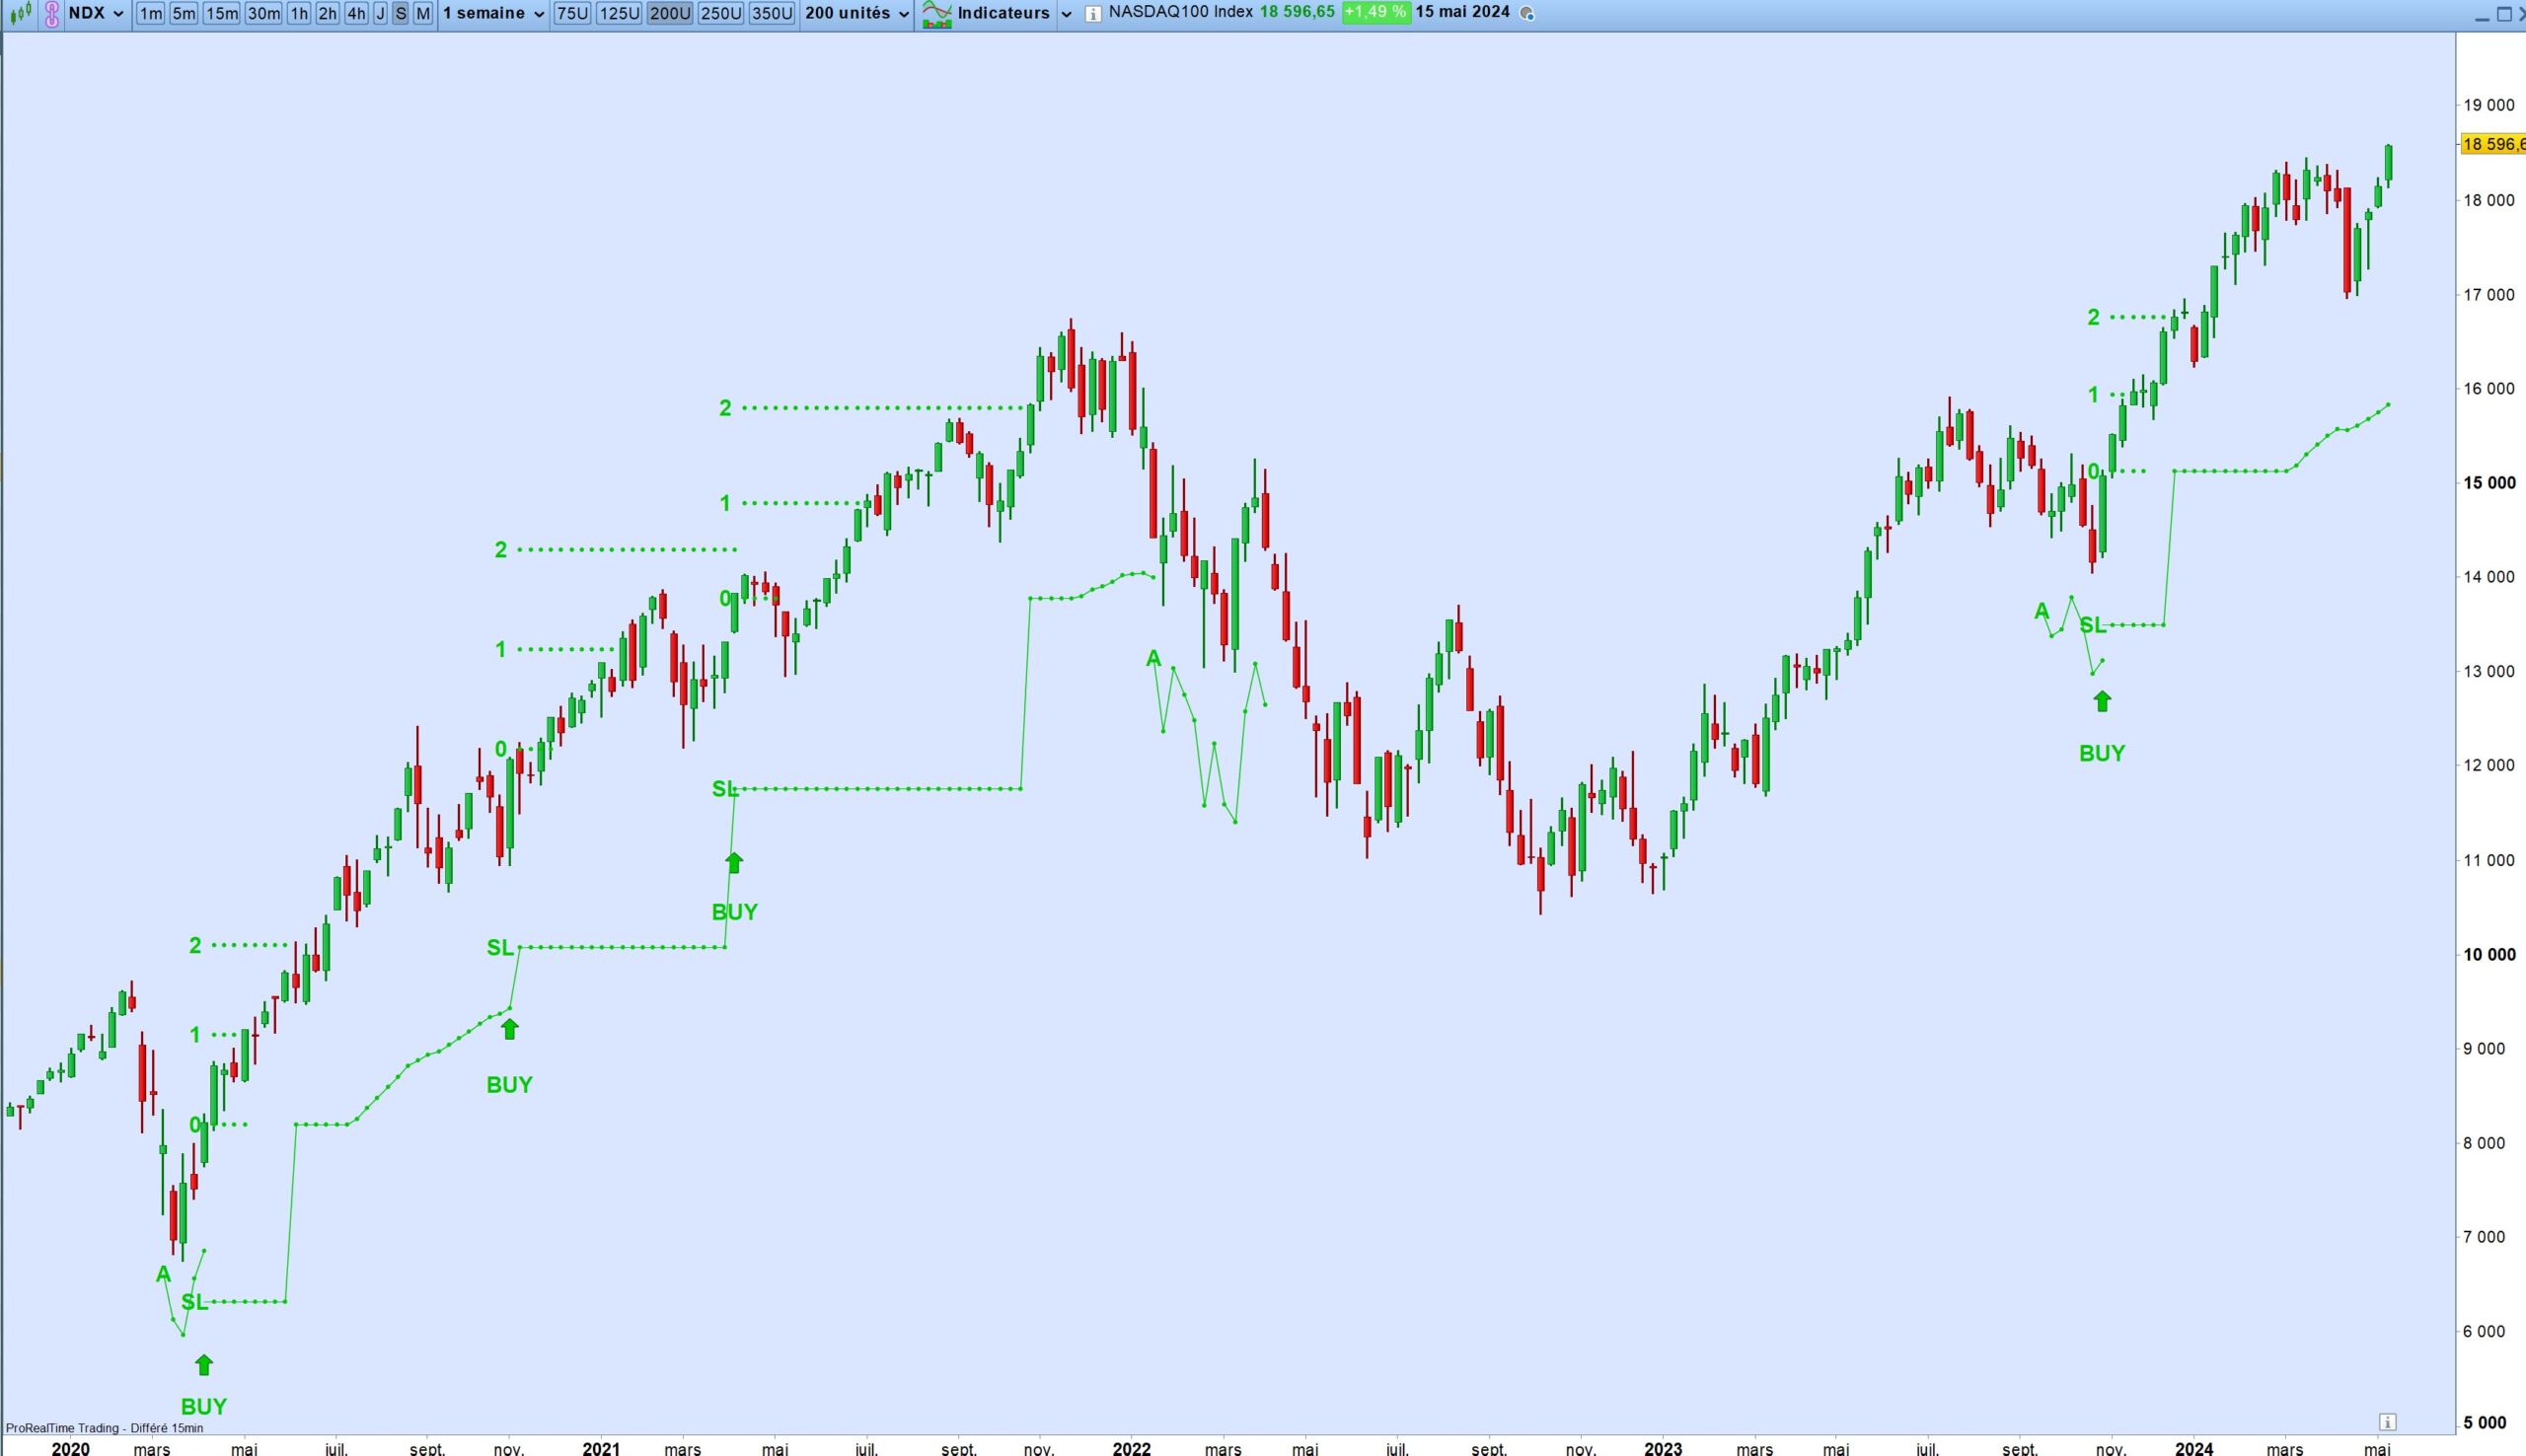
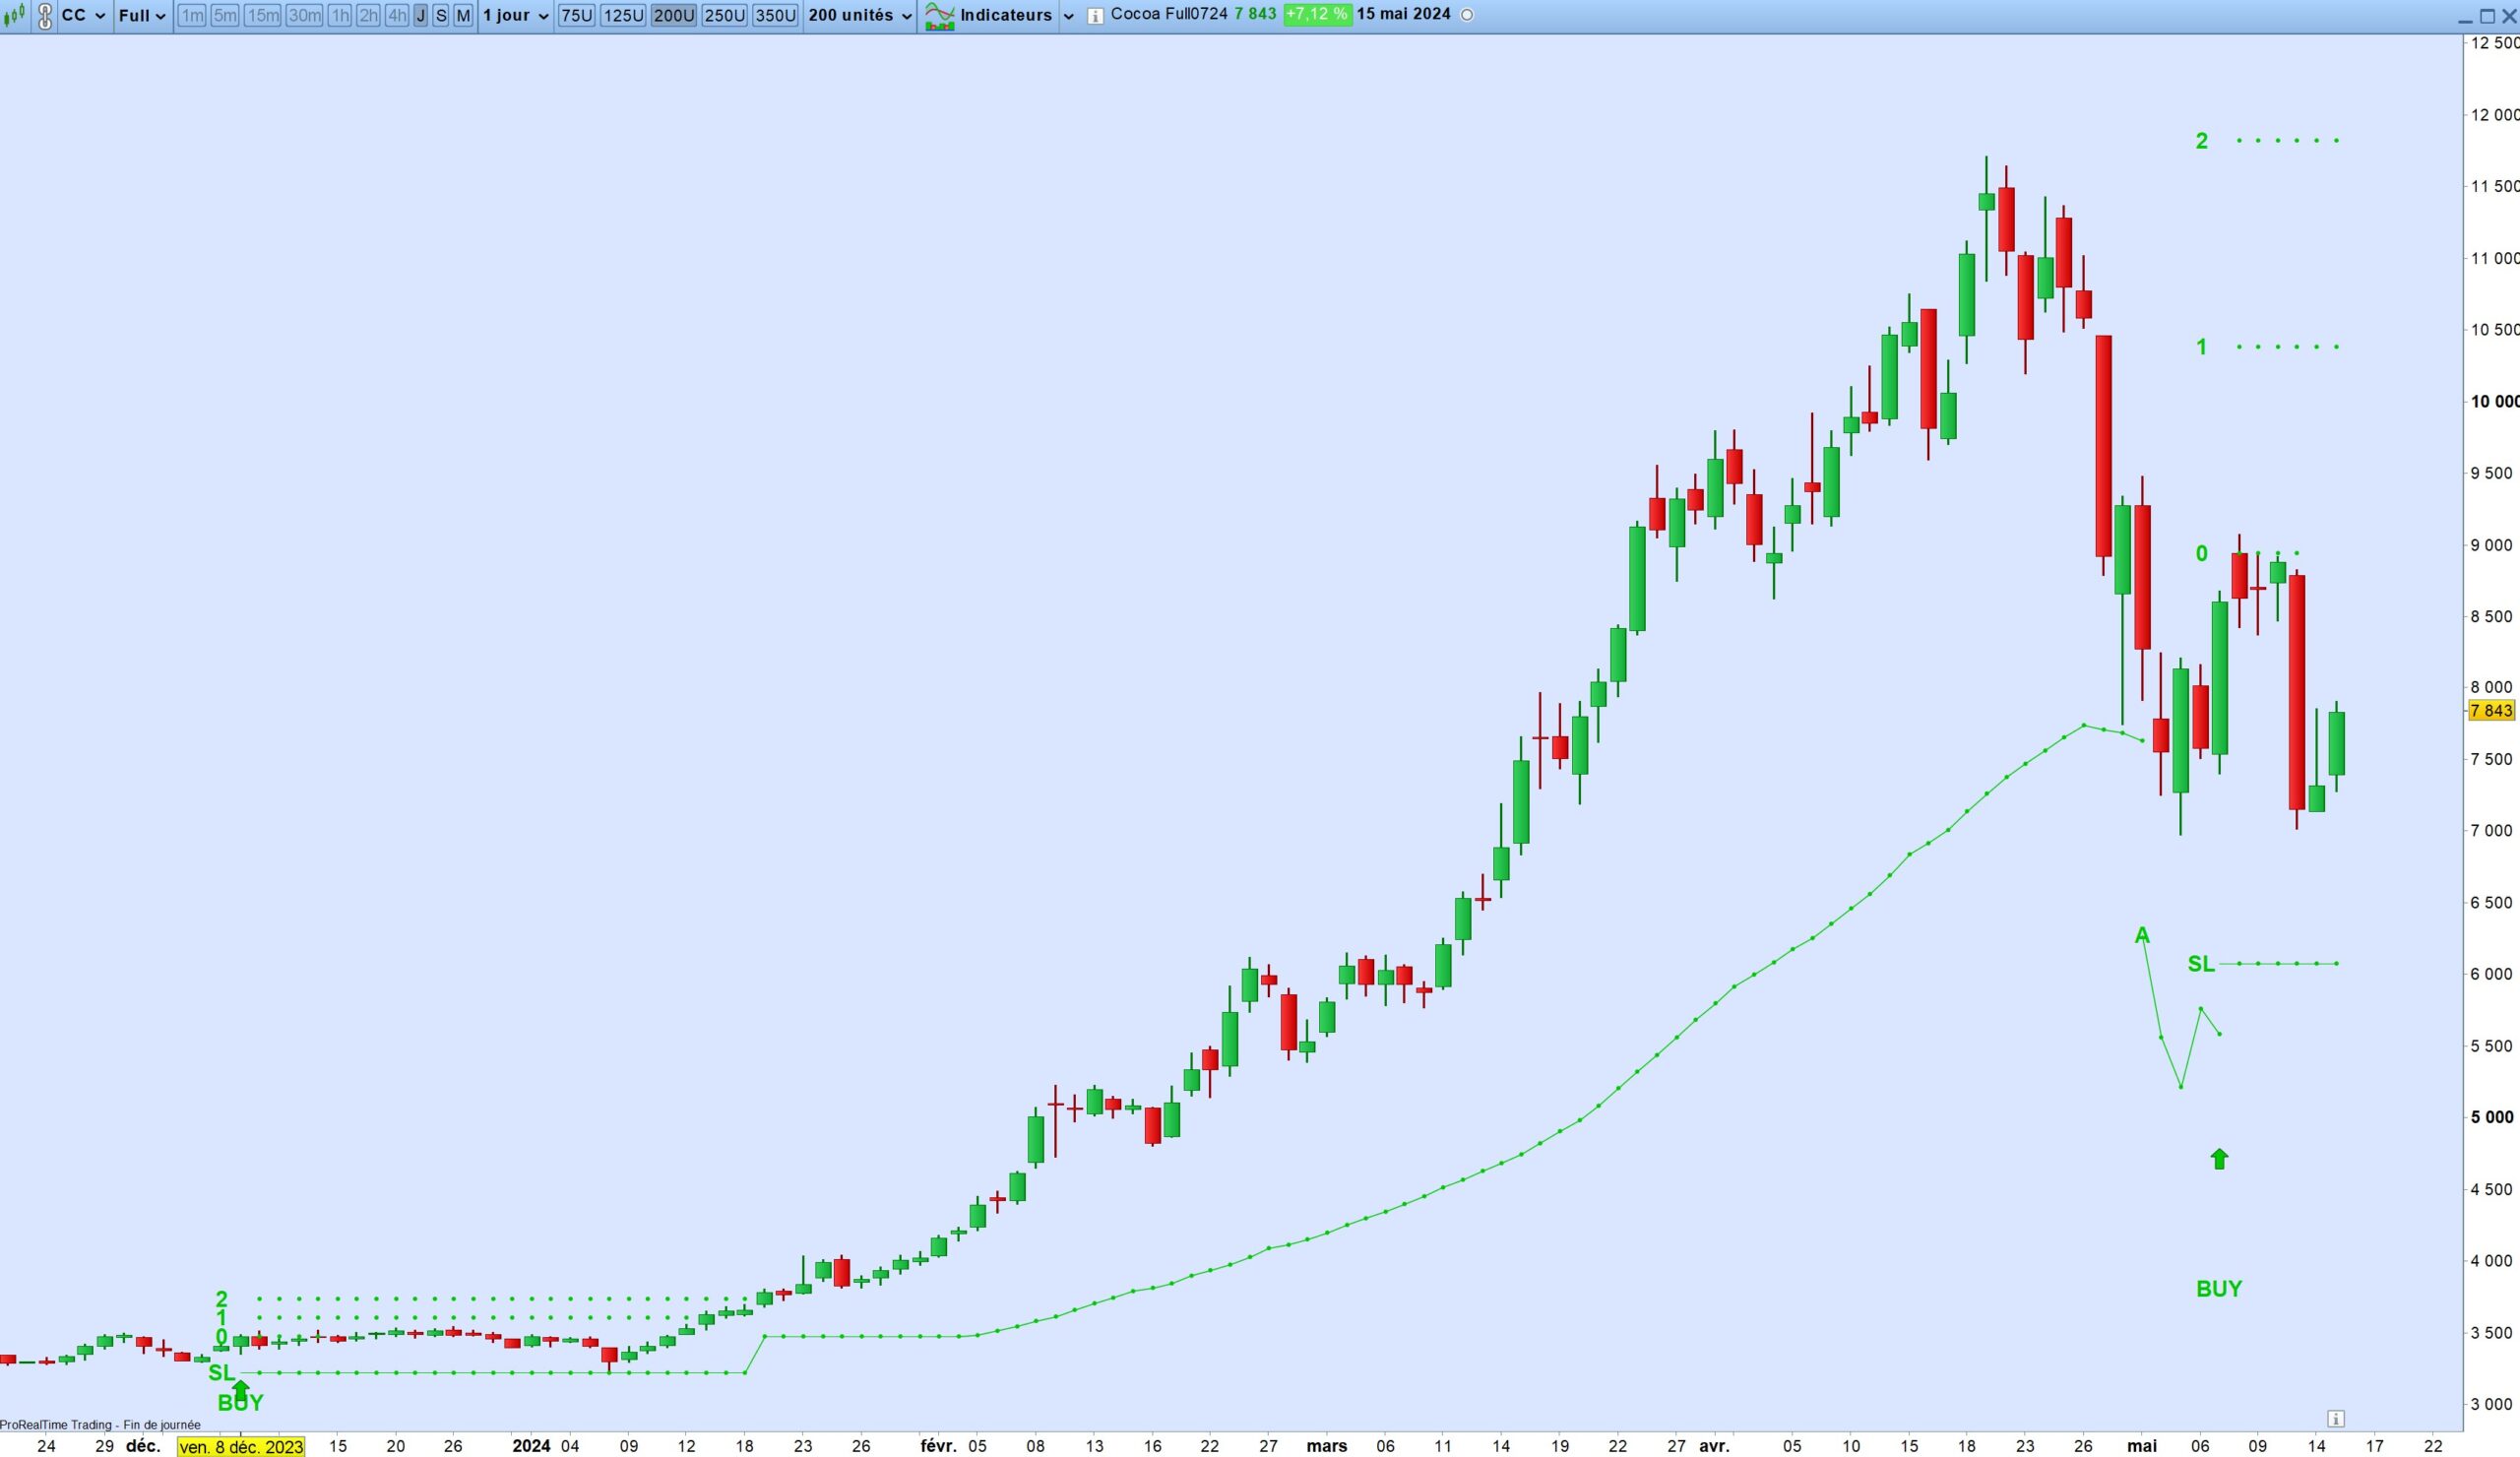
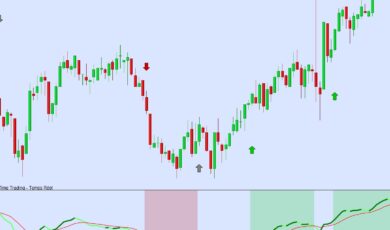
When a signal might appear, an alert line (A) shows on the chart. If the signal is confirmed, an arrow along with a BUY or SELL indication appears, highlighting the entry point (0), the first exit level for one-third of the position (1), the second exit level for another third (2), and the stop loss (SL). If the trade progresses favorably, this stop loss evolves into a trailing stop win for the remainder of the position.
It’s emphasized that with this stop, you are quickly exited in the case of a false signal, whereas a valid signal allows sufficient room for the movement to develop. It’s crucial to act on all signals to think in terms of sequences.
If you prefer not to display the entry, stop, and exit levels on your chart, simply set the SL variable to 0 instead of 1. Then, only the arrows and BUY or SELL indications will appear. You can also change the colors with the colorbuy and colorsell variables.
For optimal performance of the algorithm, ensure your chart has over 300 data points.
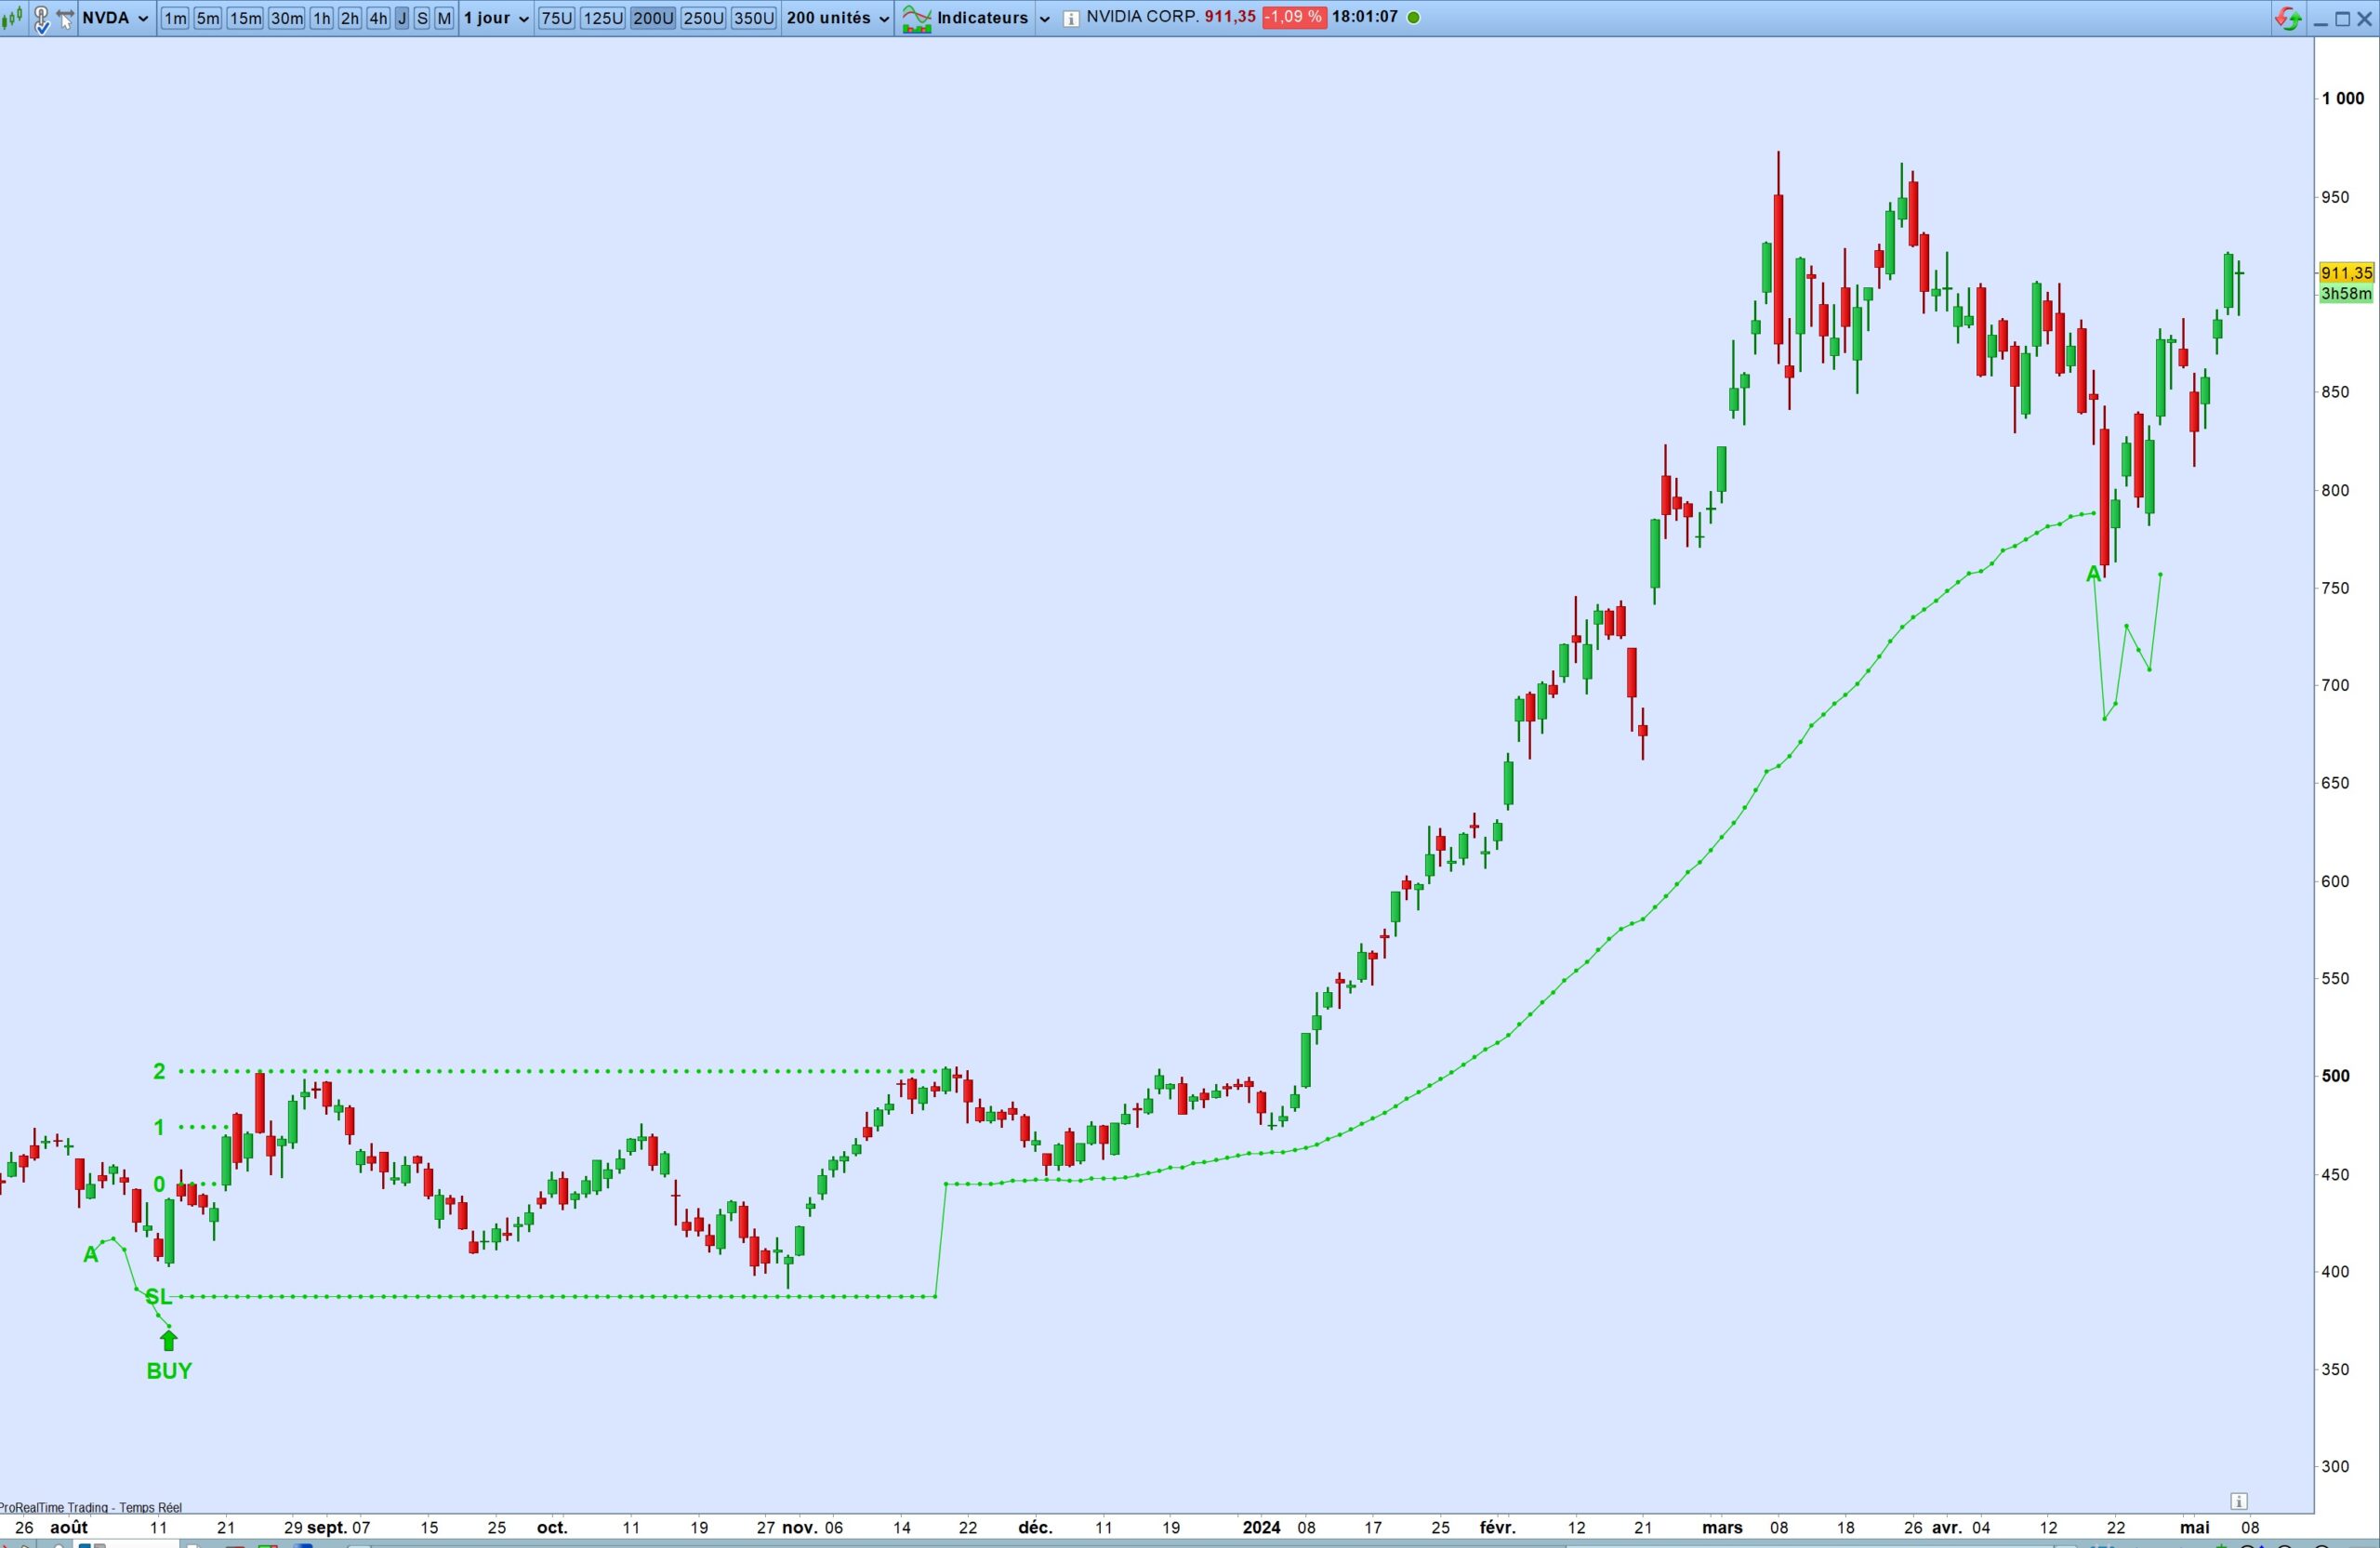
Example of use on the chart with Nvidia, on a daily time frame:
- On August 3, the alert line is activated (A).
- A signal is given at the close of August 14, 2023 (BUY).
- The entry occurs at the opening on August 15 at 445.48 (0).
- The stop is set at 387.4 (SL).
- The exit for the first third of the position (1) occurs on August 22 at 473.8.
- The exit for the second third of the position (2) occurs on November 20 at 503.4.
- The stop loss (SL) then adjusts to zero on November 20 and becomes a trailing stop win.
- The exit for the third third of the position occurs either at the same level as the second tier or with the stop win, here on April 19, 2024, at 788.6.



Valoraciones
No hay valoraciones aún.