Stochastic Power Trend Screener
The “Stochastic Power Trend Screener” is a fabulous tool that provides precise entry points for trading when the market is trending, specifically during pauses between successive waves. it also exists as an Indicator in the products library.
The algorithm is based on stochastics across multiple time frames, and it activates in five typical configurations, only when the environment is particularly favorable to maximize the success rate.
It also exists as an indicator in the product library, and allows for the display of arrows on graphs, as well as entry, exit, and stop loss levels. The screener searches for signals from the indicator among the last 3 candles, including the current one, and gives a result of 1 or2 or 3 or -1 or -2 or -3. 1 means that there is a positive signal on the current candle. -3 means that there is a negative signal the third last candle.
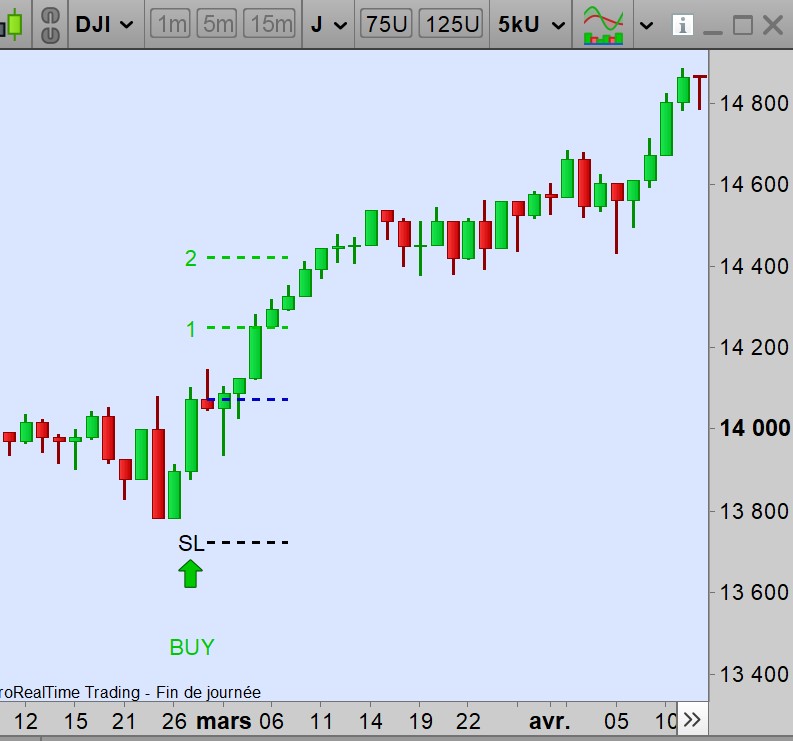
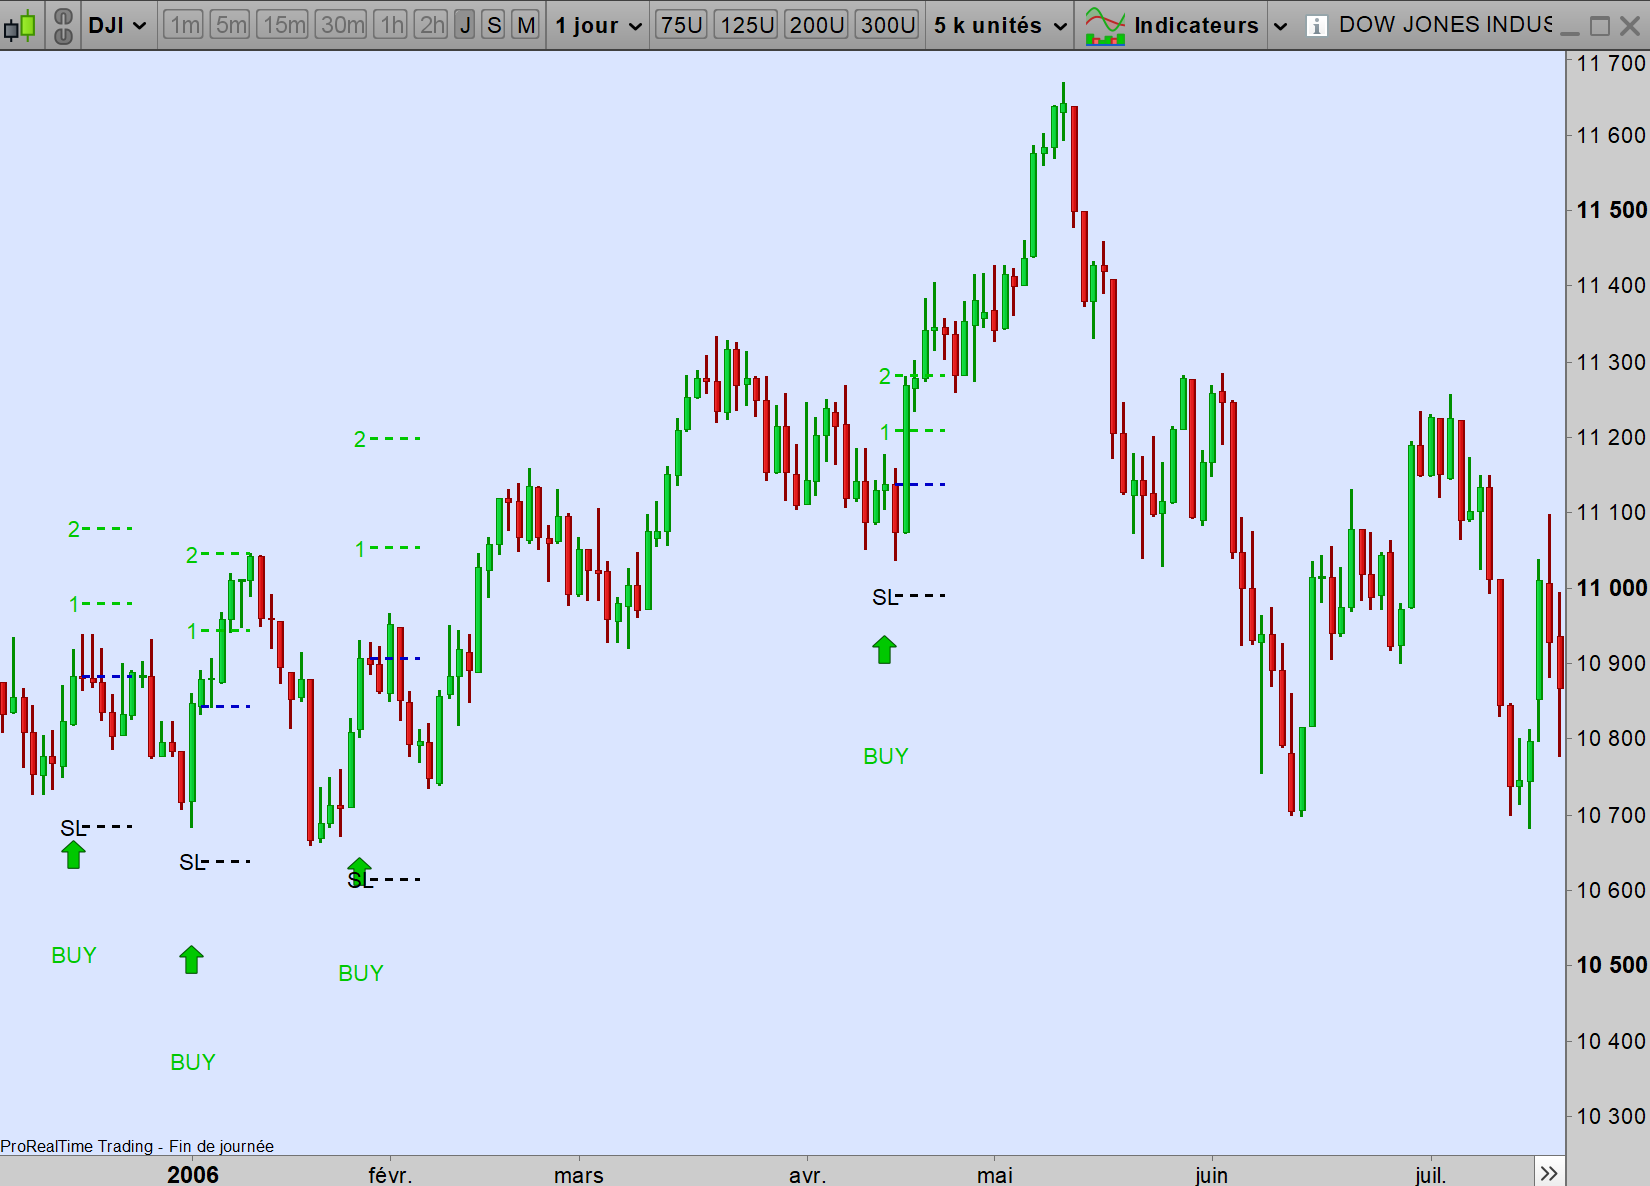
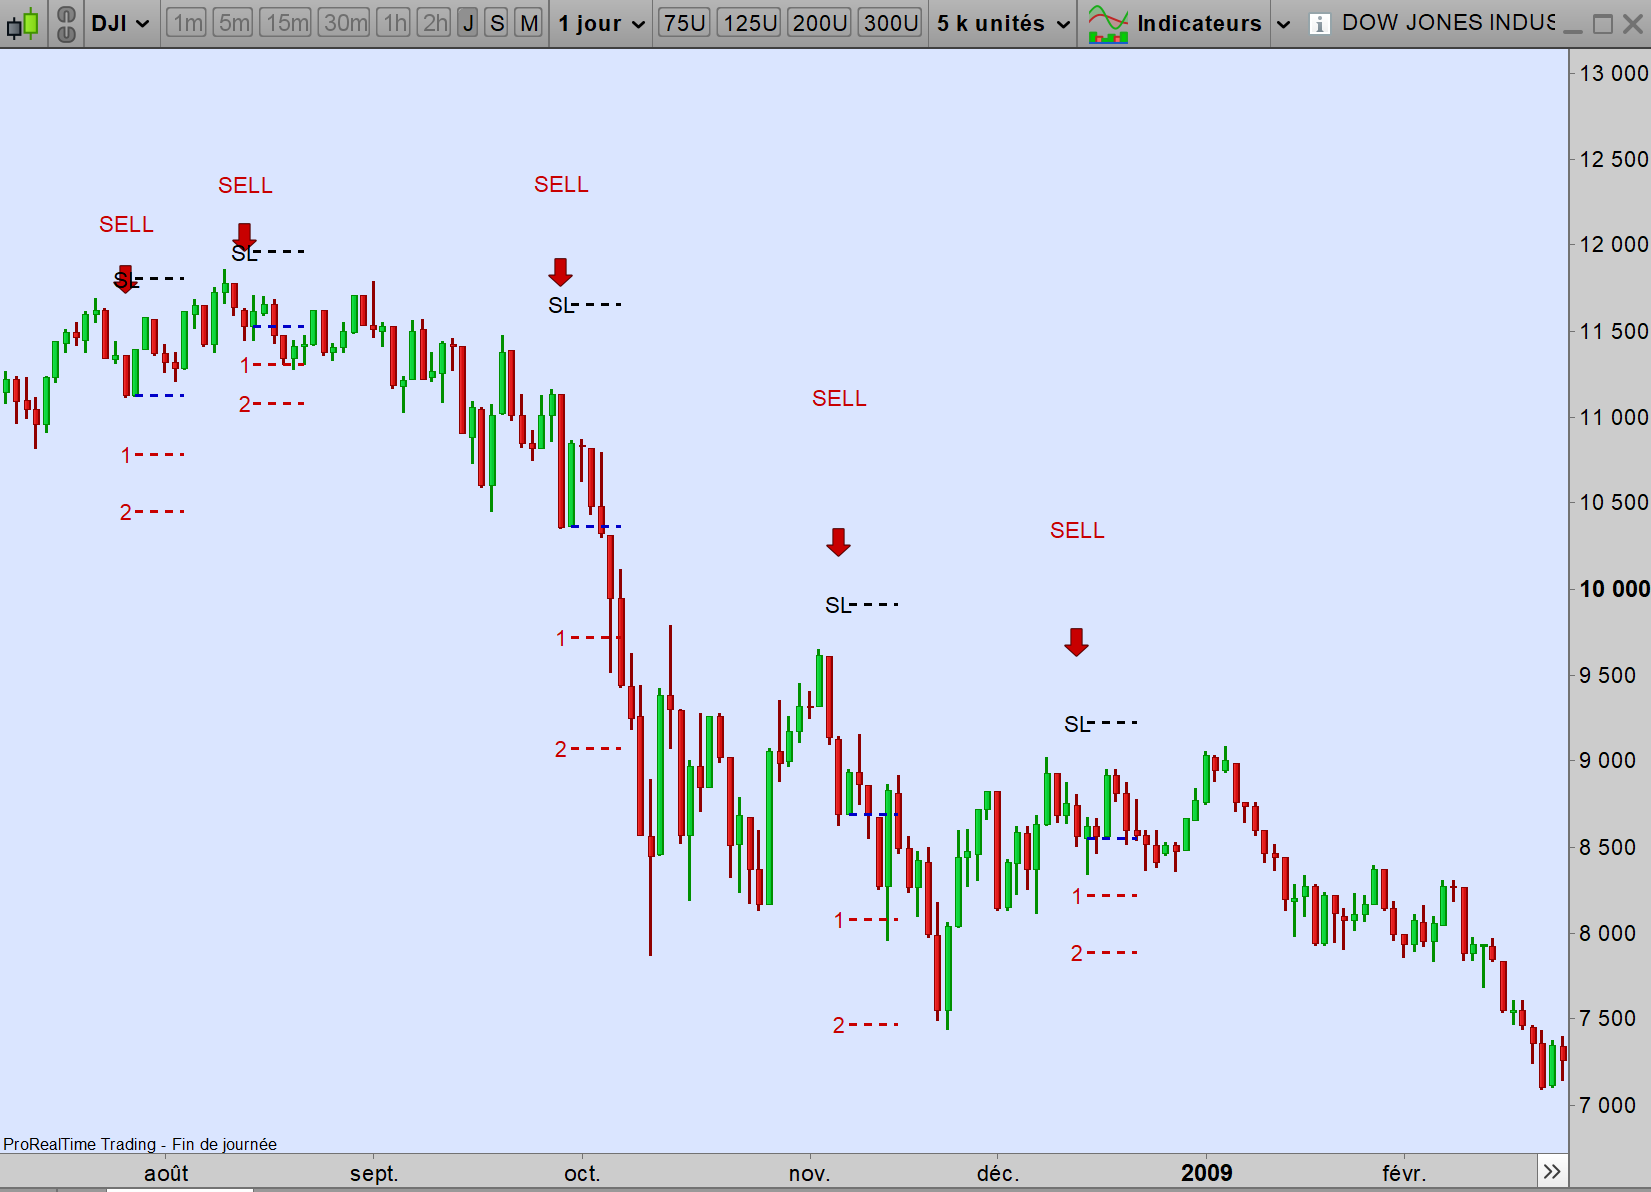
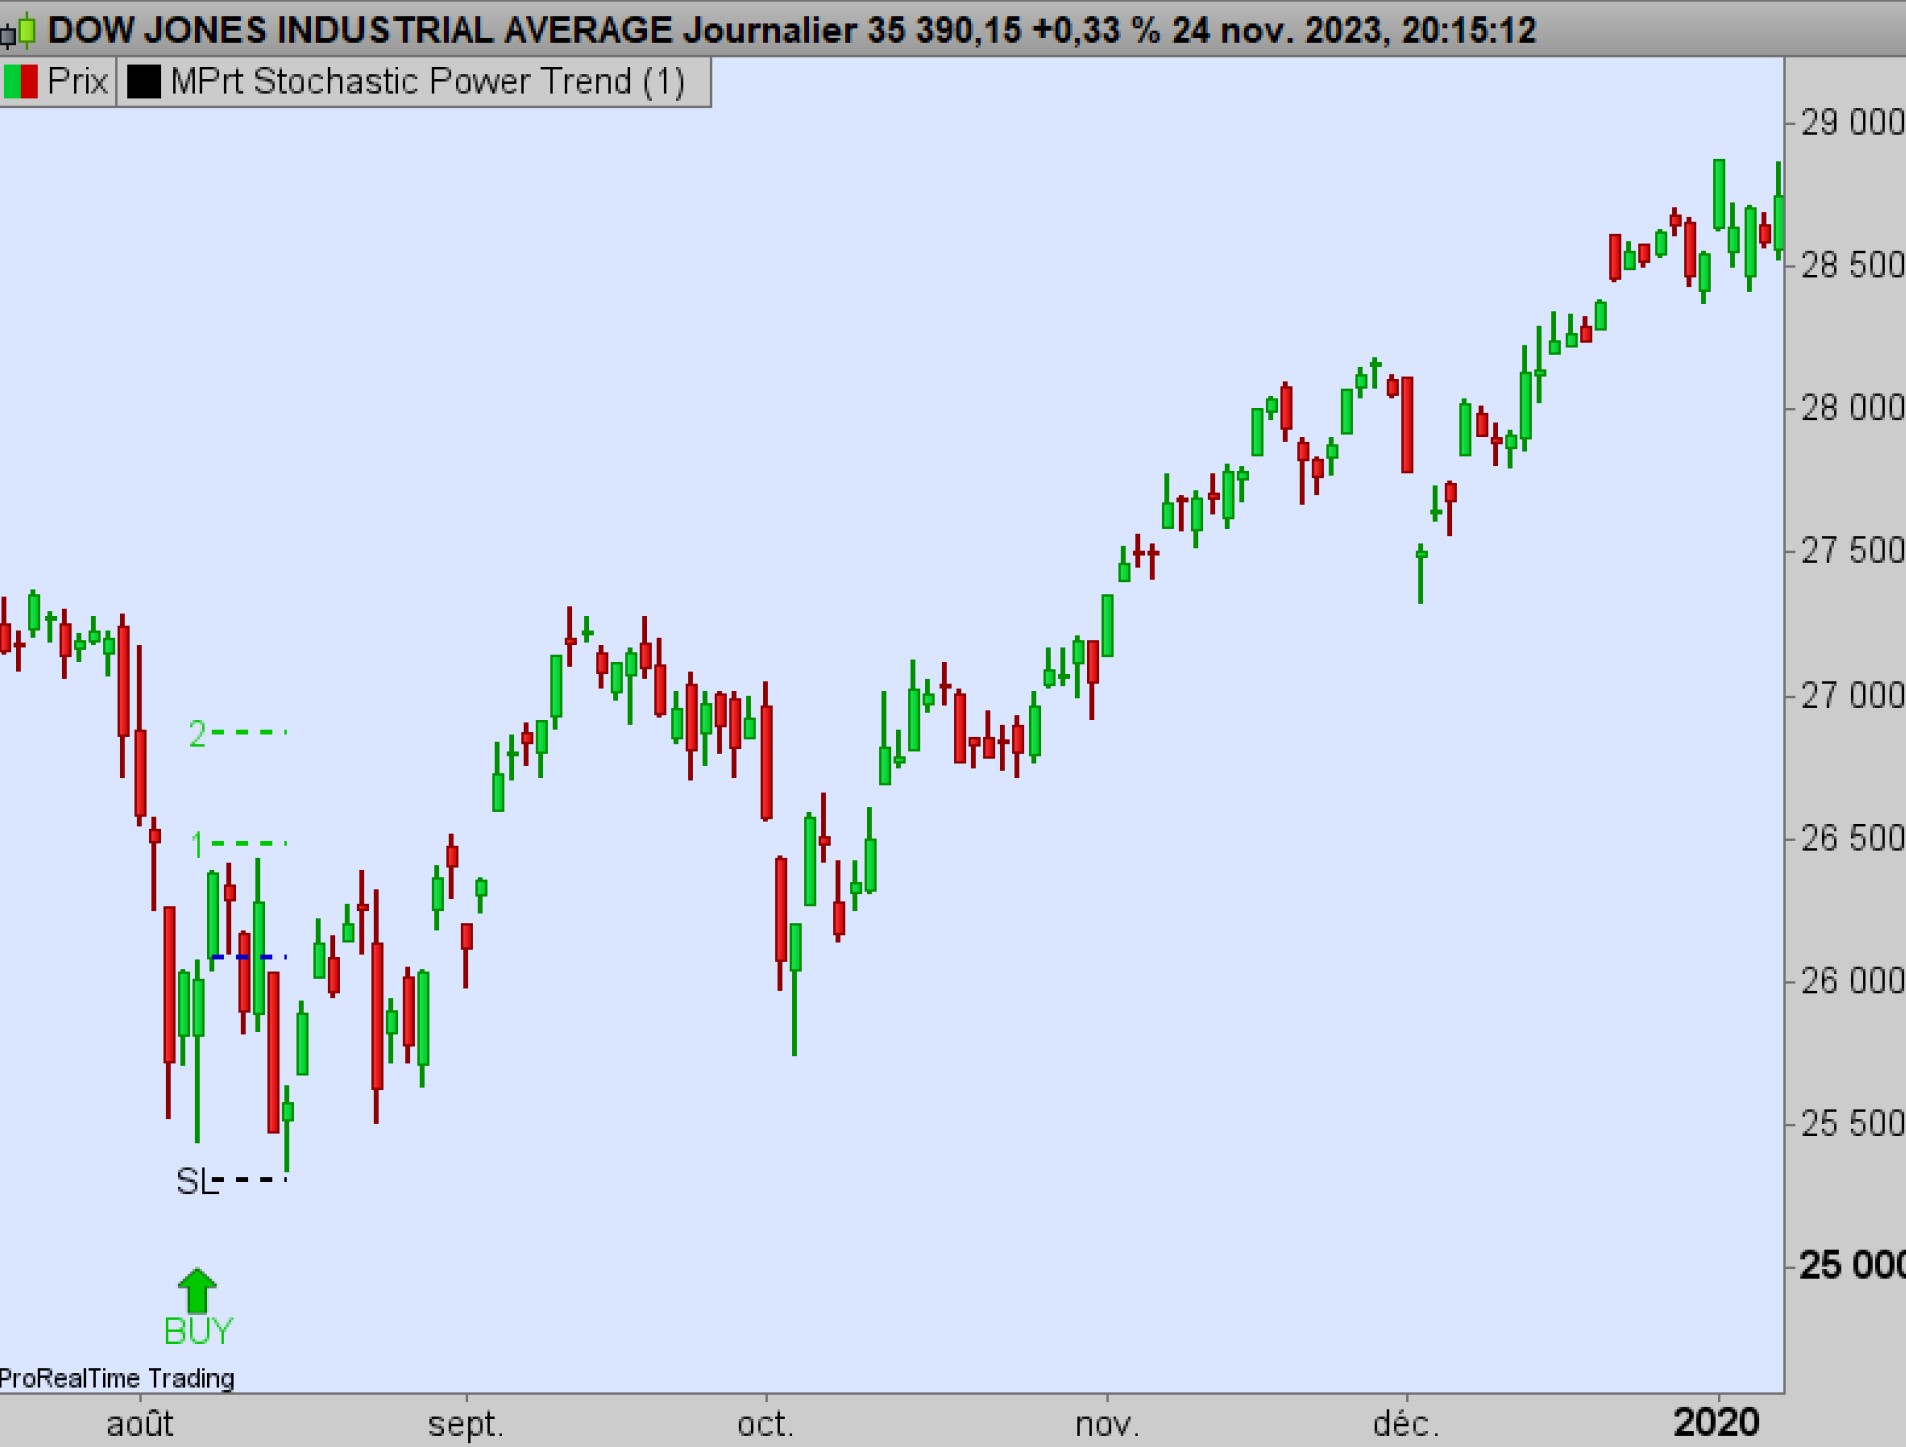
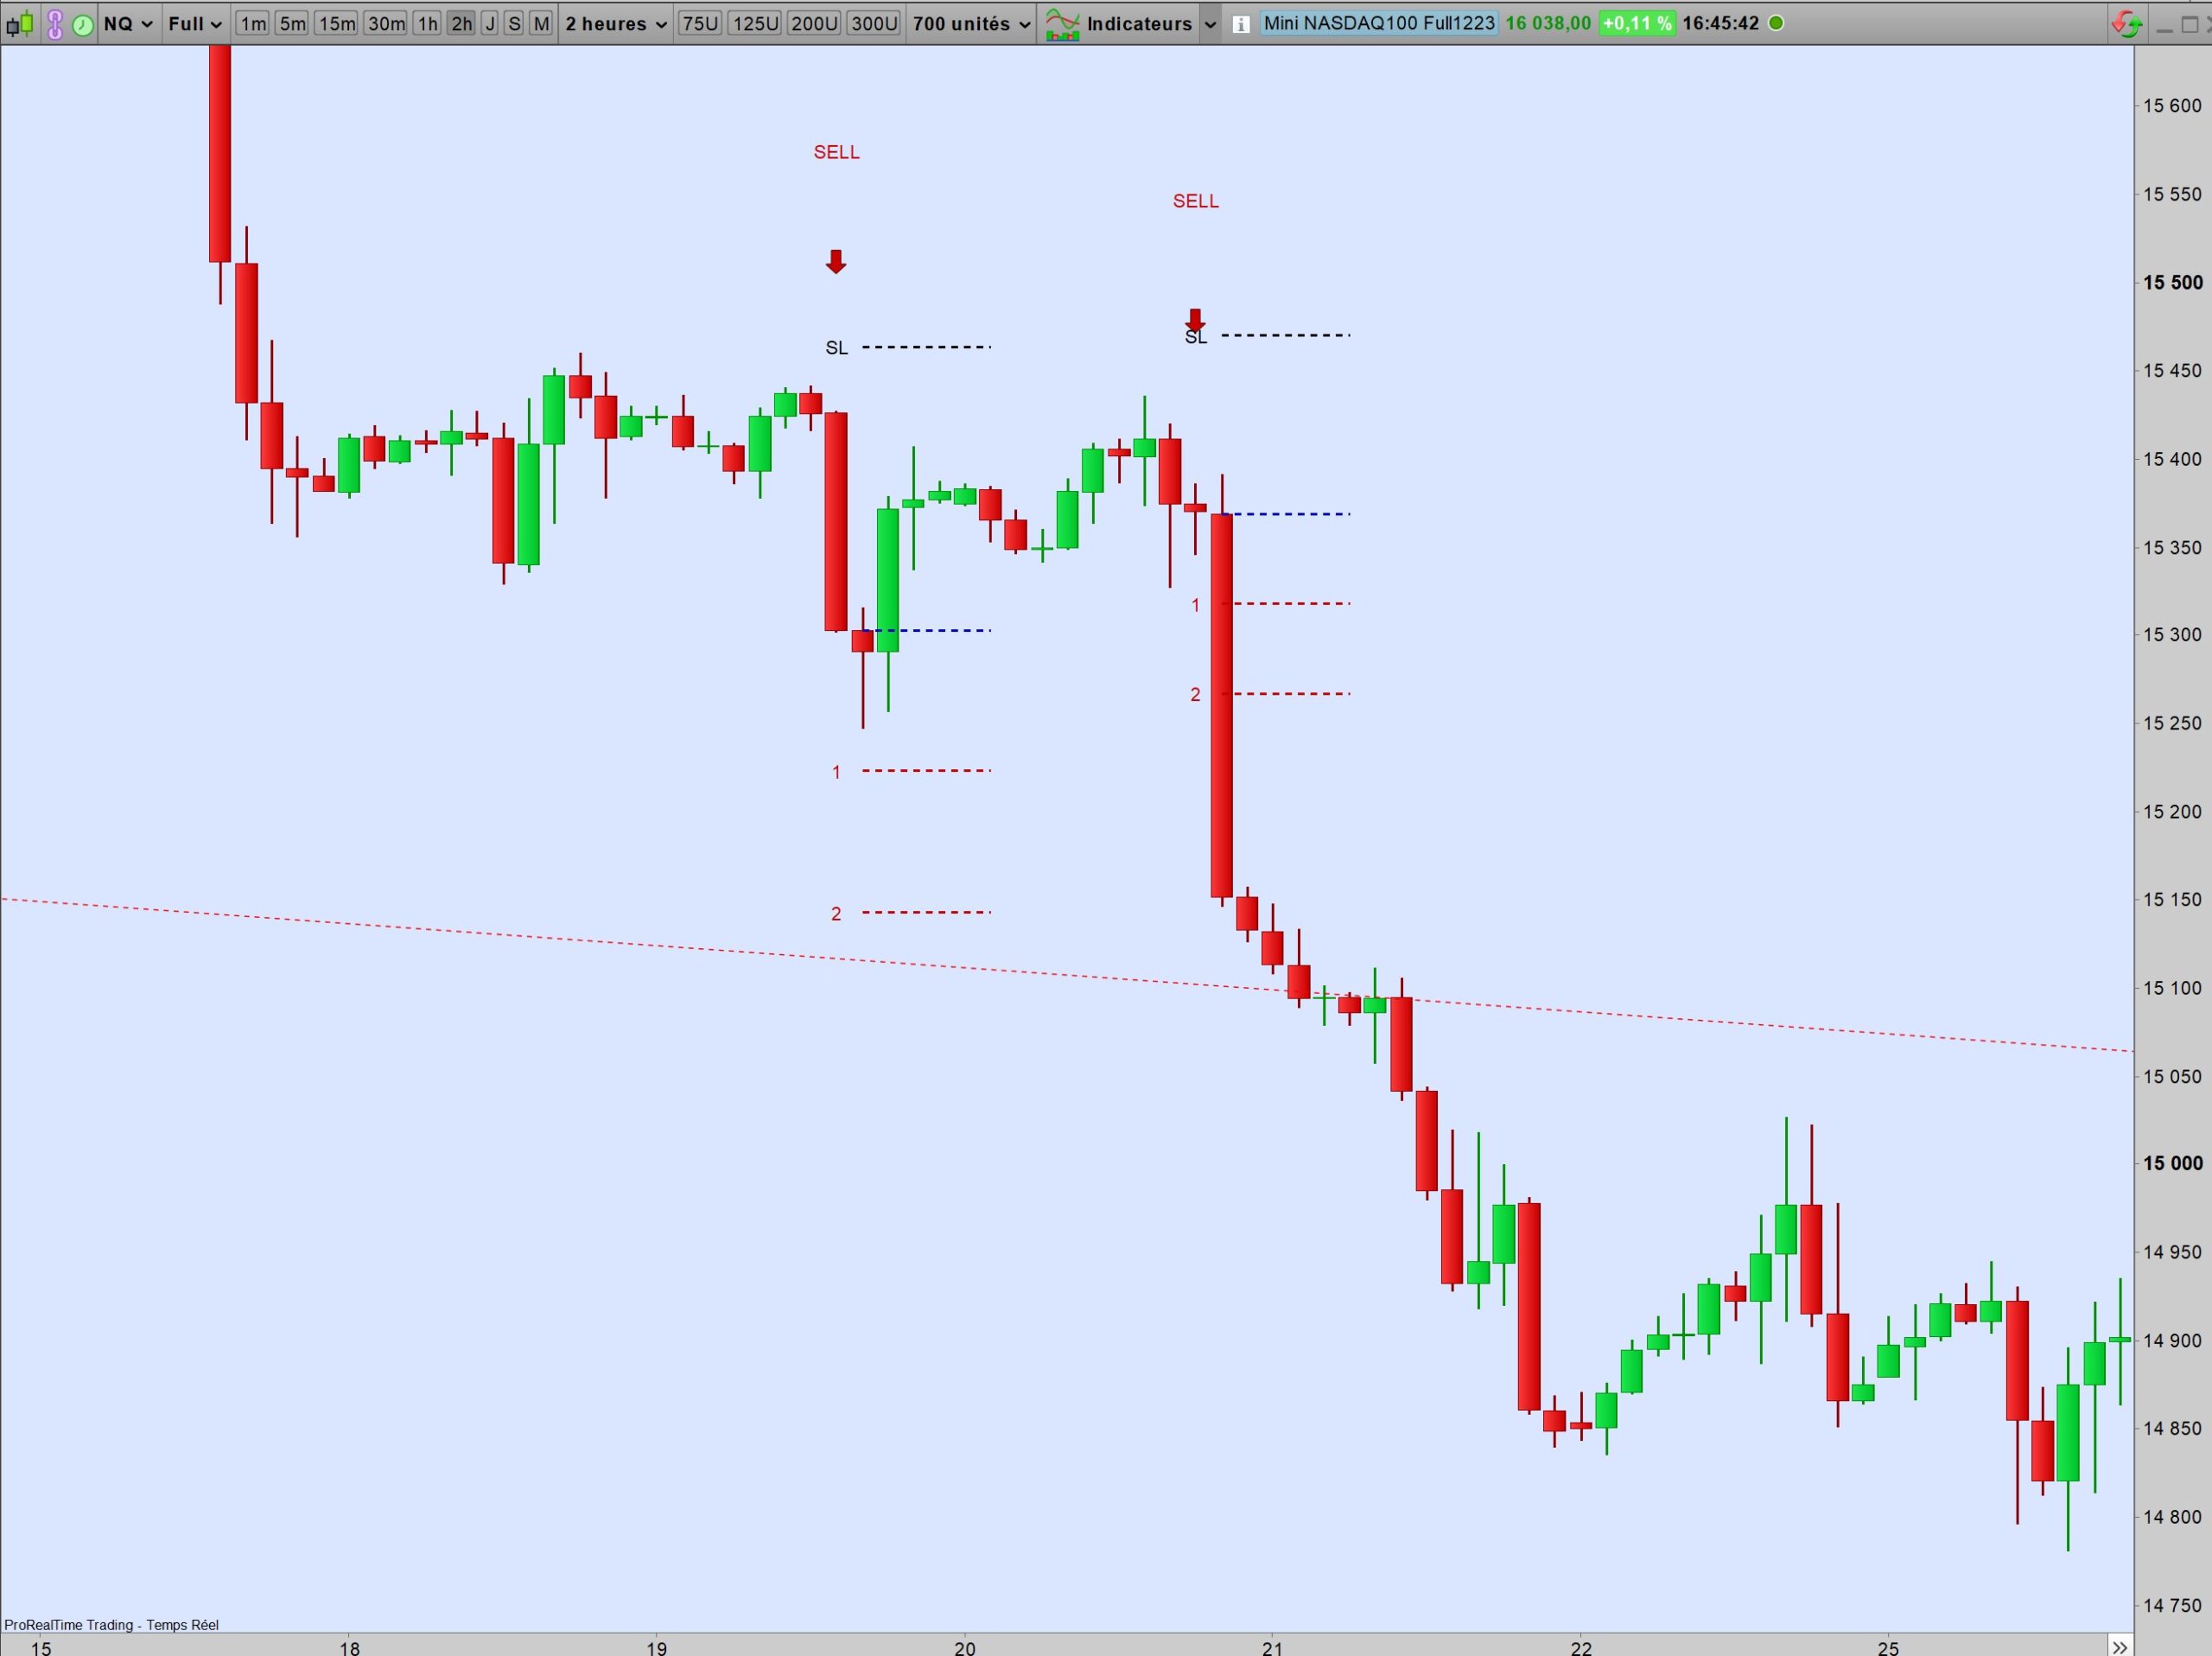
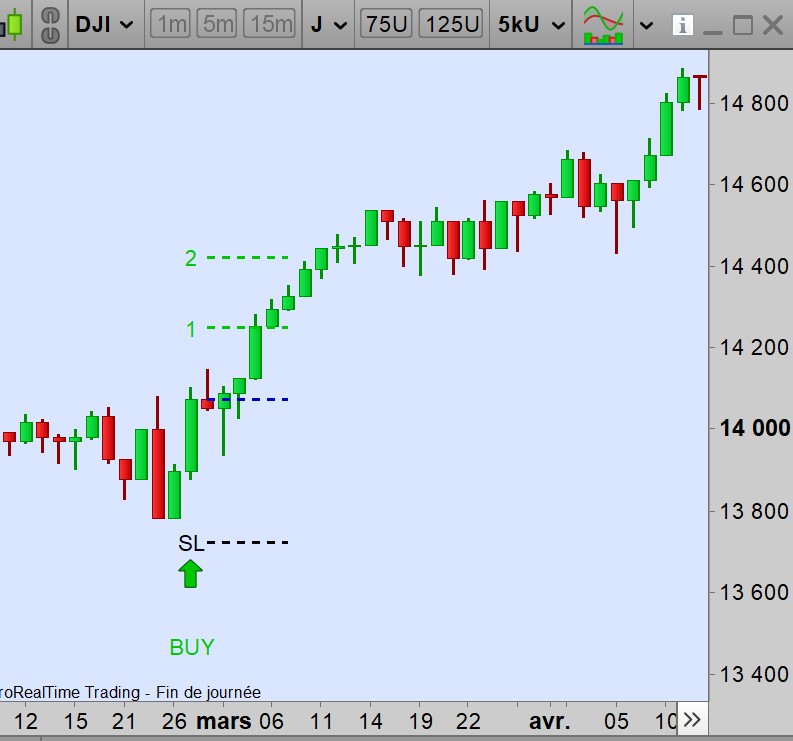
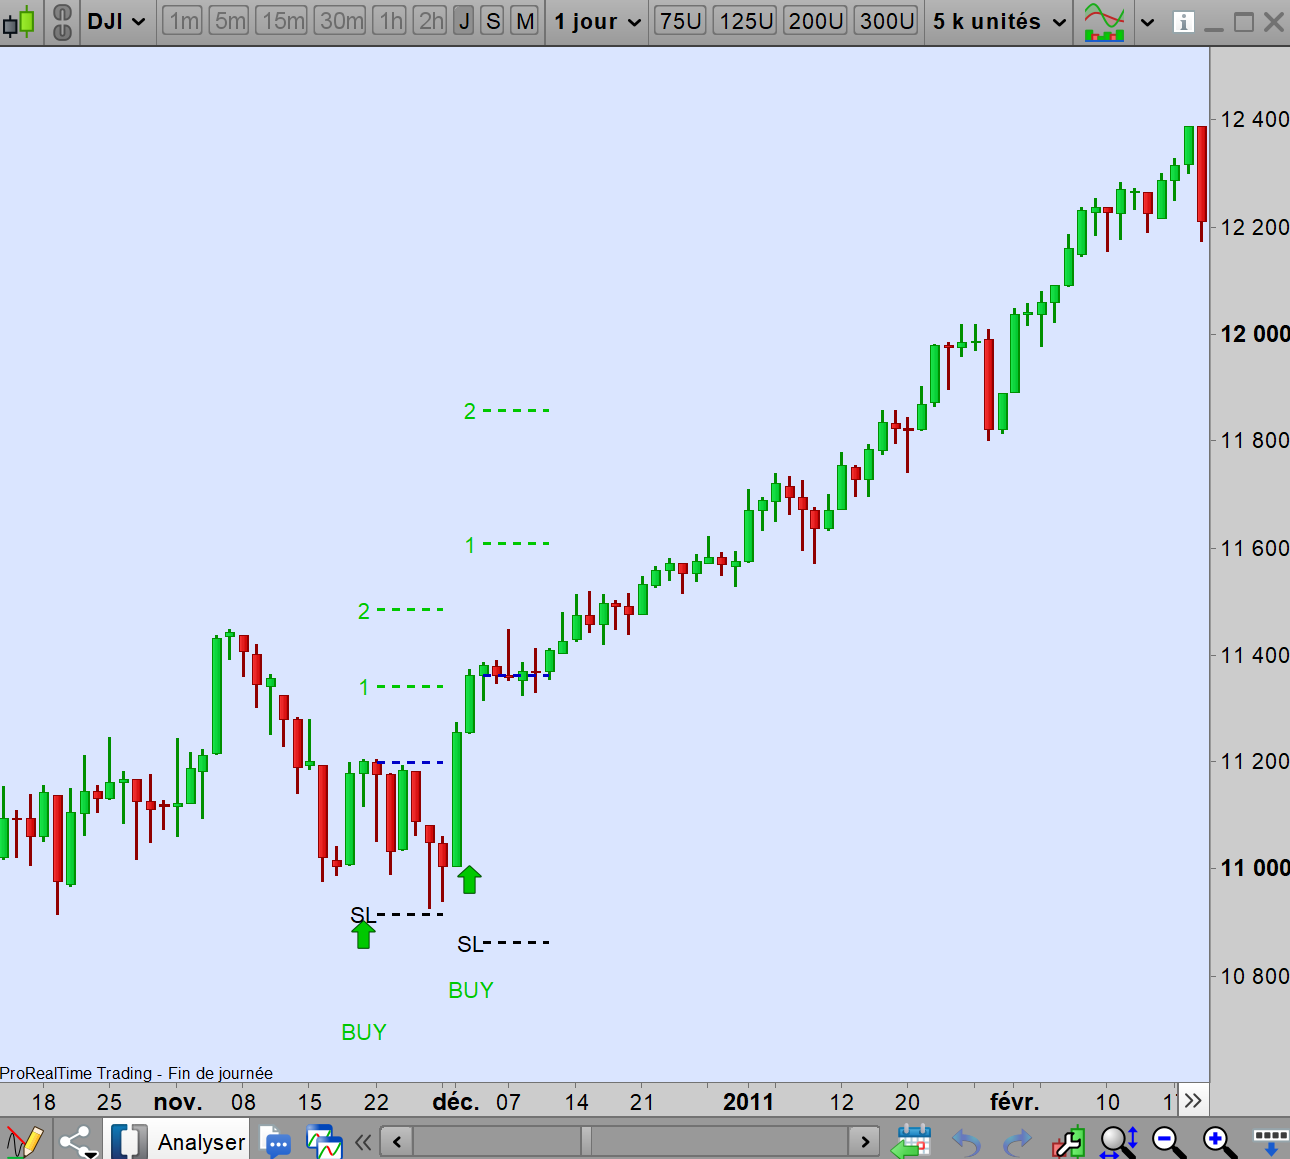
When the signal is given by an arrow, an entry level is indicated on the opening of the next candle (blue dashed line), and a suggested stop loss (SL) level is presented (black dashed line). It’s recommended to divide the position into three or four parts. The first two exits are indicated by the numbers 1 and 2 (green dashed line for a long position, red dashed for a short). Additional exits are at your discretion. It’s advised to move the stop to break-even when the market is halfway between points 1 and 2, and then adjust it progressively under the recent lows for buys, or recent highs for sells.
The stop level is determined automatically, which isn’t perfect compared to a discretionary stop, but it helps maintain discipline for those not yet familiar with the Stochastic Power Trend Indicator. If you prefer not to have the entry, stop, and exit levels displayed on your chart, you can simply set the SL variable to 0 instead of 1.
However, it’s emphasized that with this stop, you’re quickly stopped out in case of a false signal, while a good signal allows ample room for the movement to develop. It’s important to consider all signals as part of a series. For example, in the provided Dow Jones sell signals, the first signal is false and stopped out quickly, but the next four are successful. Similarly for one of the examples with BUY signals, the first signal is stopped very quickly, the next three are winners
Lastly, for optimal functioning of the algorithm, your chart should have more than 300 units.


Bewertungen
Es gibt noch keine Bewertungen.