

Do you want to detect high-probability turning points in any asset and any time frame?
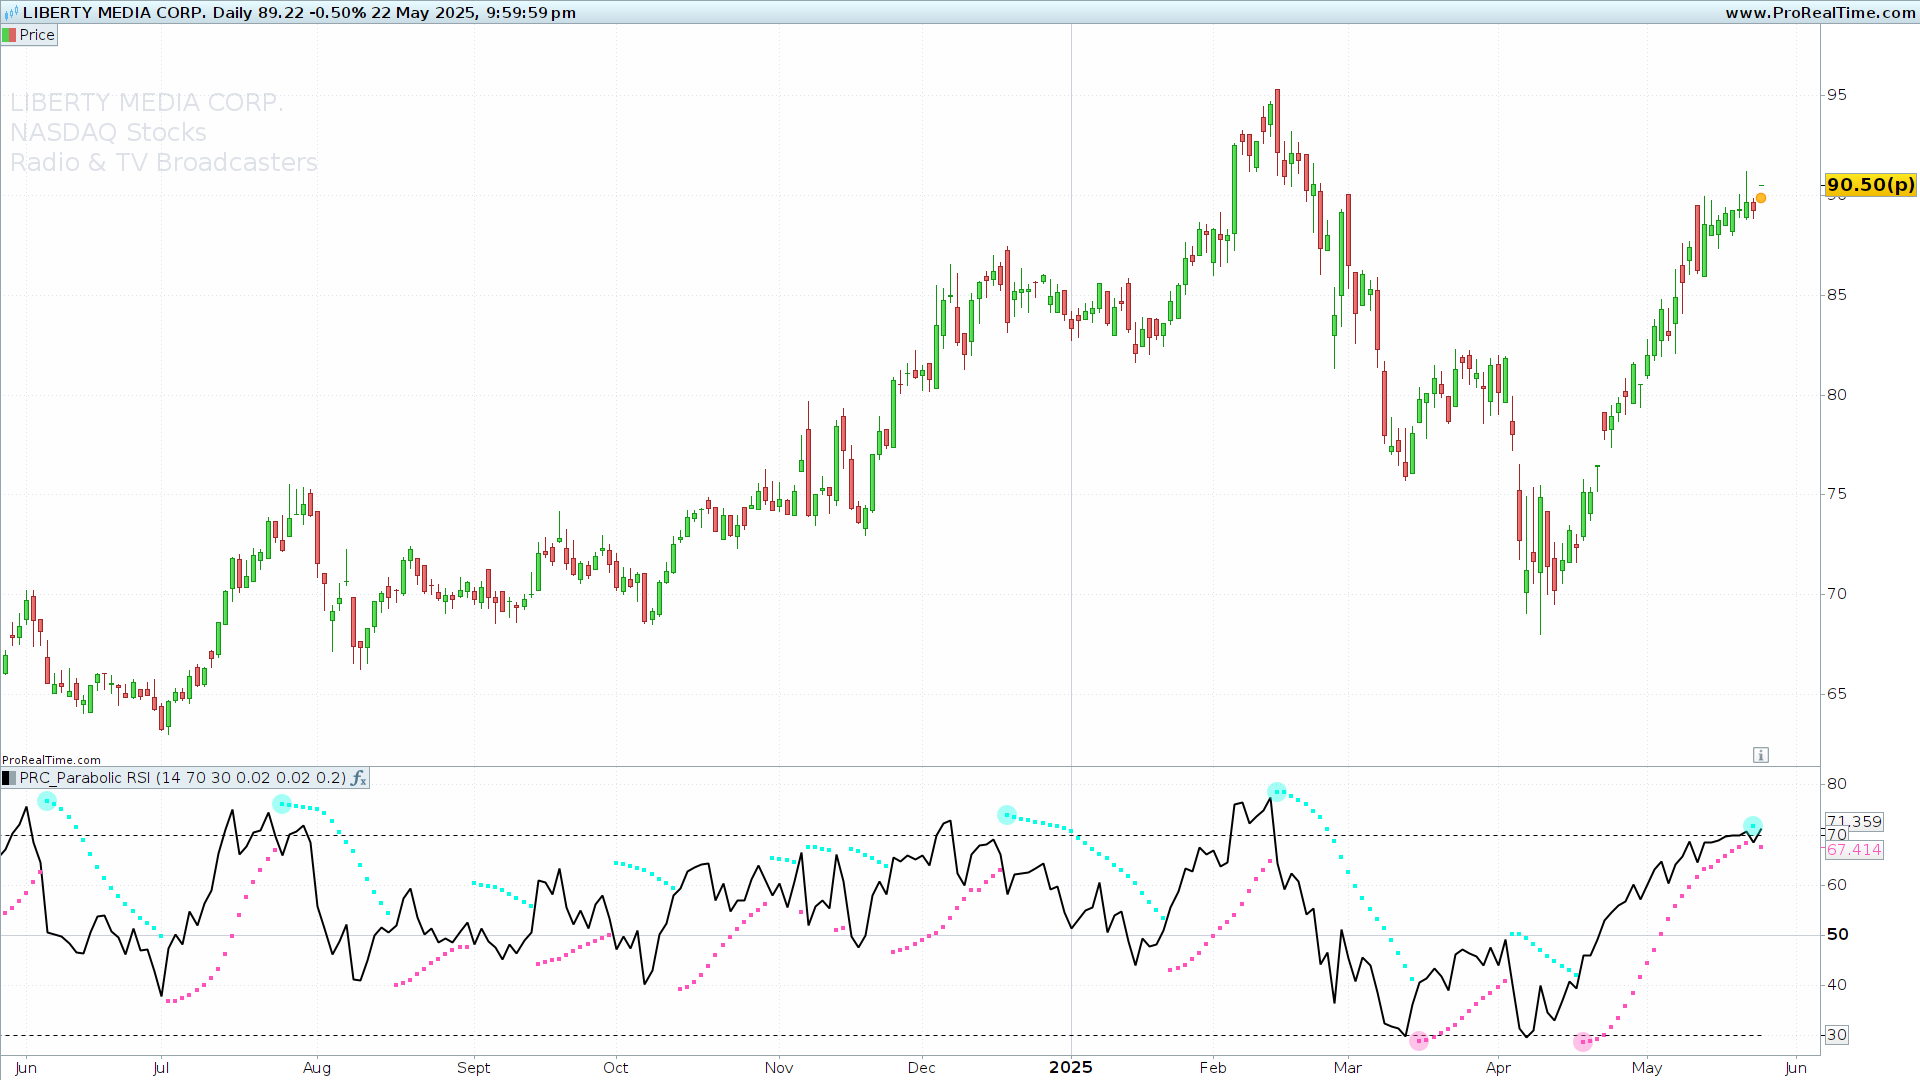
This advanced screener for ProRealTime accurately identifies the key moments when the RSI stops falling (or rising) and starts to reverse sharply, using an innovative application of the Parabolic SAR directly on the RSI.
What does this screener do?
The Parabolic RSI Screener is designed to locate potential trend changes by combining two classic technical analysis indicators:
-
RSI (Relative Strength Index)
-
Parabolic SAR
But with a completely innovative twist: the Parabolic SAR is applied not to the price, but to the RSI, transforming it into a dynamic reversal detection system.
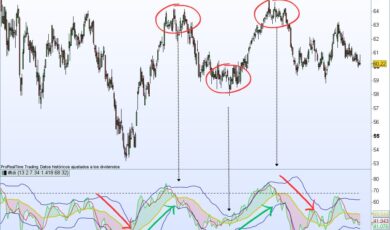
✅ Bullish signals: when the SAR indicates an upward turn and the RSI is in the oversold zone
✅ Bearish signals: when the SAR turns downward and the RSI is in the overbought zone
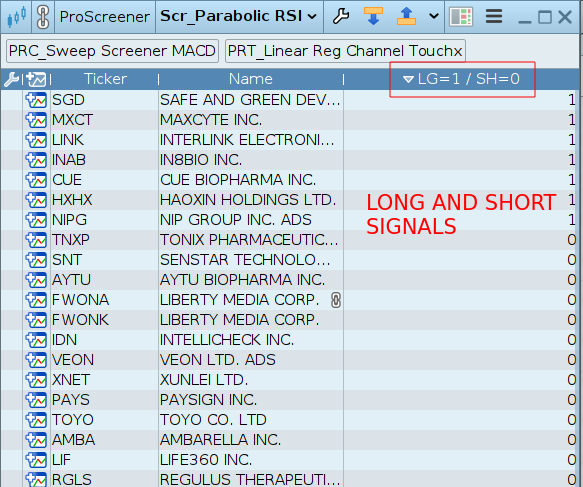
These conditions allow for anticipating significant movements in price action, for both long and short strategies.
Full customization
This screener is fully configurable:
- RSI length
- Overbought and oversold levels
- Parabolic SAR parameters (start, increment, and limit)
Moreover, it works on any asset (stocks, indices, currencies, cryptocurrencies…) and on any timeframe.
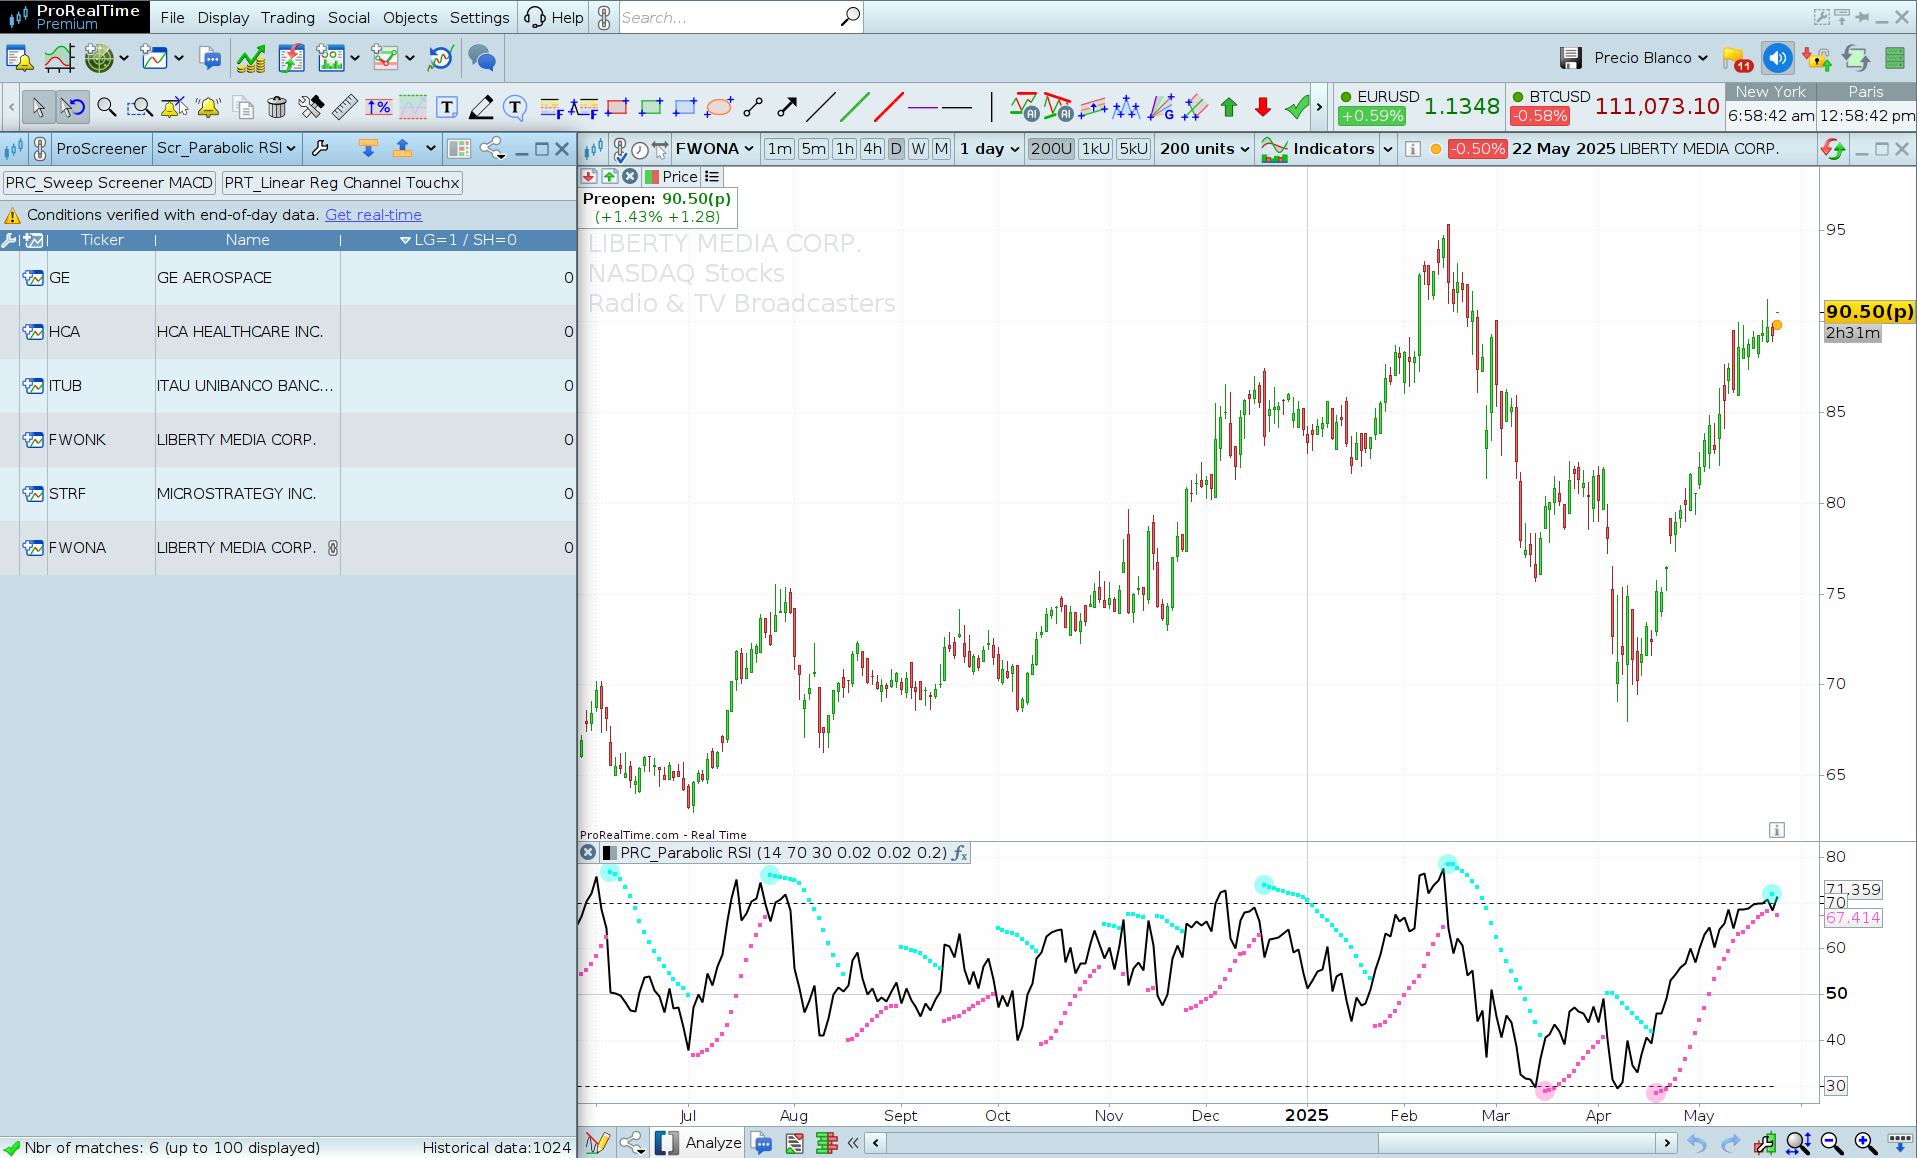
What’s included?
-
Parabolic RSI Indicator
-
Ready-to-use Screener
=====================================================================
Detección de giros con precisión quirúrgica
¿Quieres detectar los puntos de giro con mayor probabilidad de éxito en cualquier activo y en cualquier marco temporal?
Este screener avanzado para ProRealTime identifica con precisión los momentos clave en los que el RSI deja de caer (o subir) y empieza a girar con fuerza, utilizando una innovadora aplicación del Parabolic SAR directamente sobre el RSI.
¿Qué hace este screener?
El Screener Parabolic RSI está diseñado para localizar cambios de tendencia potenciales combinando dos indicadores clásicos de análisis técnico:
-
RSI (Relative Strength Index)
-
Parabolic SAR
Pero con un giro totalmente innovador: el Parabolic SAR no se aplica al precio, sino al RSI, transformándolo en un sistema dinámico de detección de reversión.
✅ Señales alcistas: cuando el SAR indica un giro al alza y el RSI está en zona de sobreventa
✅ Señales bajistas: cuando el SAR gira a la baja y el RSI está en zona de sobrecompra
Estas condiciones permiten anticipar movimientos importantes en la acción del precio, tanto para estrategias largas como cortas.
Personalización total
Este screener es completamente configurable:
-
Longitud del RSI
-
Niveles de sobrecompra y sobreventa
-
Parámetros del Parabolic SAR (valor inicial, incremento y límite)
Además, funciona en cualquier activo (acciones, índices, divisas, criptomonedas…) y en cualquier temporalidad.
¿Qué incluye?
-
Indicador Parabolic RSI
-
Screener listo para usar
sam00075 (propietario verificado) –
Very efficient, and imperative to have with the Parabolic RSI indicator.