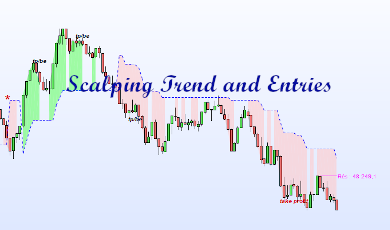
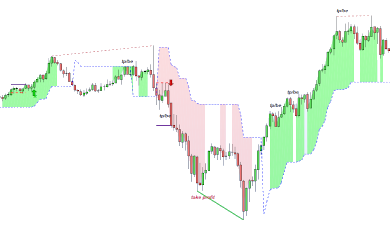
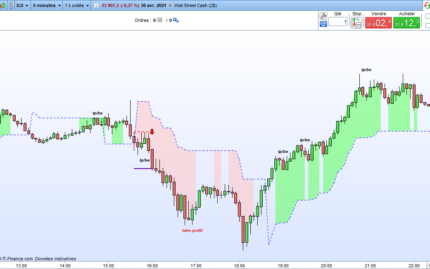
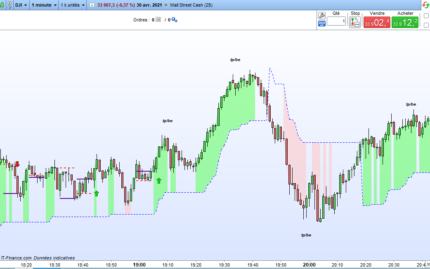
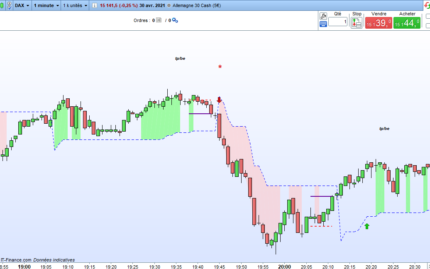
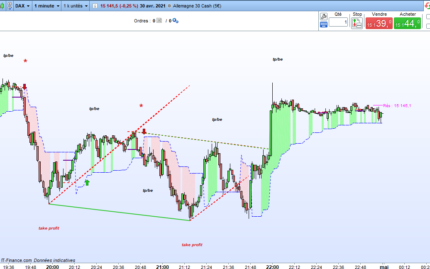
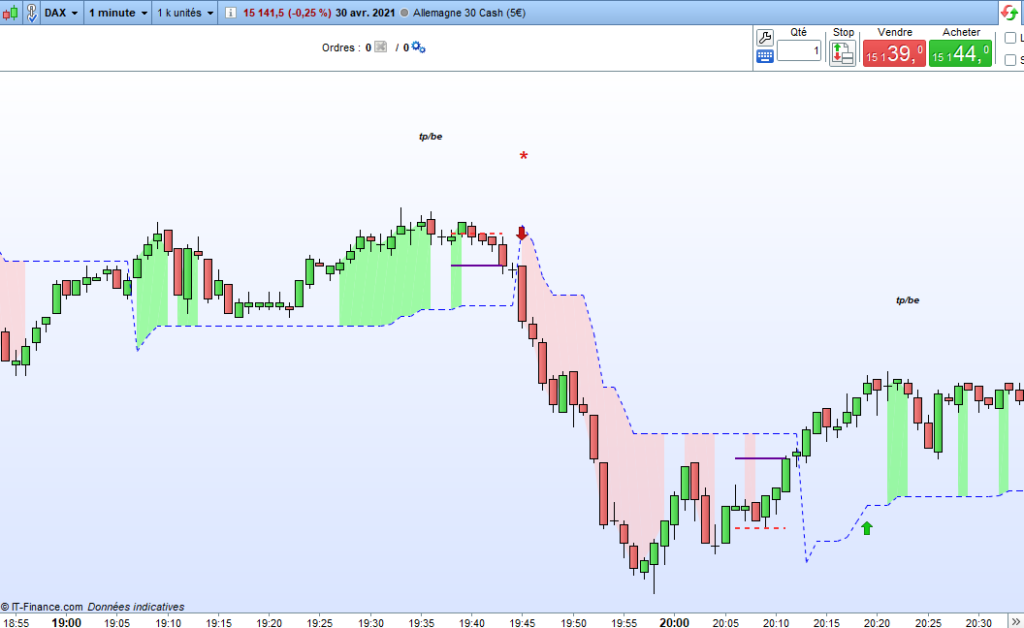
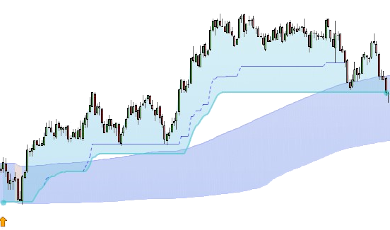
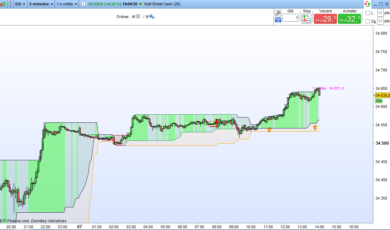
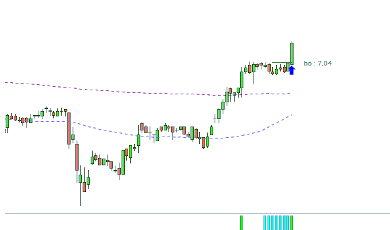
This indicator is used to visualize the trend (with green and red colors) of a index and allows you to have entry points.
- an entry is visible in the graph when a segment is drawn. The indicator then shows a possible stoploss using a dotted segment.
- if an entry point seems to be very good, the indicator draws an arrow.
- once the indicator shows you where to breakeven, take profits or advise you to end the trade.
- an asterisk is visible when volatility returns.
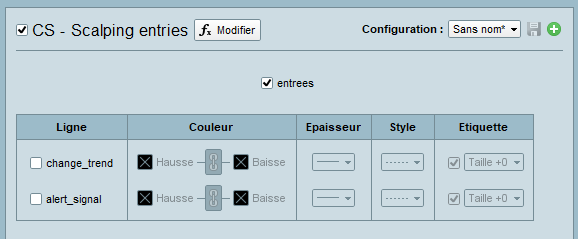
To use this indicator on a graph, you have to disable 2 options in the configuration:
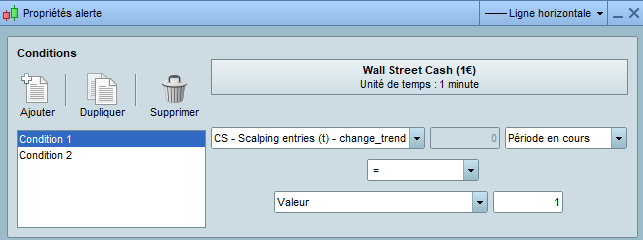
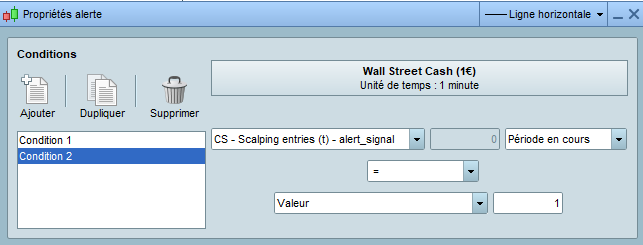
change_trend and alert_signal are 2 values return to create alerts and screeners.
You can create alert using the PRT tools:
Advantages:
- you don’t make overtrading and wait for good entry point.
- an indicator to visualize intraday bullish and bearish oblique support and resistance is available.
- an indicator to visualize intraday divergence is available.
- you can use my “breakpoint detector” to complete your configuration.
- the parameters are optimized for 1 minute and 5 minutes timeframes.




Bewertungen
Es gibt noch keine Bewertungen.