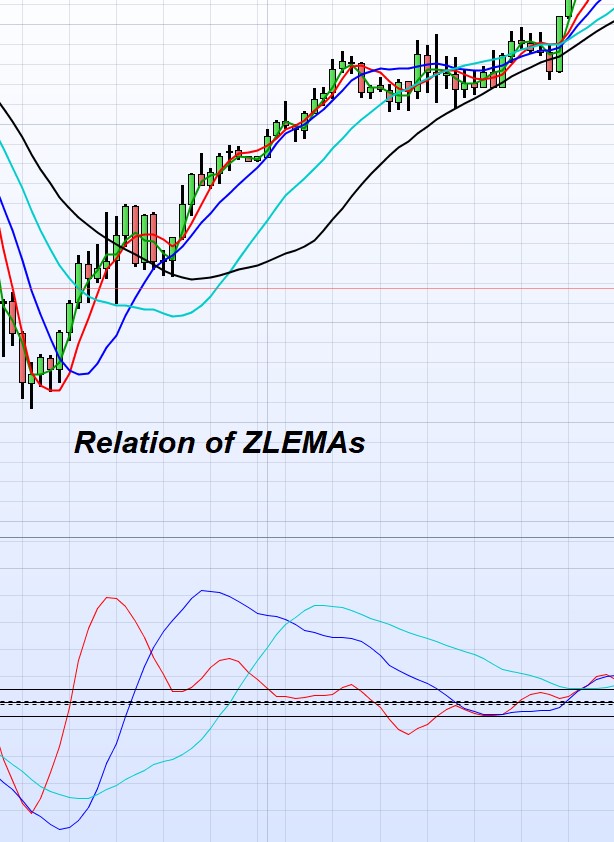


Relation of ZLEMAs
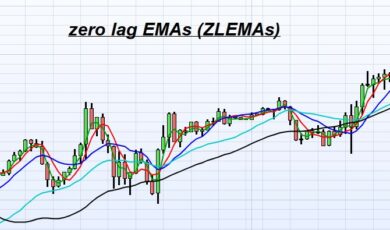
“Exponential Moving Averages” (EMAs) are a common tool to judge the advance of a trend but they suffer from lag and are telling you not the whole story. This indicator takes away the lag (hence Zero-Lag/Loss-EMAs; or “EMAs” for short) to show hidden relations in advance to better forecast future development.
Why the bundle?
First, “Relation of ZLEMAs” works on its own and doesn’t need a second indicator! It should be opened in a separate window for full potential.
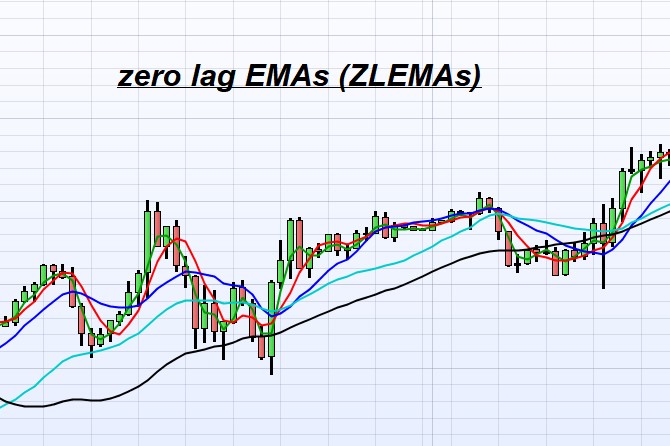
“ZLEMAs” (for the price window) is only for your convenience to have a better overview and it gives you 5 “Zero-Lag/Loss-EMAs” to work with in a single indicator. More important it also gives you the “colour coding” to better visualize and understand “Relation of ZLEMAs”.
If you have colour blindness you can change the respective lines to dots or dashes in both of the indicators.
What does it do?
If you use “ZLEMAs” the picture below shows you how the relation works, and you can change the periods accordingly – if you want to change them at all.
“Relation of ZLEMAs” computes the relation of two periods (the shorter period to the next longer period) to give you a clear indication of the very likely future behaviour of the course. The relation always has the colour of the first (shorter) period (right side of the picture).
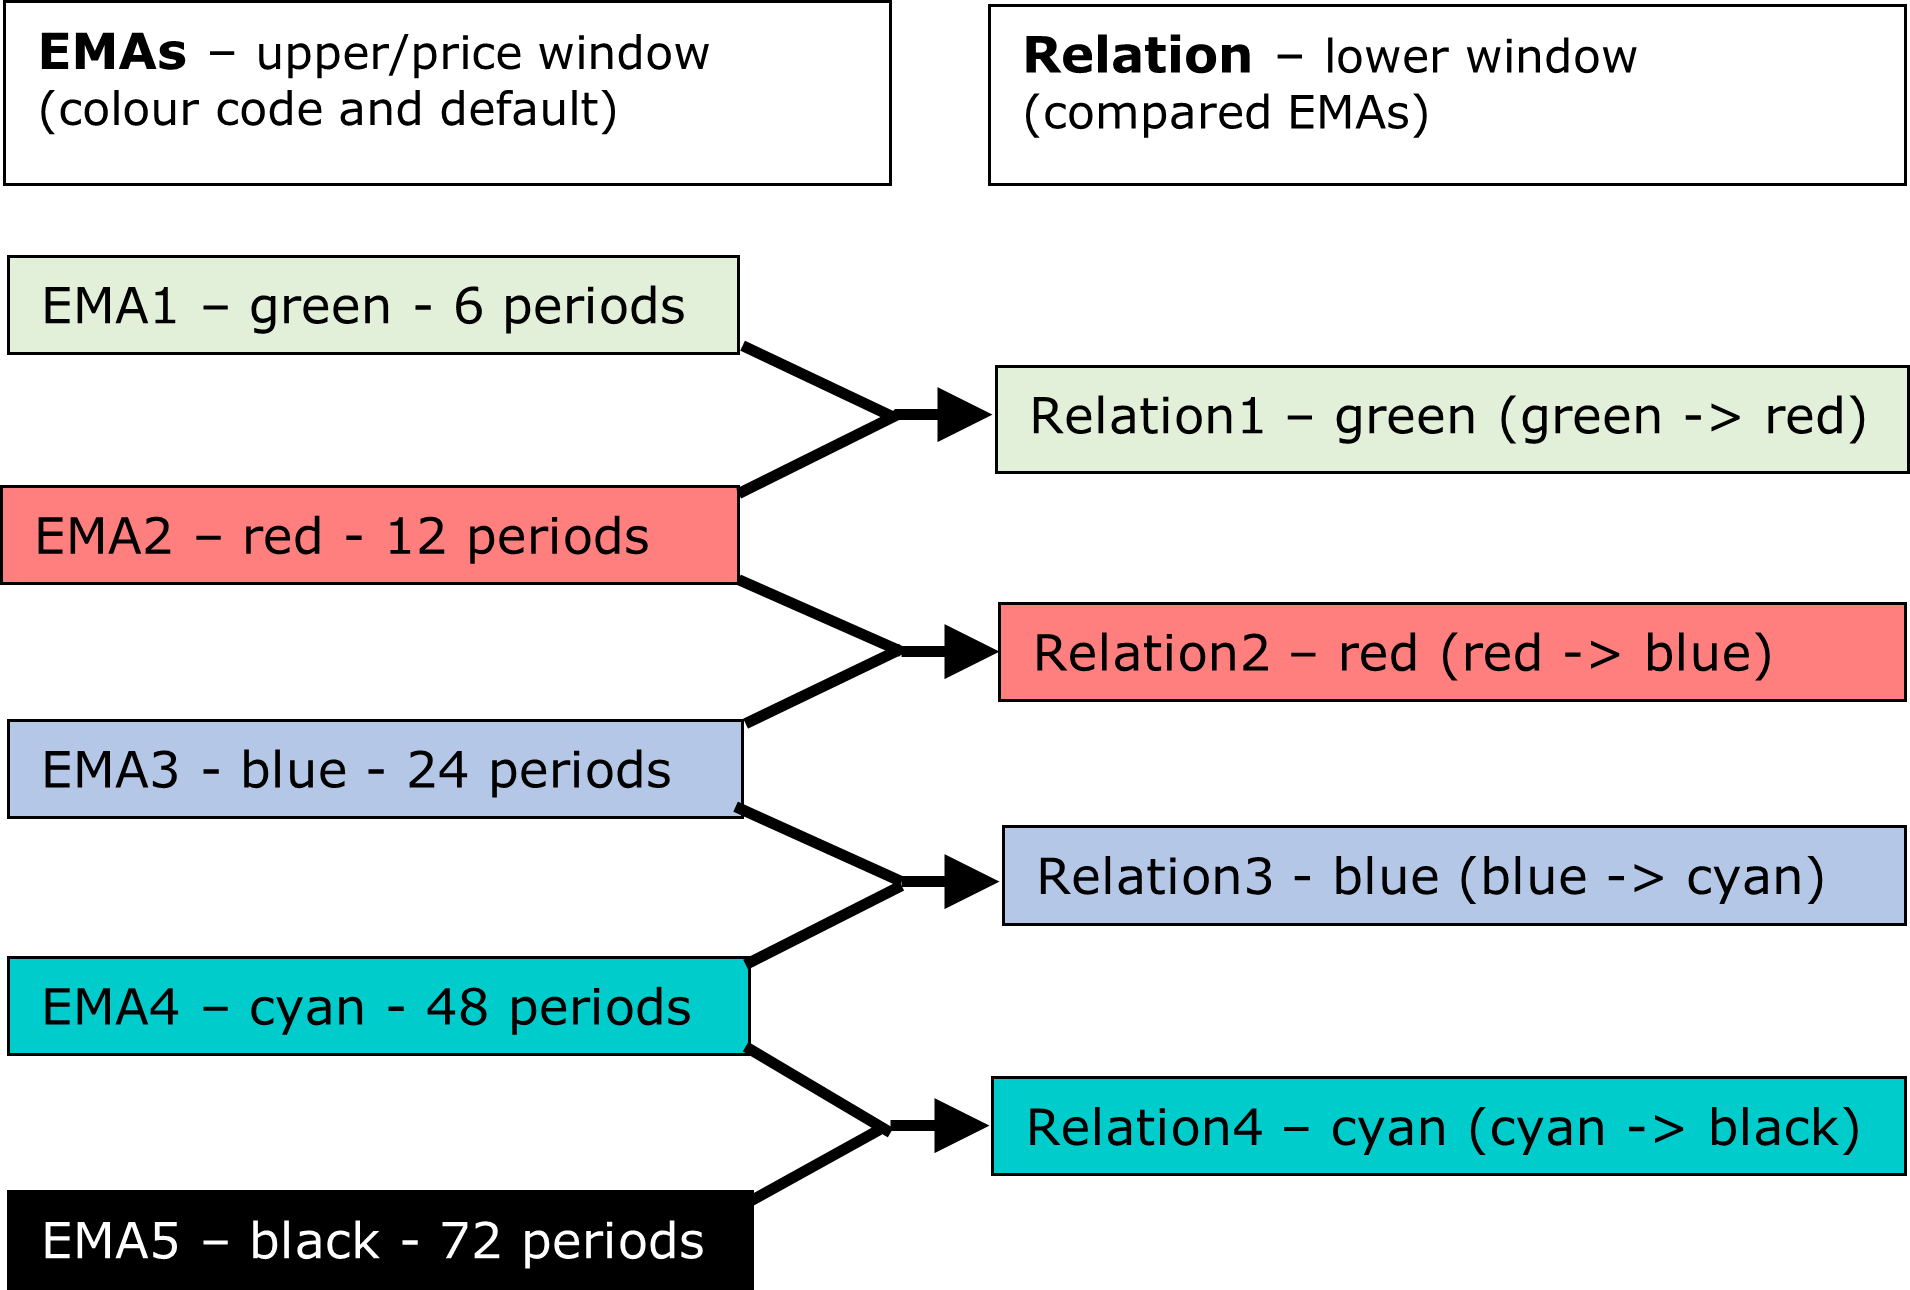
Mapping of Relations
Customization:
· You can choose the periods as you like but I recommend them having a meaningful relation to each other; the default is chosen to always double the period (except the last one). They are named “inputEMA” with the respective number.
· As well you can choose which relations you want to be shown by switching them on or off. If you feel overwhelmed, try to use only one or two first and add more later on.
For your convenience there are also two threshold lines called “inputOuterLimit” and “inputInnerLimit” which you can customize yourself to have limits which should or should not be overcome for you to trigger a signal. They are named “Outer Limit” and “Inner Limit” with +/- for over and under “zero”.
How is it used?
You can choose to stick to the shorter periods not to miss a quick change of direction or the longer trend to trade more relaxed.
There are (at least) four scenarios which give good suggestions to where the course might go:
1) If all relations are either over or under the zero line, you are having a strong trend. If the shorter periods are meandering around zero you might want to stick to the longer periods.
2) If a relation crosses over the zero line the short-term trend is picking up speed against the longer-term period and the course is likely to go up (opposite for crossing below).
3) If a relation is going through a climax and then continuing downwards chances are high that he upward speed is declining and might eventually become a correction or a downward trend. Especially if other relations are following suit (opposite for down-trends).
4) If several relations are used crossing points are also very important as they indicate one relation (usually the shorter period) is changing direction and the rest might follow. A change of trends might happen.
Does it work for any stock exchanged products (Stocks / Forex / etc.) and timeframes?
The indicator has been developed for the DAX in short periods but should work for all stock exchanged products and timeframes. The examples use the DAX in Minutes and days with the same default values showing how it works. But you are free to use it for any traded goods and change the defaults as you like. Just be careful to change them meaningful!
Examples:
(Arrows and texts are for explanation purposes only and are not a component of the indicator itself)
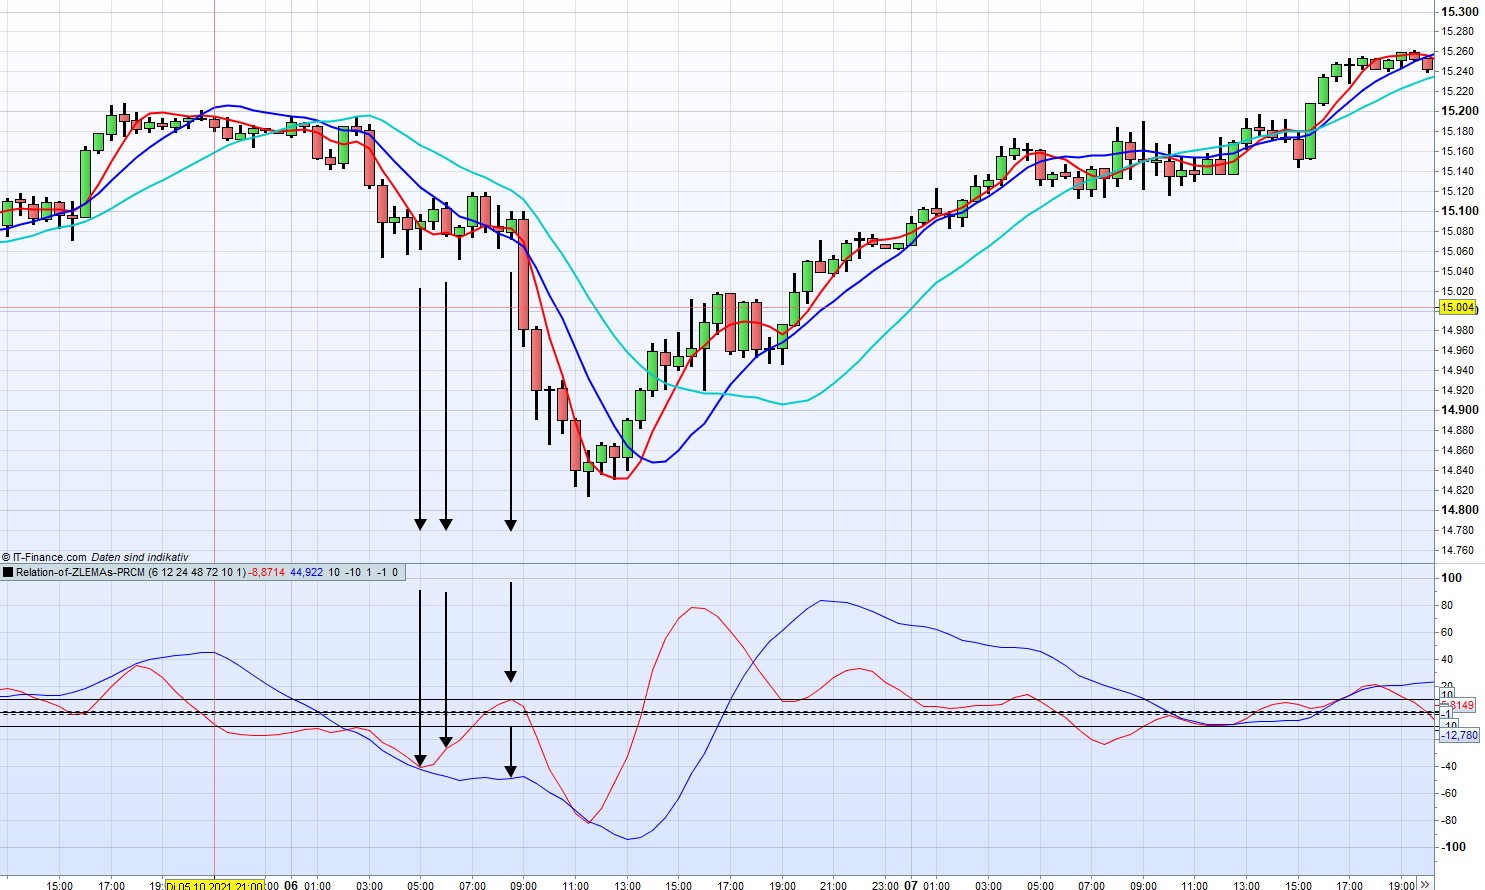
only a correction: blue relation line continues while red relation is showing correction
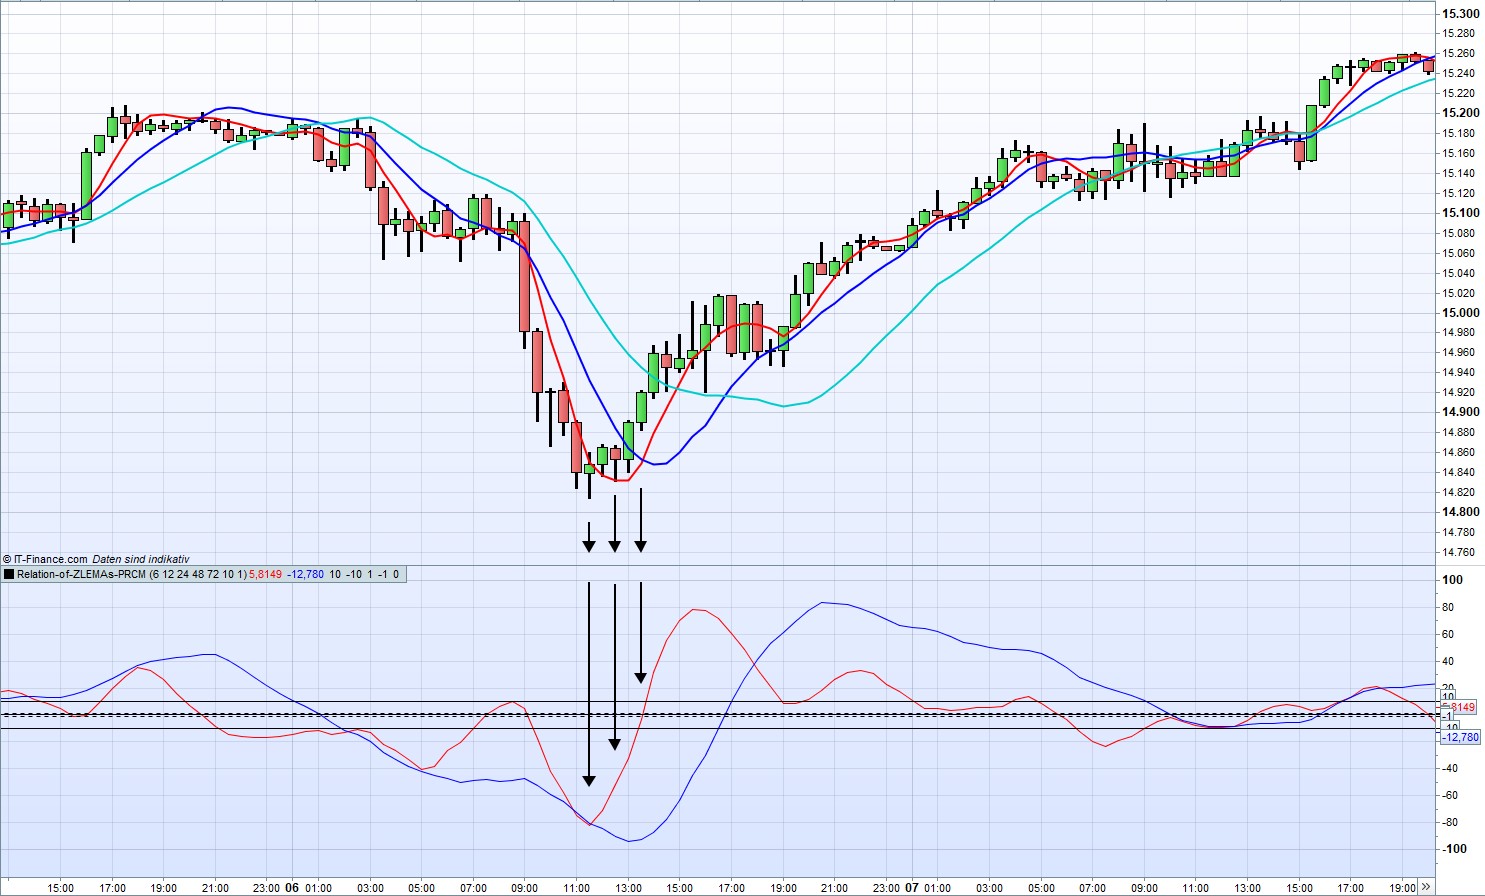
trend reversal: red relation is rising fast and crossing over “zero” indicating the low of the course, blue (longer) relation is following
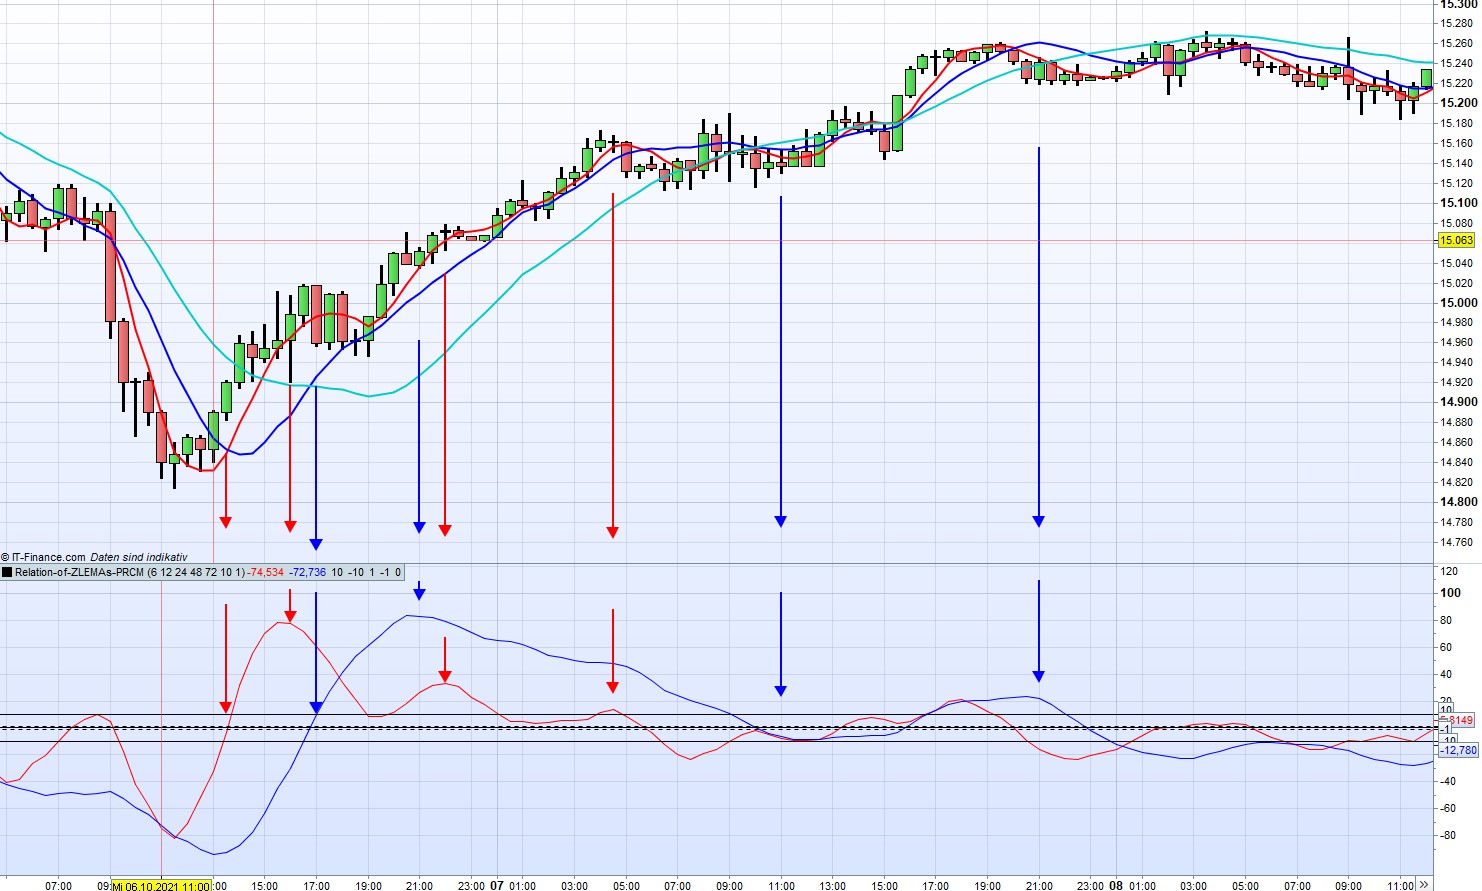
trend emerging and slowing down: the short trend is pricing up speed first (red relation and arrows) but then slowing down (lower climaxes), the blue relation (longer period) confirms this by following suit and going down after climax. The climax of the (stock) price has been reached.
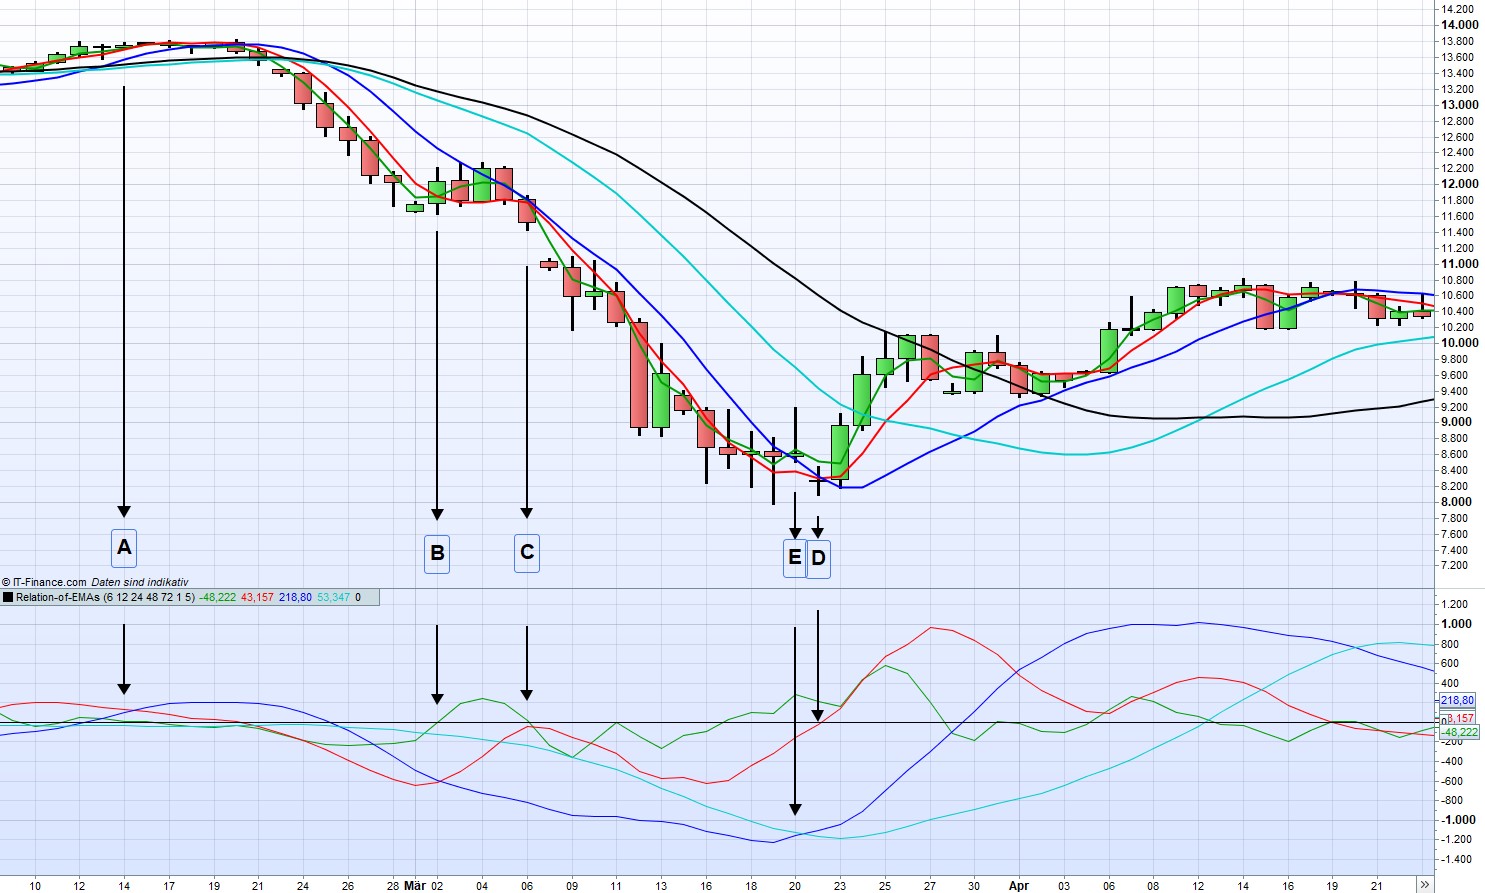
The downturn of the DAX around March 2020, daily candlesticks
Reviews
There are no reviews yet.