
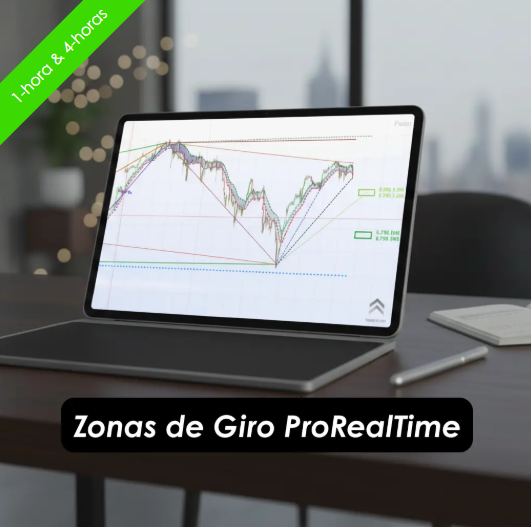

Pivot Zones are the price levels at which the price of an asset is likely to consolidate or change its direction. Institutional Investors take positions against the previous trend at these price levels, resulting in lateral consolidation processes, or changes in the direction of the price.
The indicators we have developed uses 1-hour timeframe data to determine at which price levels more institutional buy or sell orders can accumulate that may alter the previous trend.
They distinguishes between major and minor order Pivot Zones. In addition, it also shows the price levels at which potentially new Pivot Zones could form in the future.
To facilitate its interpretation, it allows the option of displaying written comments on the chart, both in English and Spanish, explaining what can be expected. It also anticipates of the price levels at which new Bullish and Bearish Pivot Zones could emerge in the future.
Additionally, on the @InversoresInstitucionales YouTube channel, every week we publish videos with the application in real time of this indicator on 14 of the most important assets. We also do every Wednesday live sessions where users can request the analysis of the asset they are most interested in.
This indicator always shows the last two Pivot Zones, bullish and bearish. Compared to traditional alternatives such as Zig Zag, the main advantage of the Pivot Zones Indicator is that it avoids repainting, which allows the user to consider building trading strategies based on this information in combination with any other methodology. A second advantage is that the identification of the Pivot Zones is done in a very early stage, as shown in the video above.
It is complemented by the Historical Pivot Zone Indicator, also available as a bundle, which shows the concatenation of confirmed Pivot Zones, allowing the user to quantitatively analyze the path traced by the asset’s price and to detect the main trend of the asset.
The 8-minutes video below explains (in Spanish) how to apply and interpret correctly both the Pivot Zone and the Historical Pivot Zone Indicators that are available as a bundle.
This indicator is always in constant evolution, and any modification we introduce will be available to all users.
We hope you enjoy this indicador as much as we do!
Reviews
There are no reviews yet.