

Overview
The Pivot-based EMA Indicator is a powerful tool designed for traders of all levels to analyze and trade markets with precision. By leveraging Pivot-Based Exponential Moving Averages (PEMAs), it highlights trends, reversals, and high-probability setups across multiple timeframes. Whether you’re a day trader focusing on intraday pullbacks, a swing trader looking for mid-term trends, or a position trader seeking long-term opportunities, this indicator streamlines the process of market analysis and decision-making.
Plot
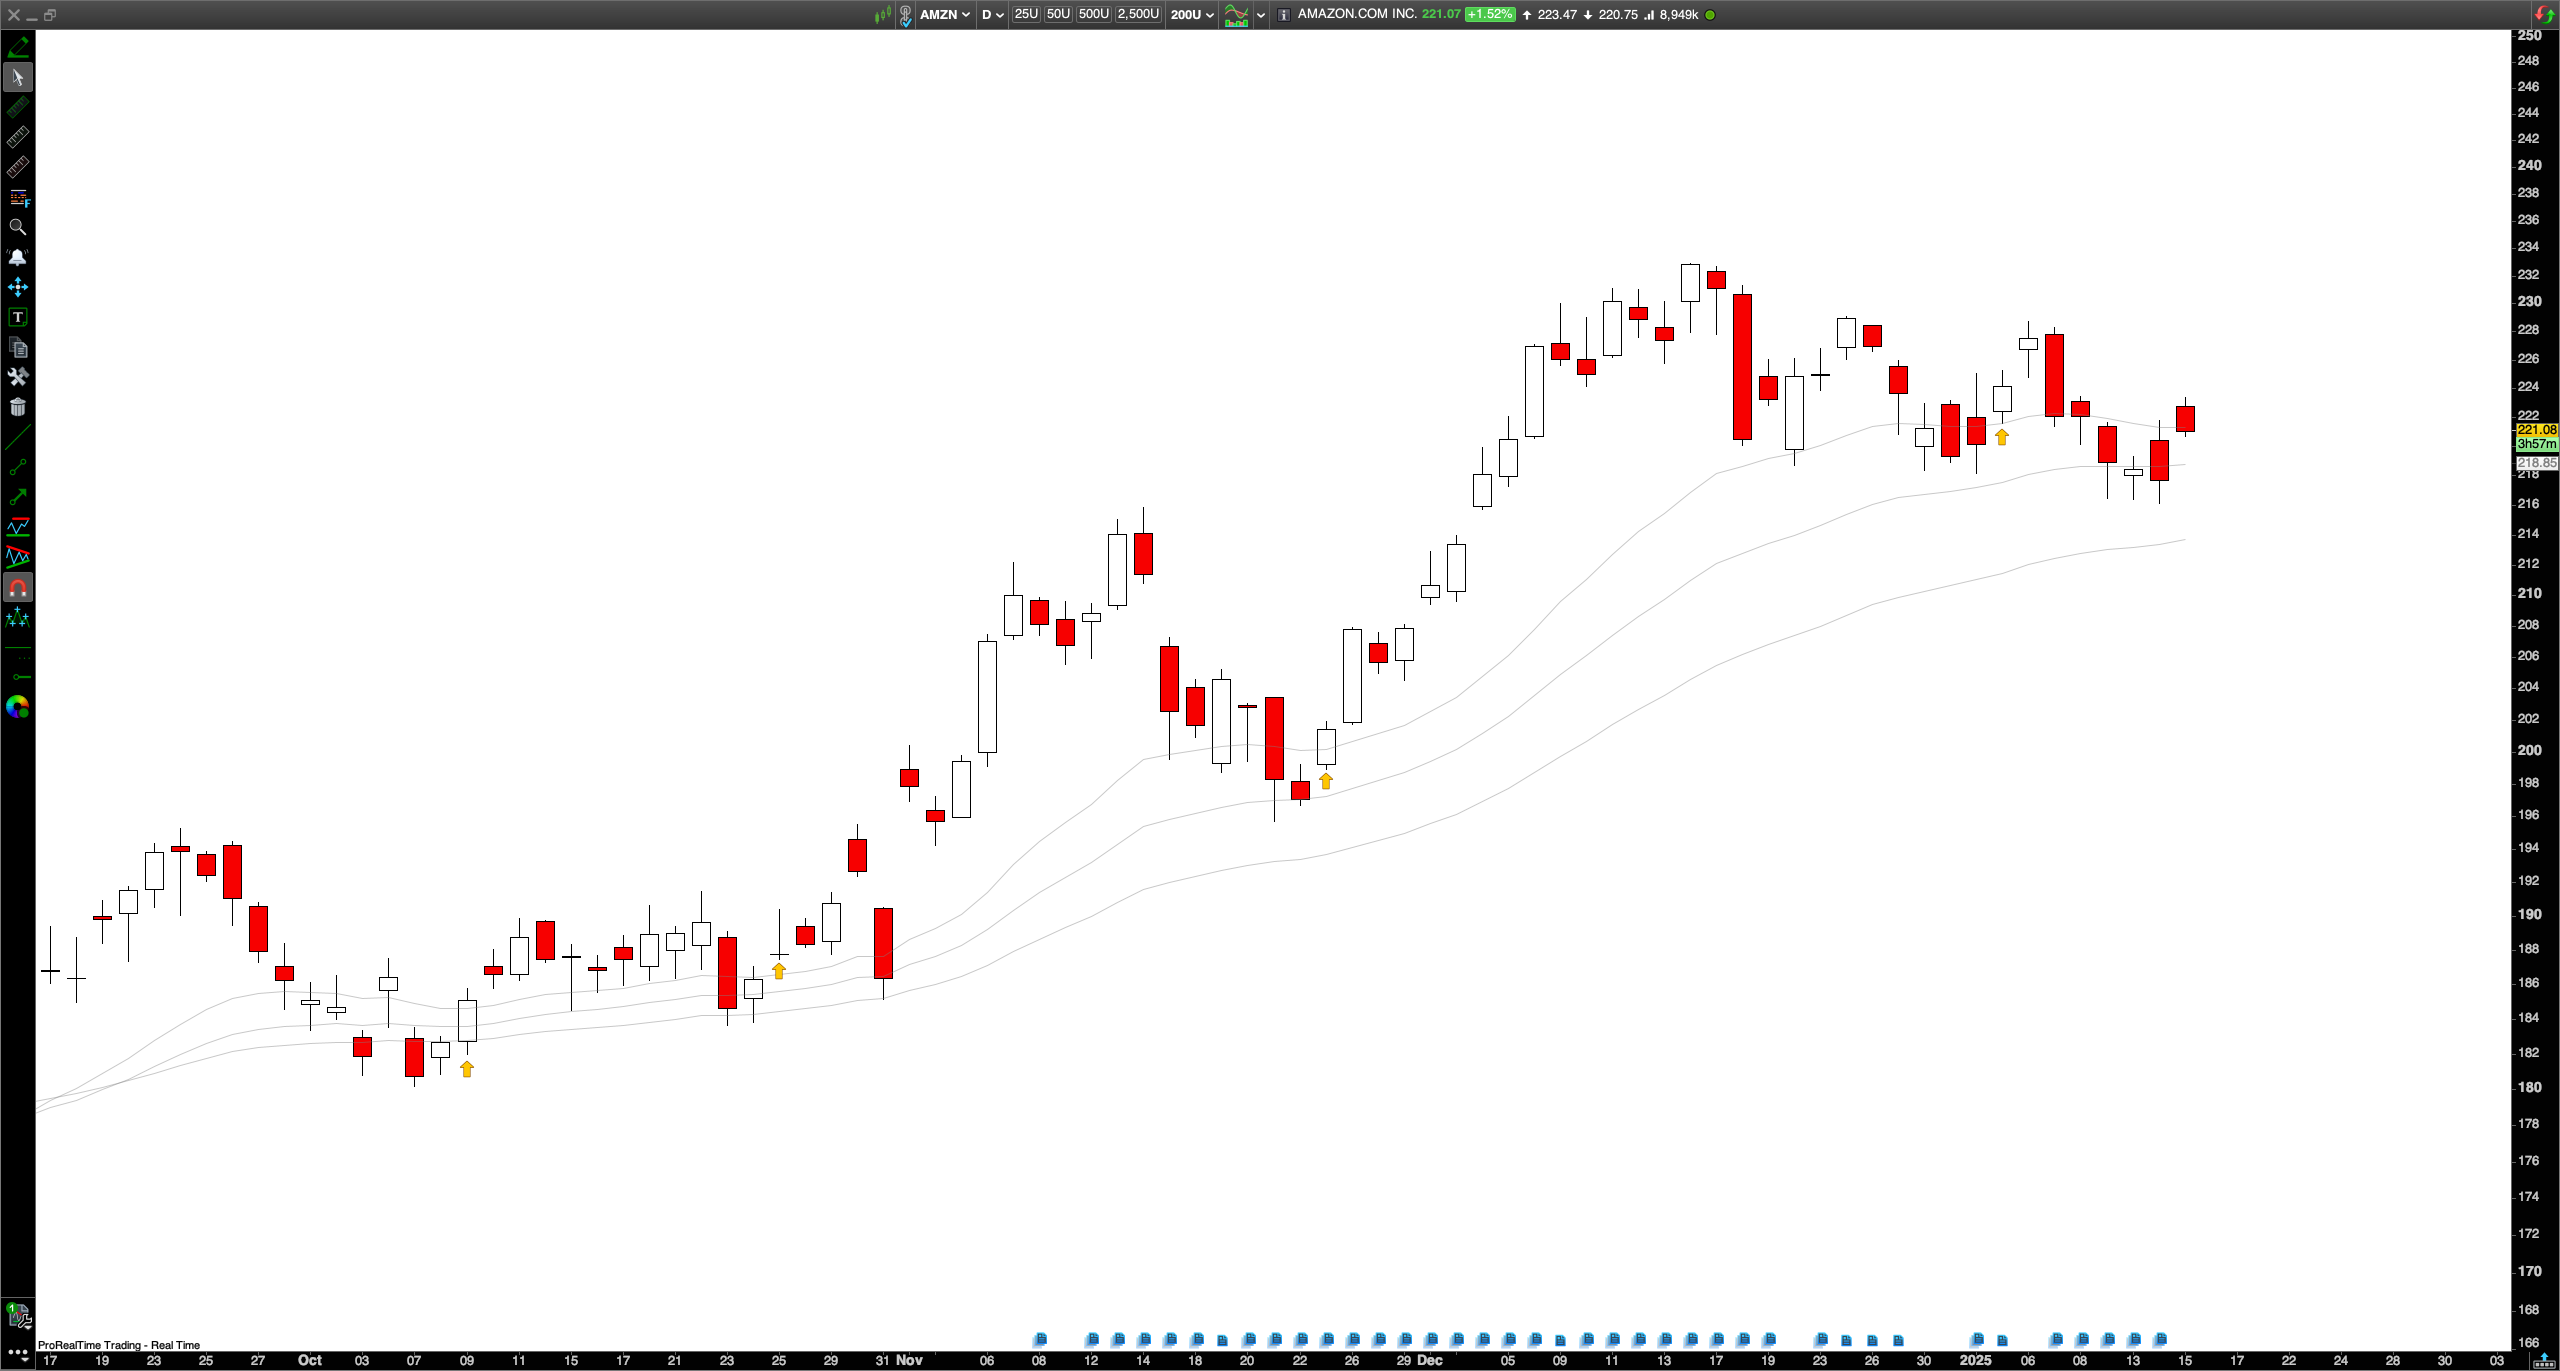
The indicator can be plot on any timeframe.
Example: PEMA plot on daily timeframe (AMZN), showing three nice pullback buy signals
Key features
-
Pivot-Based Moving Averages: Calculates PEMAs using central pivot points for dynamic market insights
-
Multi-Timeframe Precision: Suitable for short, medium, and long-term trend analysis
-
High-Probability Filtering: Identifies pullbacks, crossovers, and breakouts for actionable setups
-
Customizable Settings: Adapt the indicator to your specific trading strategies and criteria
-
Multi-Instrument Support: Works seamlessly with stocks, forex, futures, and other instruments
-
Comprehensive Strategy Support: Ideal for intraday, swing, and position trading strategies
Benefits for traders
-
Save Time: Quickly identify trends and setups with clear PEMA signals
-
Enhance Accuracy: Spot pullbacks, crossovers, and breakouts with precision
-
Improve Efficiency: Simplify market analysis with an easy-to-use indicator
-
Adaptable to Strategies: Integrates seamlessly into your preferred trading style
-
Expand Opportunities: Analyze broader market trends and dynamics effortlessly
How it works
The PEMA Indicator uses Pivot-Based Exponential Moving Averages (PEMAs) to dynamically analyze market trends and generate actionable signals.
Here’s how it works:
-
Stacked and Sloped PEMAs: Identifies trending markets when PEMAs align in a bullish or bearish configuration
-
Pullback Opportunities: Signals buy or sell pullbacks within the Trigger Zone between the fast and medium PEMAs
-
Crossover Signals: Highlights bullish or bearish crossovers between fast and slow PEMAs to indicate potential trend reversals
-
Breakout Detection: Scans for breakouts when price moves significantly above or below the PEMAs.
-
Mean Reversion: Detects overextended price movements with opportunities to fade back to PEMAs
-
Change of Bias: Identifies key moments when the trend shifts, marked by adverse price closes and PEMA crossovers
This indicator offers a systematic approach to analyze market trends, enabling traders to make confident, data-driven decisions across various timeframes.
Settings
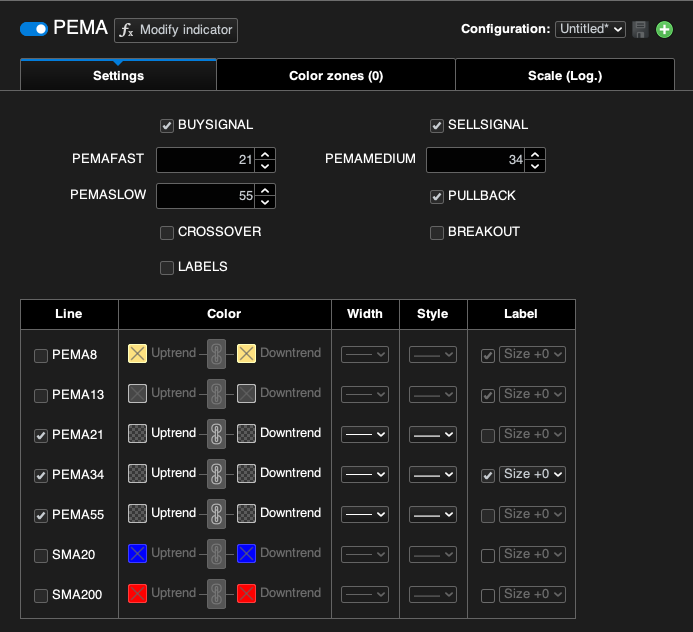
- BUYSIGNAL: plot buy signals on chart
- SELLSIGNAL: plot sell signals on chart
- PEMAFAST: Configure the period for the fast PEMA. This parameter will be used for signal detection (PULLBACK, CROSSOVER, BREAKOUT)
-
PEMAMEDIUM: Adjust the period for the medium PEMA. This parameter will be used for signal detection (PULLBACK, CROSSOVER, BREAKOUT)
-
PEMASLOW: Set the period for the slow PEMA. This parameter will be used for signal detection (PULLBACK, CROSSOVER, BREAKOUT)
-
PULLBACK: Enable or disable pullback detection.
-
CROSSOVER: Activate crossover buy or sell signals.
-
BREAKOUT: Turn on breakout detection for bullish or bearish setups.
-
LABELS: Show text annotations for each signal directly on the chart
- Line: flag all the PEMAs you wish to plot on the chart
Who can use it?
-
Day Traders: Utilize pullbacks and breakout signals for precise intraday opportunities
-
Swing Traders: Analyze multi-day trends and reversals for mid-term setups
-
Position Traders: Leverage longer-term PEMA alignments to plan strategic trades
-
Market Analysts: Gain insights into market trends, structural shifts, and reversals
-
Strategy Developers: Build robust trading systems using actionable PEMA-based signals
Reference
The methodology behind the PEMA Indicator is inspired by established pivot-based analysis techniques, including insights from Frank Ochoa’s teachings. This indicator has been independently developed and optimized for ProRealTime, providing a reliable and efficient tool for traders across all markets.


Reviews
There are no reviews yet.