9
Compatible with

Products: 3   Favorites: 5   Views: 212   Reviews: 0  

Pack divergencias RSI 3 en 1

1.- Indicador RSI detector de divergencias alcistas/bajistas + señales en RSI
2.- Señales en precio de las divergencias alcistas/bajistas detectadas
3.- Buscador de valores que están dando divergencia por primera vez, con posibilidad de filtrar valores por capitalización de mercado.

Configurables periodos, niveles de sobrecompra, sobreventa y capital negociado.
———————————————————————————————————————-
RSI divergence pack 3 in 1

1.- RSI indicator detecting bullish/bearish divergences + signals in RSI
2.- Price signals of bullish/bearish divergences detected
3.- Search for values that are diverging for the first time, with the possibility of filtering values by market capitalization.

Configurable periods, overbought, oversold levels and traded capital.

PRODUCTS BUNDLE
You will get also license for each of the product(s) listed below when you purchase:

Report Abuse

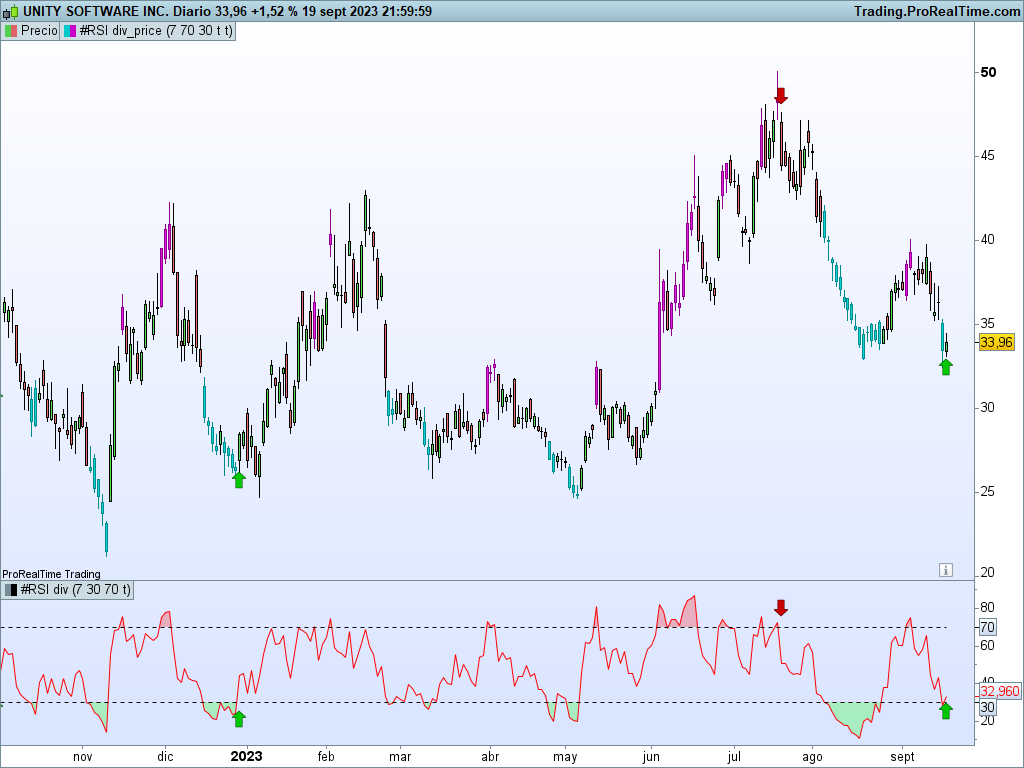
Este indicador/buscador sirve para detectar divergencias alcistas o bajistas entre el precio y el RSI.

Se pueden configurar los periodos de cálculo del RSI y los niveles de sobreventa y sobrecompra.

El indicador muestra la divergencia alcista cuando el precio hace mínimos decrecientes mientras el RSI está en sobreventa y el RSI realiza mínimos crecientes.

La señal se marca cuando se produce el cruce alcista del RSI por el nivel de sobrecompra.

La divergencia bajista se produce cuando el precio hace máximos crecientes y el RSI realiza máximos decrecientes.

La señal se marca cuando el RSI cruza a la baja el nivel de sobreventa.

Las velas se colorean cuando el RSI está en sobrecompra o sobreventa.

———————————————————————————————————-

This indicator/screeener is used to detect bullish or bearish divergences between the price and the RSI.

RSI calculation periods and oversold and overbought levels can be configured.

The indicator shows bullish divergence when the price makes decreasing lows while the RSI is oversold and the RSI makes increasing lows.

The signal is marked when the bullish crossing of the RSI occurs through the overbought level.

Bearish divergence occurs when the price makes rising highs and the RSI makes falling highs.

The signal is marked when the RSI crosses the oversold level downwards.

The candles are colored when the RSI is overbought or oversold.

Reviews

There are no reviews yet.

Only logged in customers who have purchased this product may leave a review.

Product Enquiry

Your personal data will be used to support your experience throughout this website, to manage access to your account, and for other purposes described in our privacy policy

More Items by FormacionEnBolsa.com

Product Image

ProRealTime – Programación avanzada

¡Entrenamiento para aprender las características avanzadas del lenguaje ProBuilder para poder programar todo tú mismo!

80

0

Product Image

RSI Divergence Screener (Detector De Divergencias)

Screener RSI Divergence (Detector de divergencias alcistas / bajistas)

5

0

Product Image

TDI (Traders Dynamic Index) Indicator

The TDI indicator (traders dynamic index) is a powerful indicator (...)

4

3

Ready to Join Our Trading Marketplace!
Over 1,000,000 potential customers are in need for pro quality trading products
Join Us Today