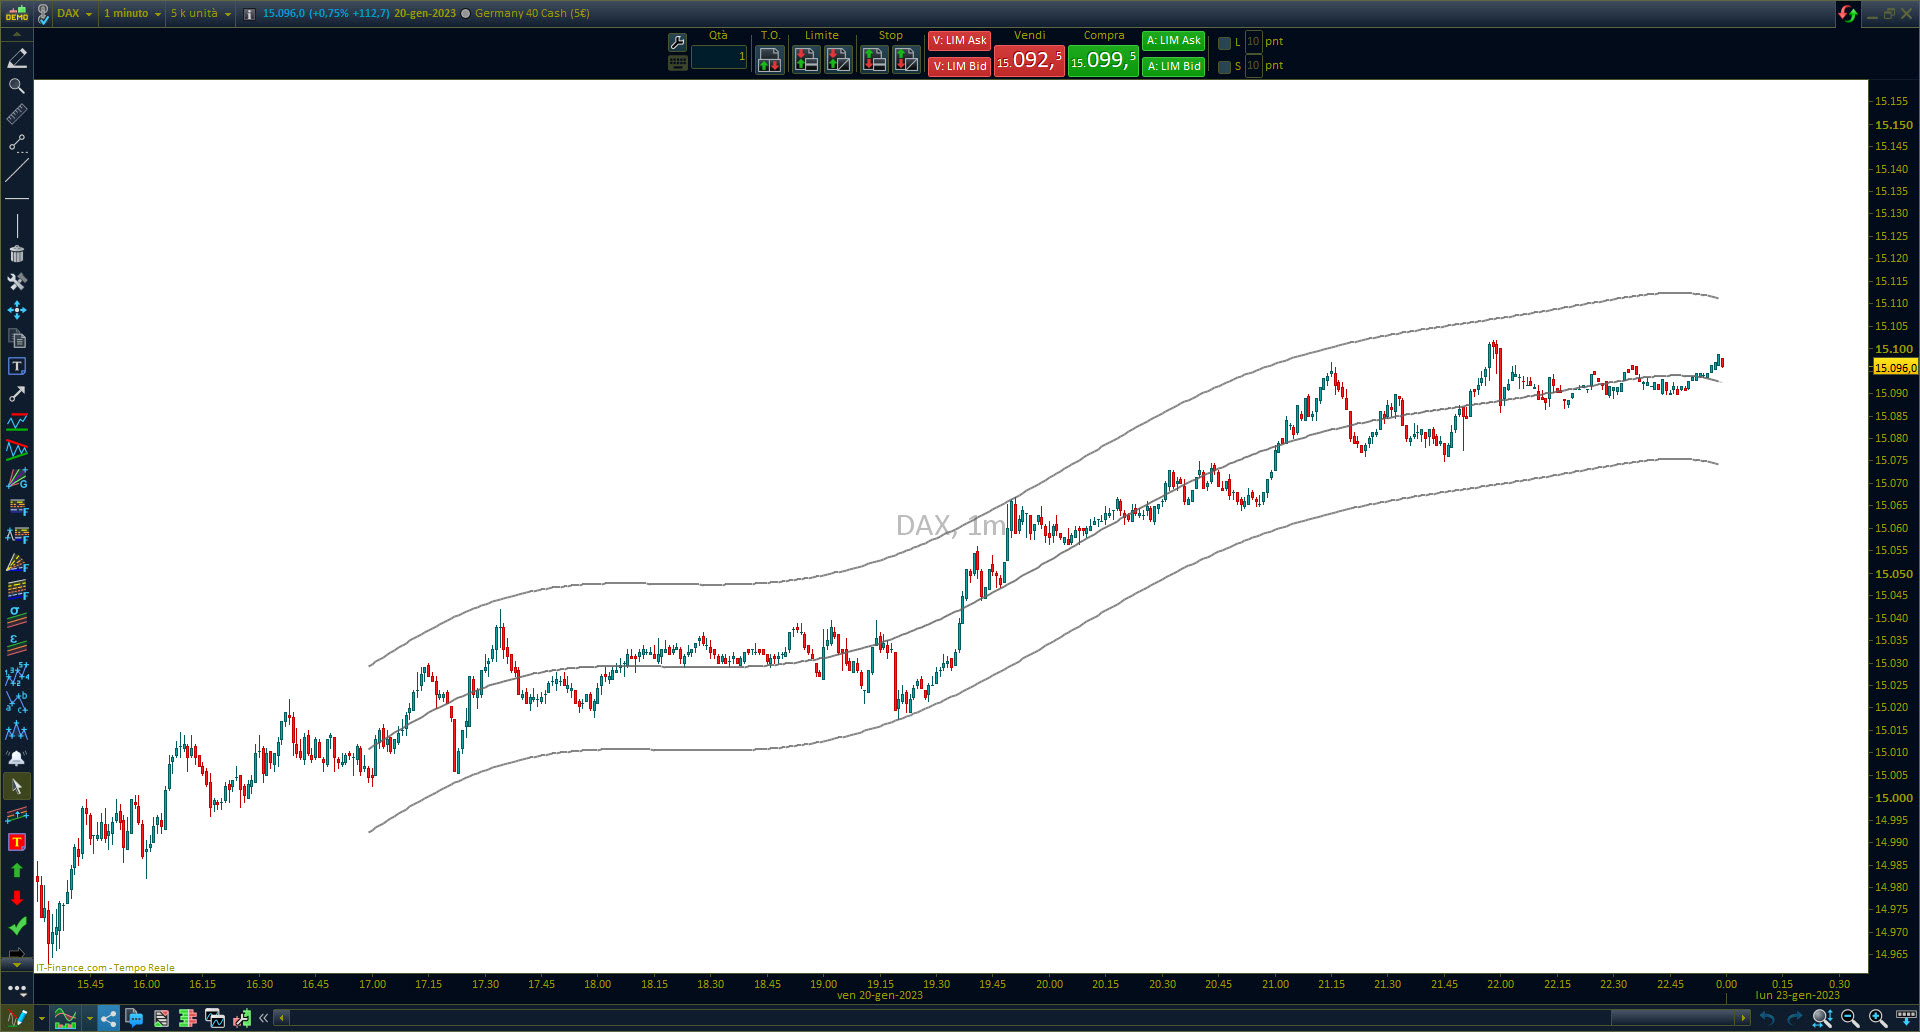
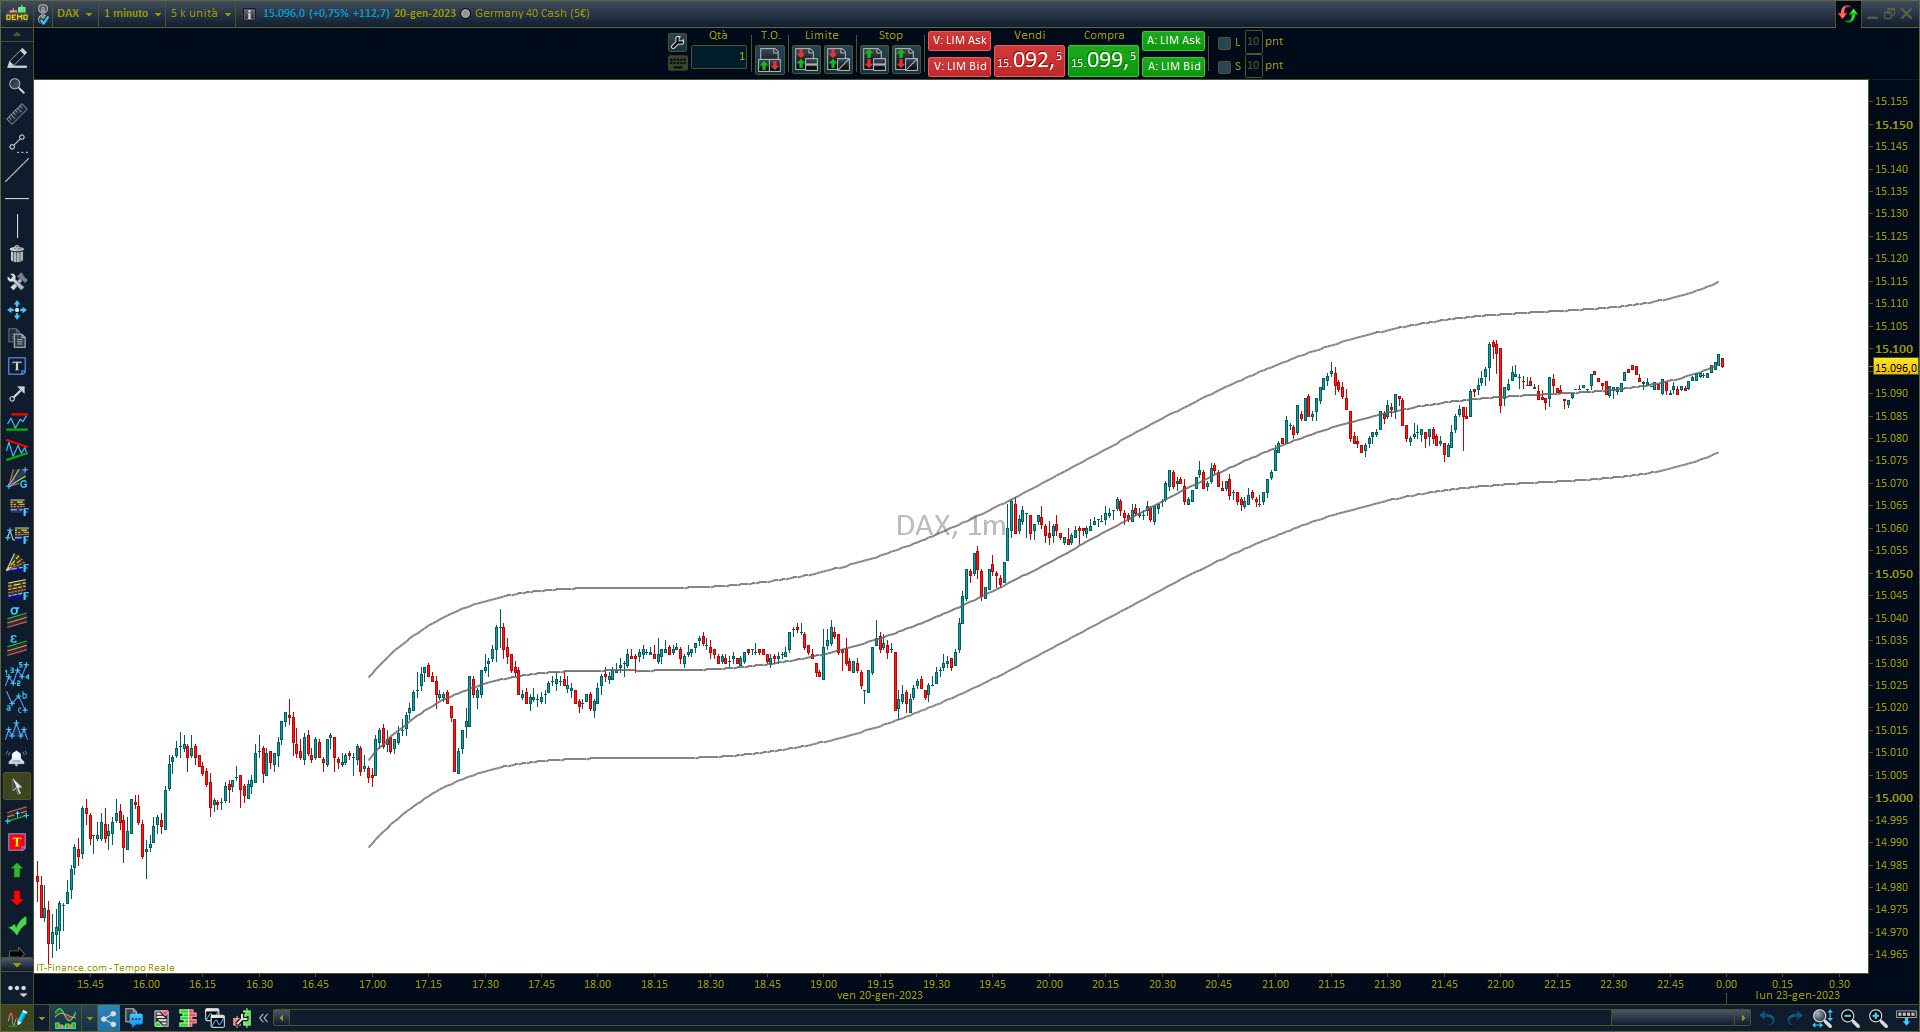
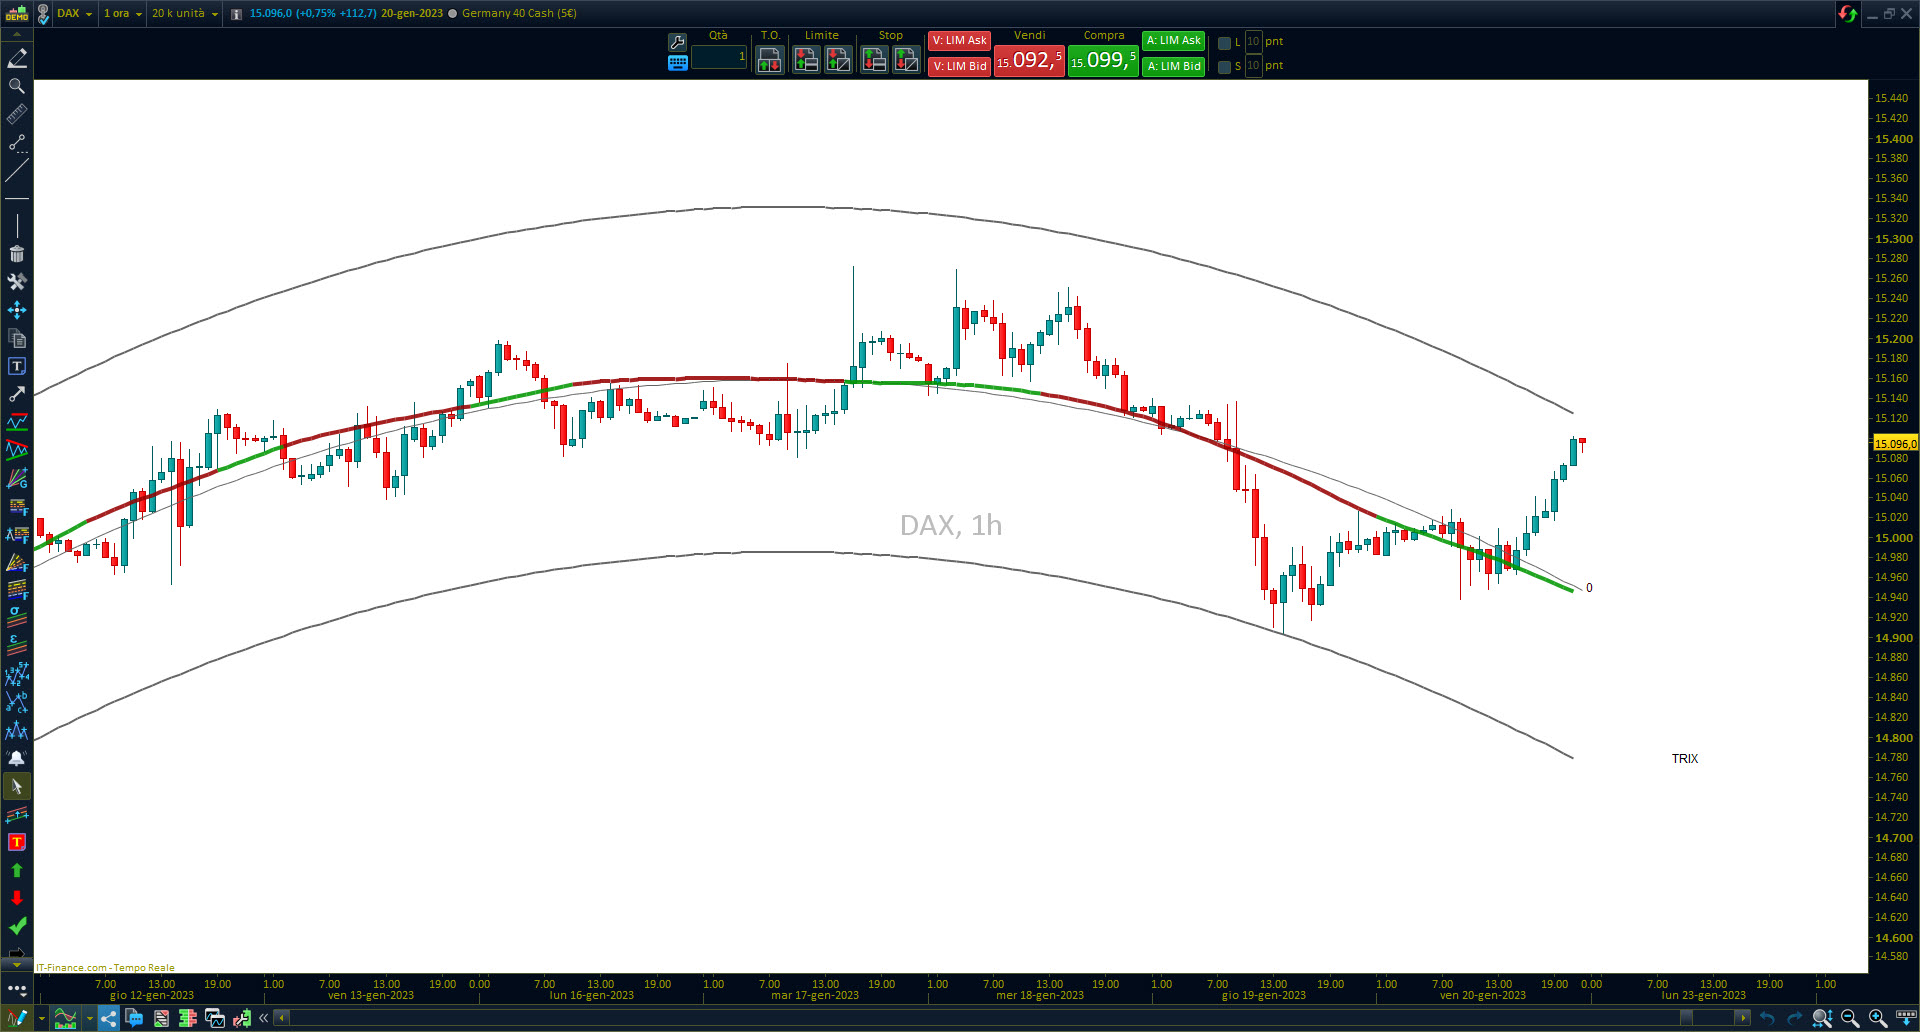
This indicator plot on price chart 11 oscillators, placing them in the polynomial regression channel. In the interface you can set the periods of each oscillator, select different colors to customize and optimize the graphics, and select the order of the polynomial that forms the channel, being able to use it as a simple channel to view the market trend.
- Polynomial regression = 0
- Polynomial regression = 3
- Polynomial regression = 5
- Polynomial regression = 7
Oscillators applied to the regression polynomial channel
- RSI
- CCI
- ROC
- STO
- MACD
- MOM
- ADX
- TRIX
- WIL%
- SMI
- Universal oscillator
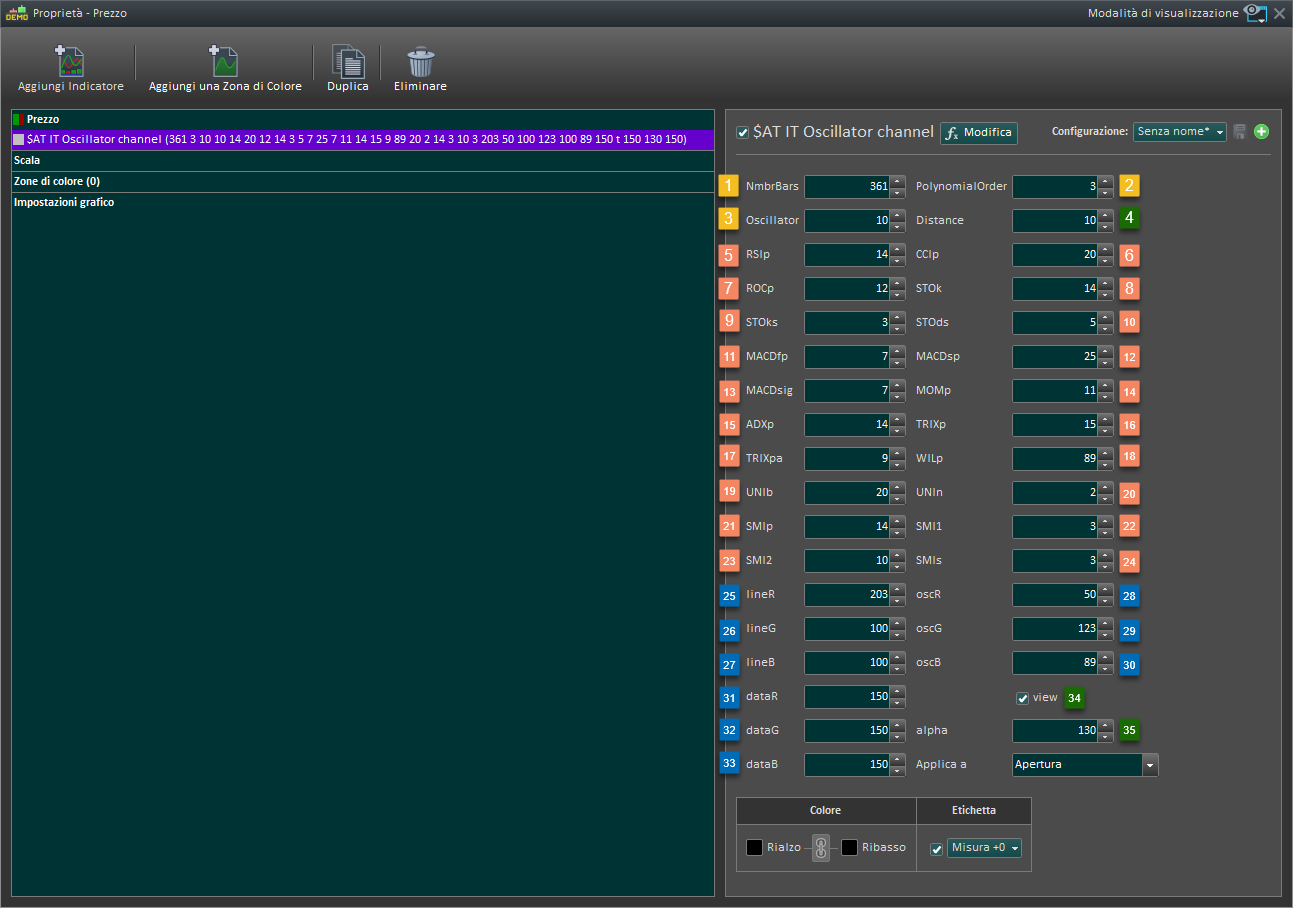
SETTING INTERFACE:
- NmbrBars: Number of bars of the channel
- PolynomialOrder: Polynomial order
- Oscillator: From 1 to 11 to select type of oscillator
- Discance: To move on the right data texts
- RSIp: Period of Relative strenght index
- CCIp: Period of Commodity channel index
- ROCp: Period of Rate of Change
- STOk: Period of stocasthic
- STOks: Period of moving average %K
- STOds: Period of moving average %D
- MACDfp: Period exponential average 1
- MACDsp: Period exponential average 2
- MACDsig: Period of signal
- MOMp: Period of Momentum
- ADXp: Period of ADX
- TRIXp: Period of TRIX
- TRIXpa: Period moving average
- WILp: Period of William%
- UNIb: Period of Bandedge
- UNIn: Period of Noise
- SMIp: Period of SMI
- SMI1: Period of fast exponential average
- SMI2: Period of slow exponential average
- SMIs: Period of signal
- lineR: Red color for channel lines
- lineG: Green color for channel lines
- lineB: Blue color for channel lines
- OscR: Red color for oscillator lines
- OscG: Green color for oscillator lines
- OscB: Blue color for oscillator lines
- DataR: Red color for data texts
- DataG: Green color for data texts
- DataB: Blue color for data texts
- View: Colors for universal channel
- Alpha: Trasparency of lines
USE IT AS A DYNAMIC CHANNEL:
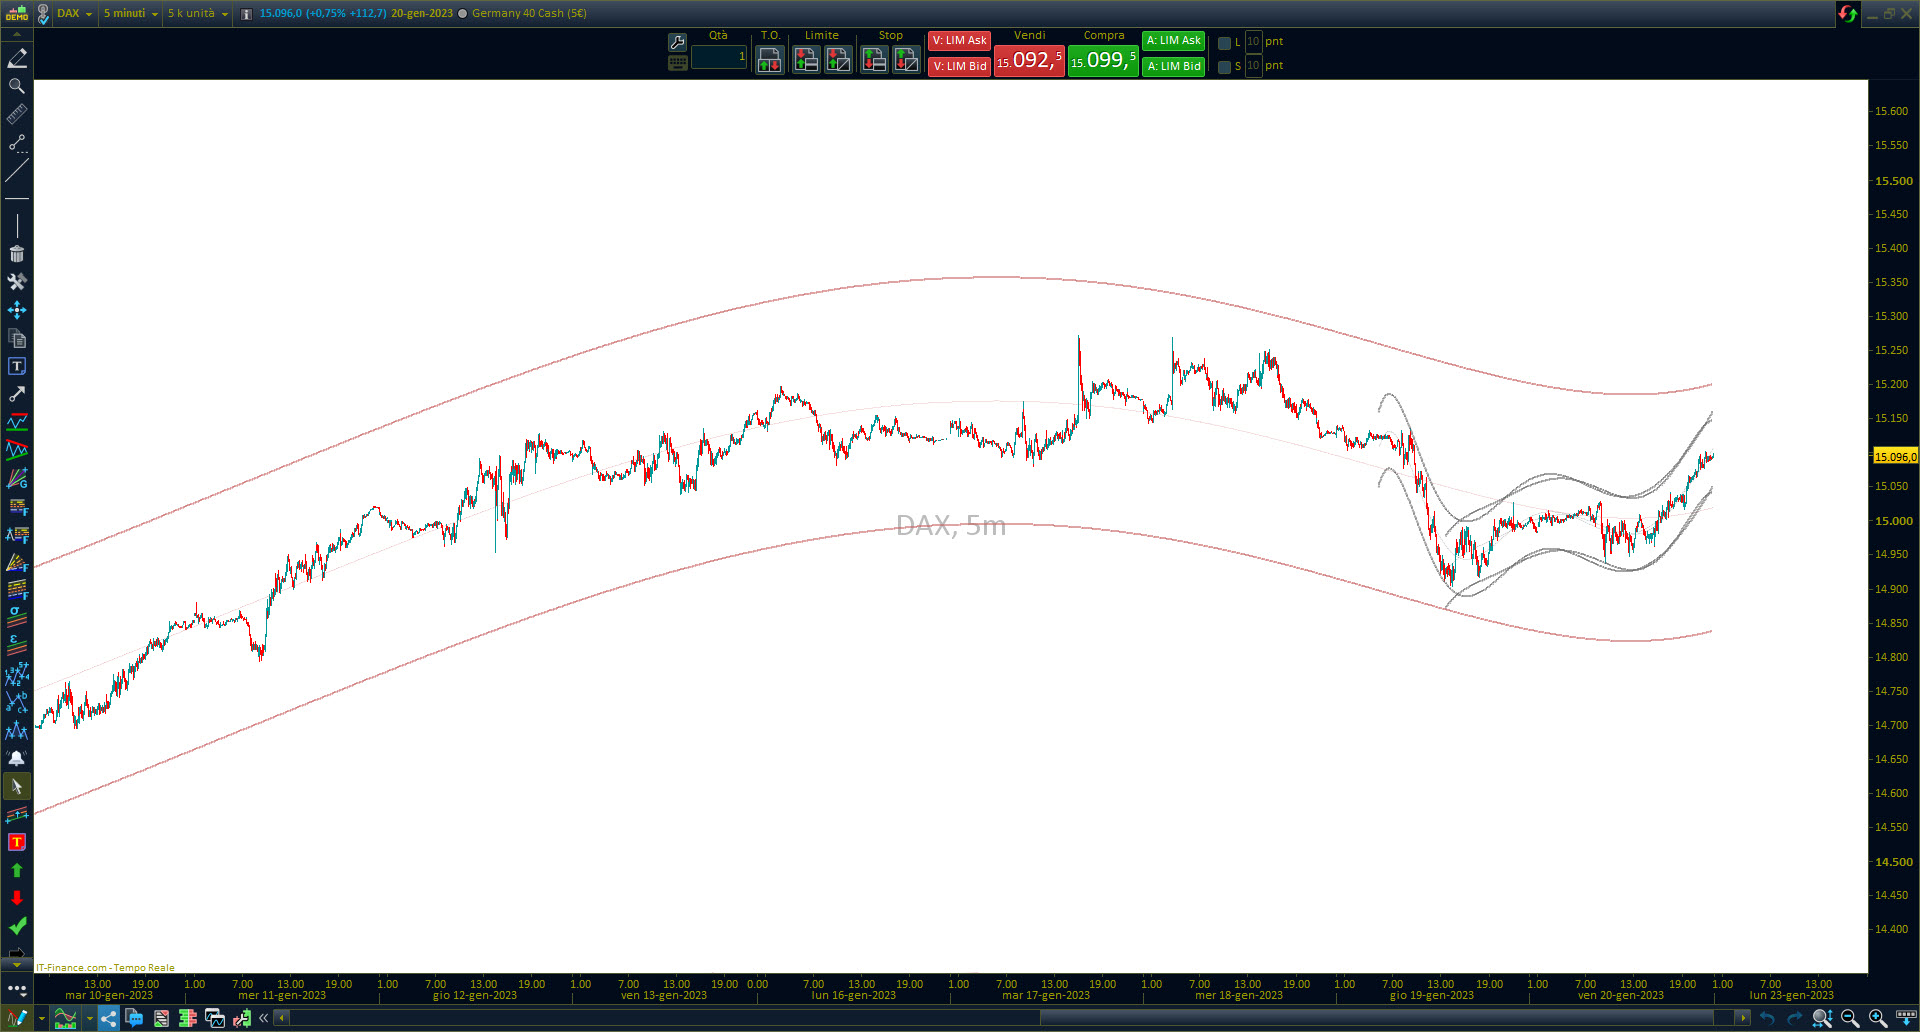
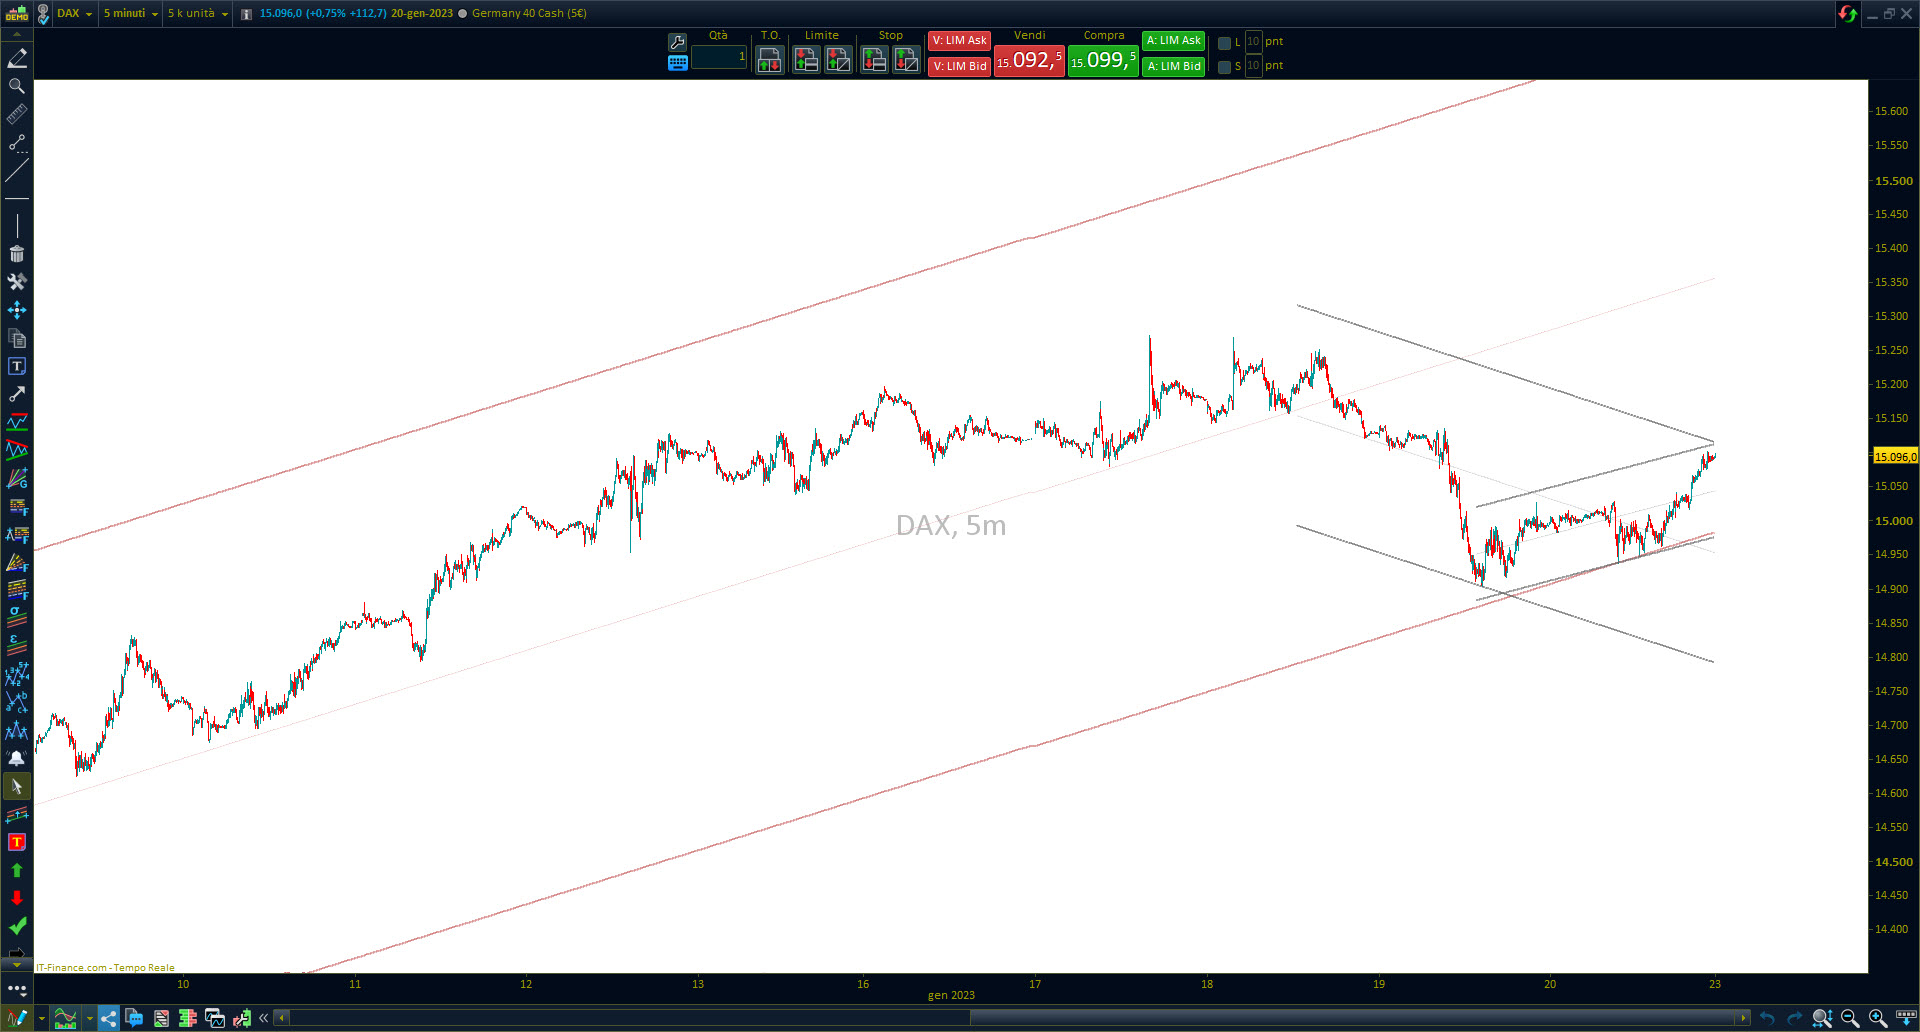
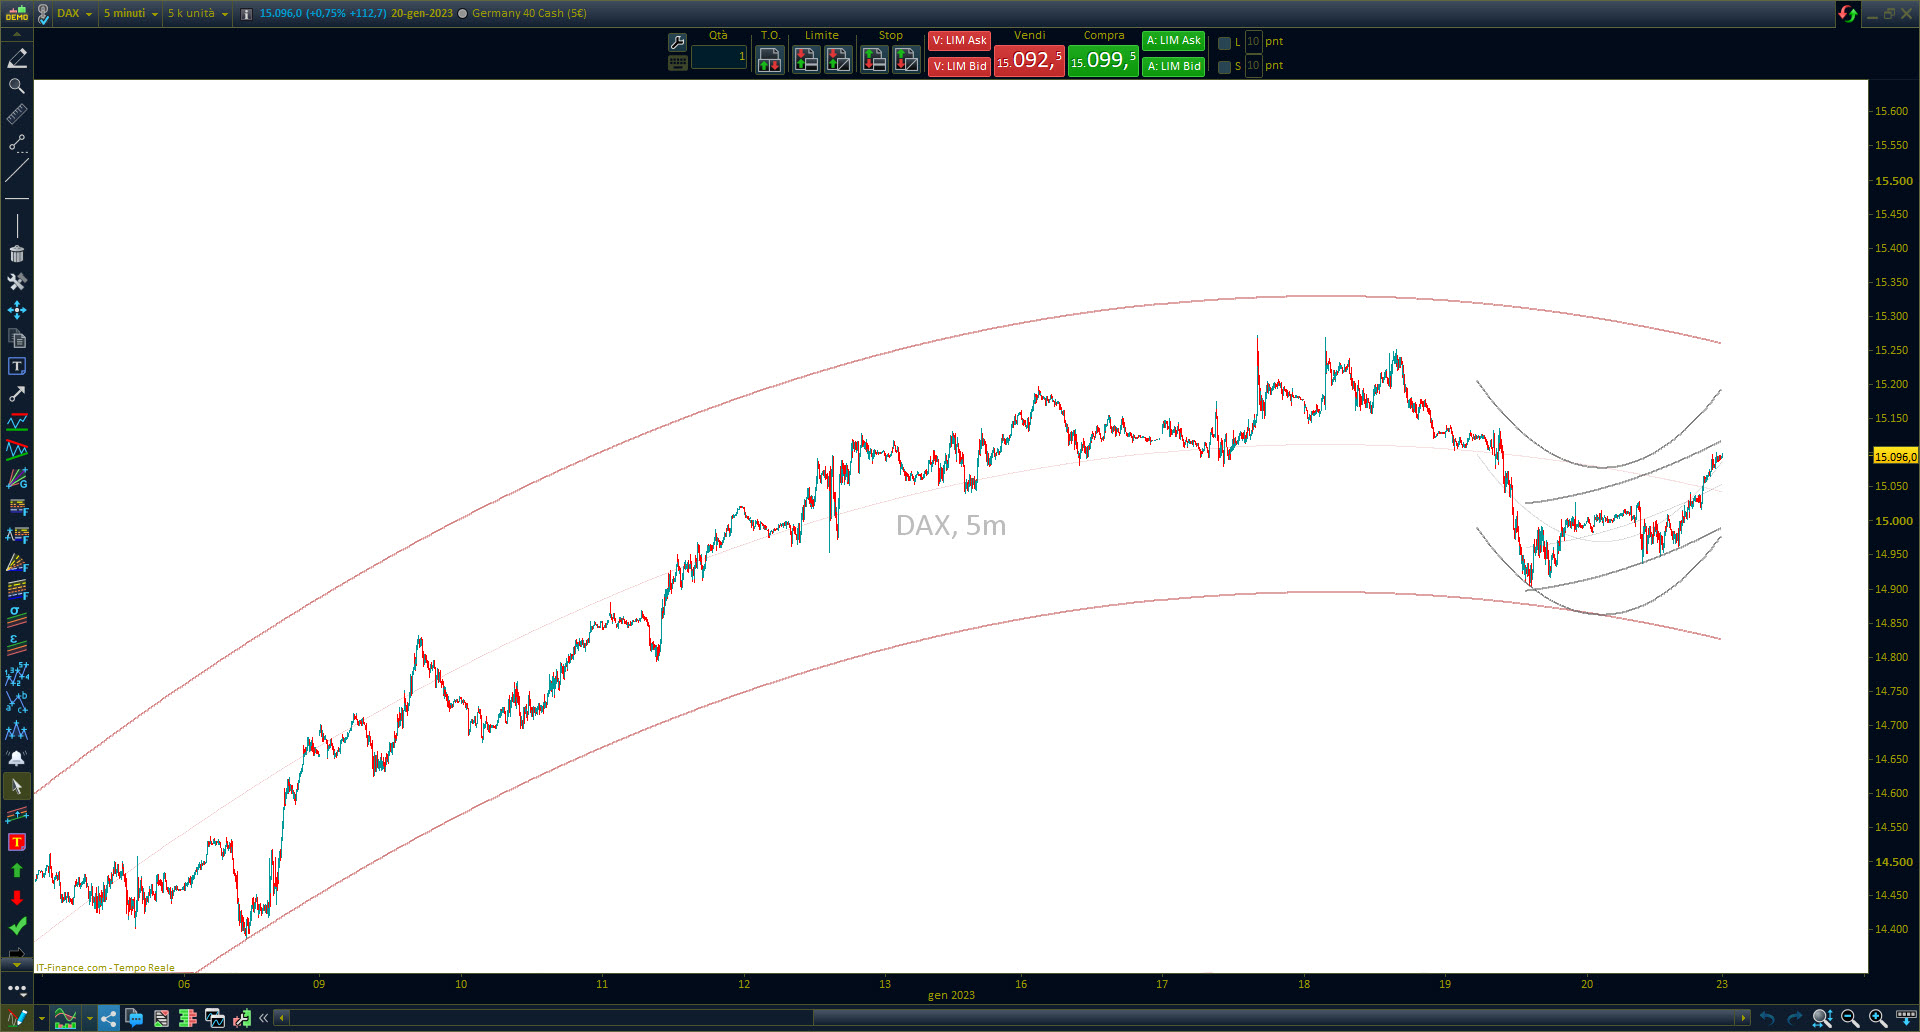
In this example the indicator is applied 3 times on the chart, the historical period has three values. In images 2 and 3 the period of the polynomial varies.
- 1
- 2
- 3
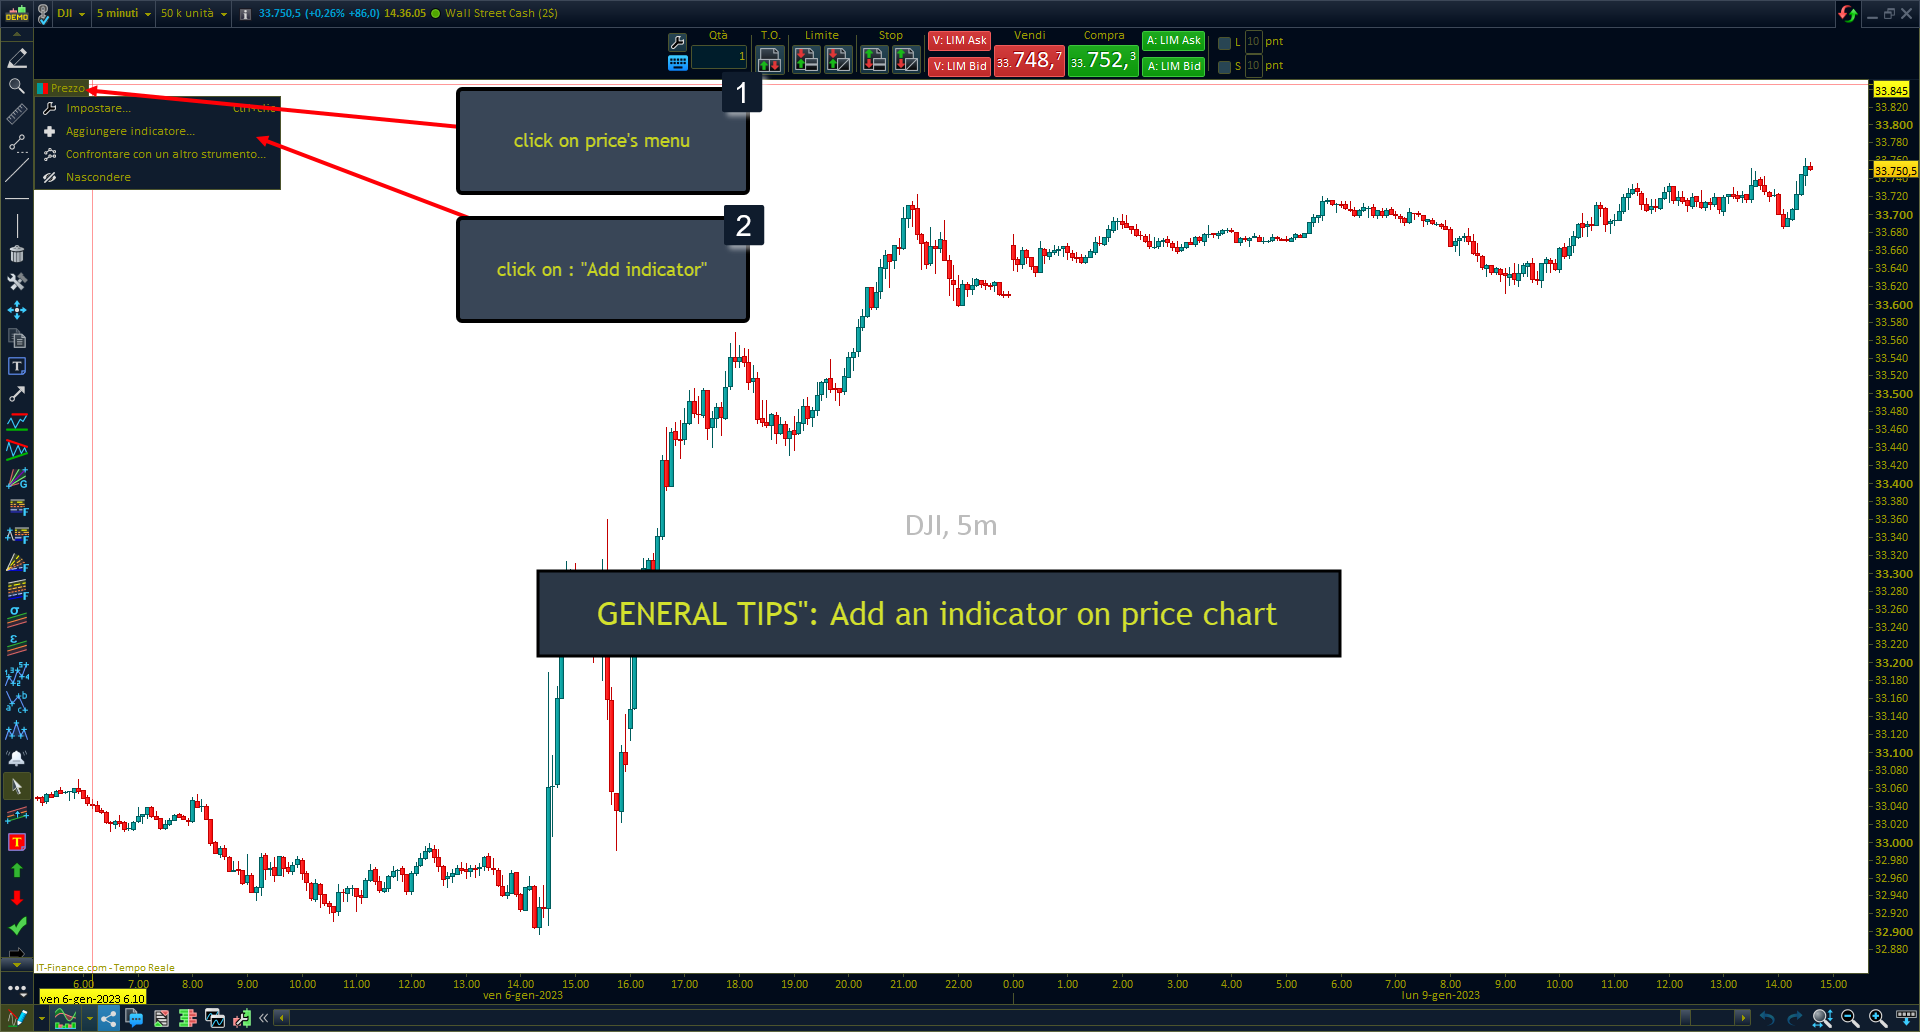
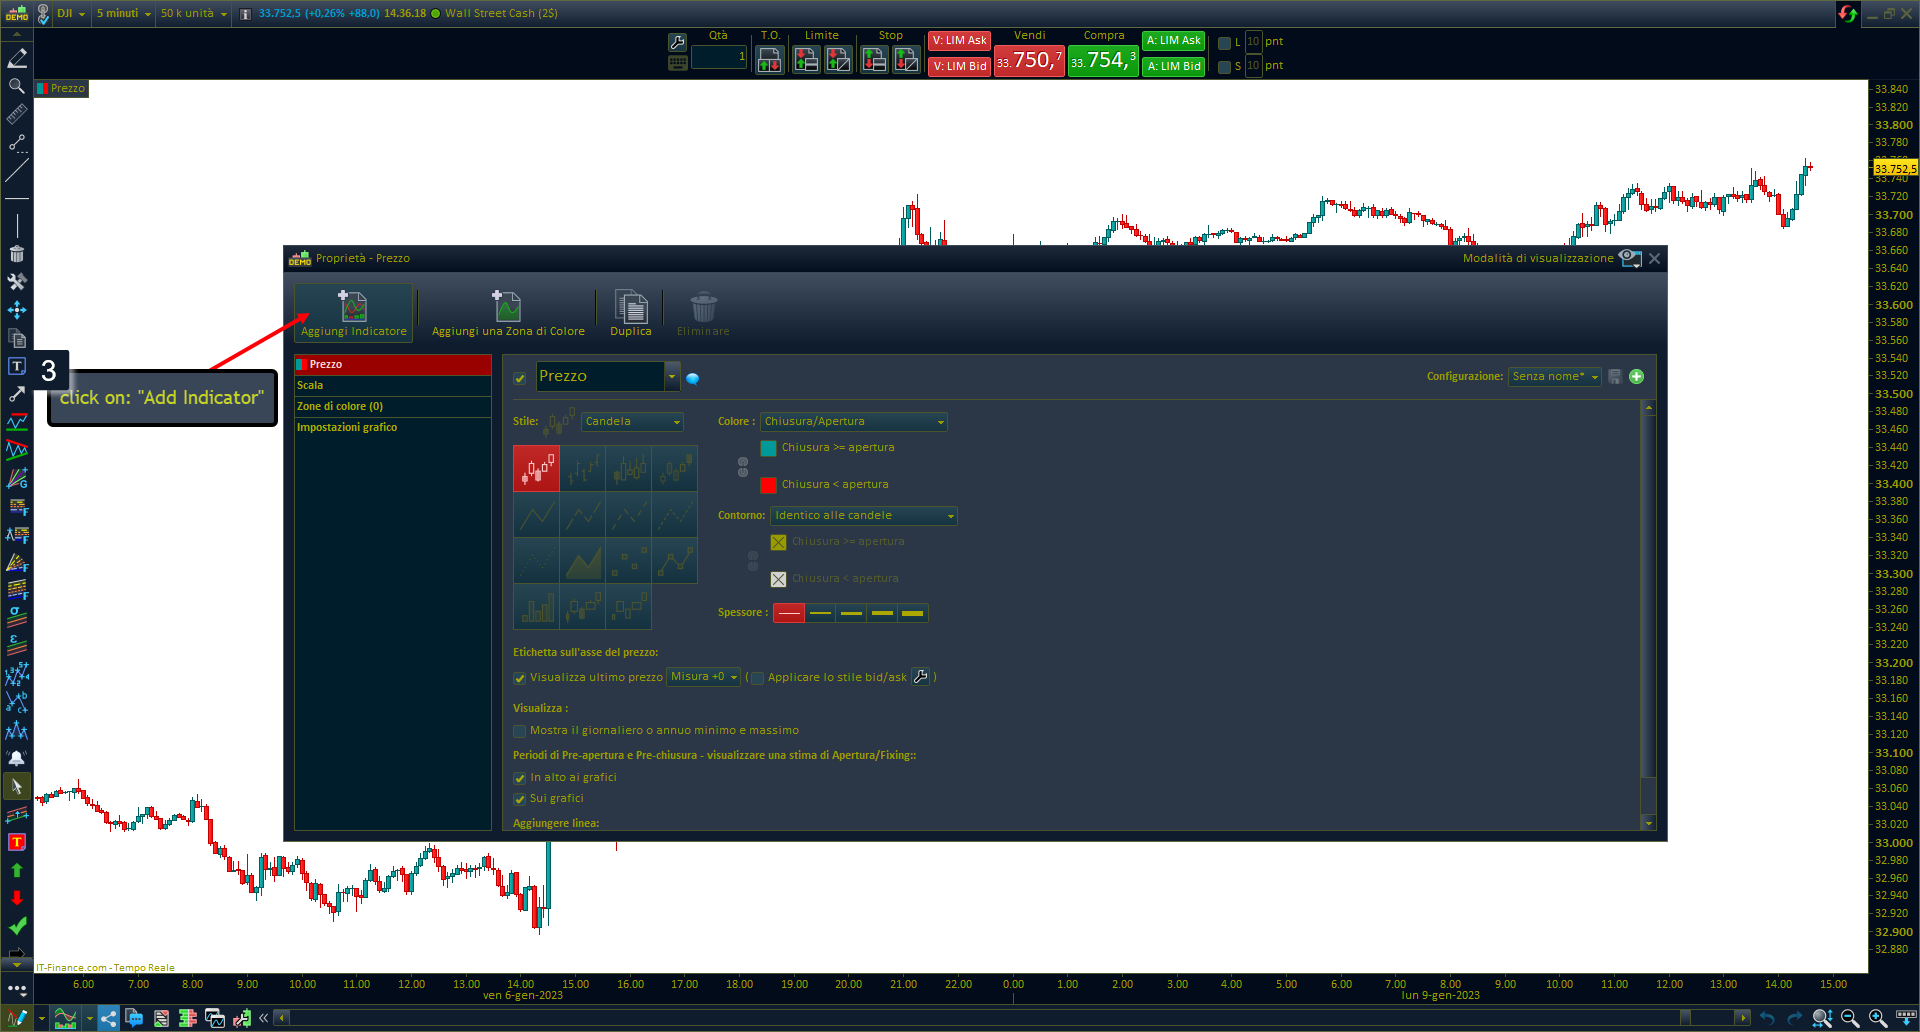
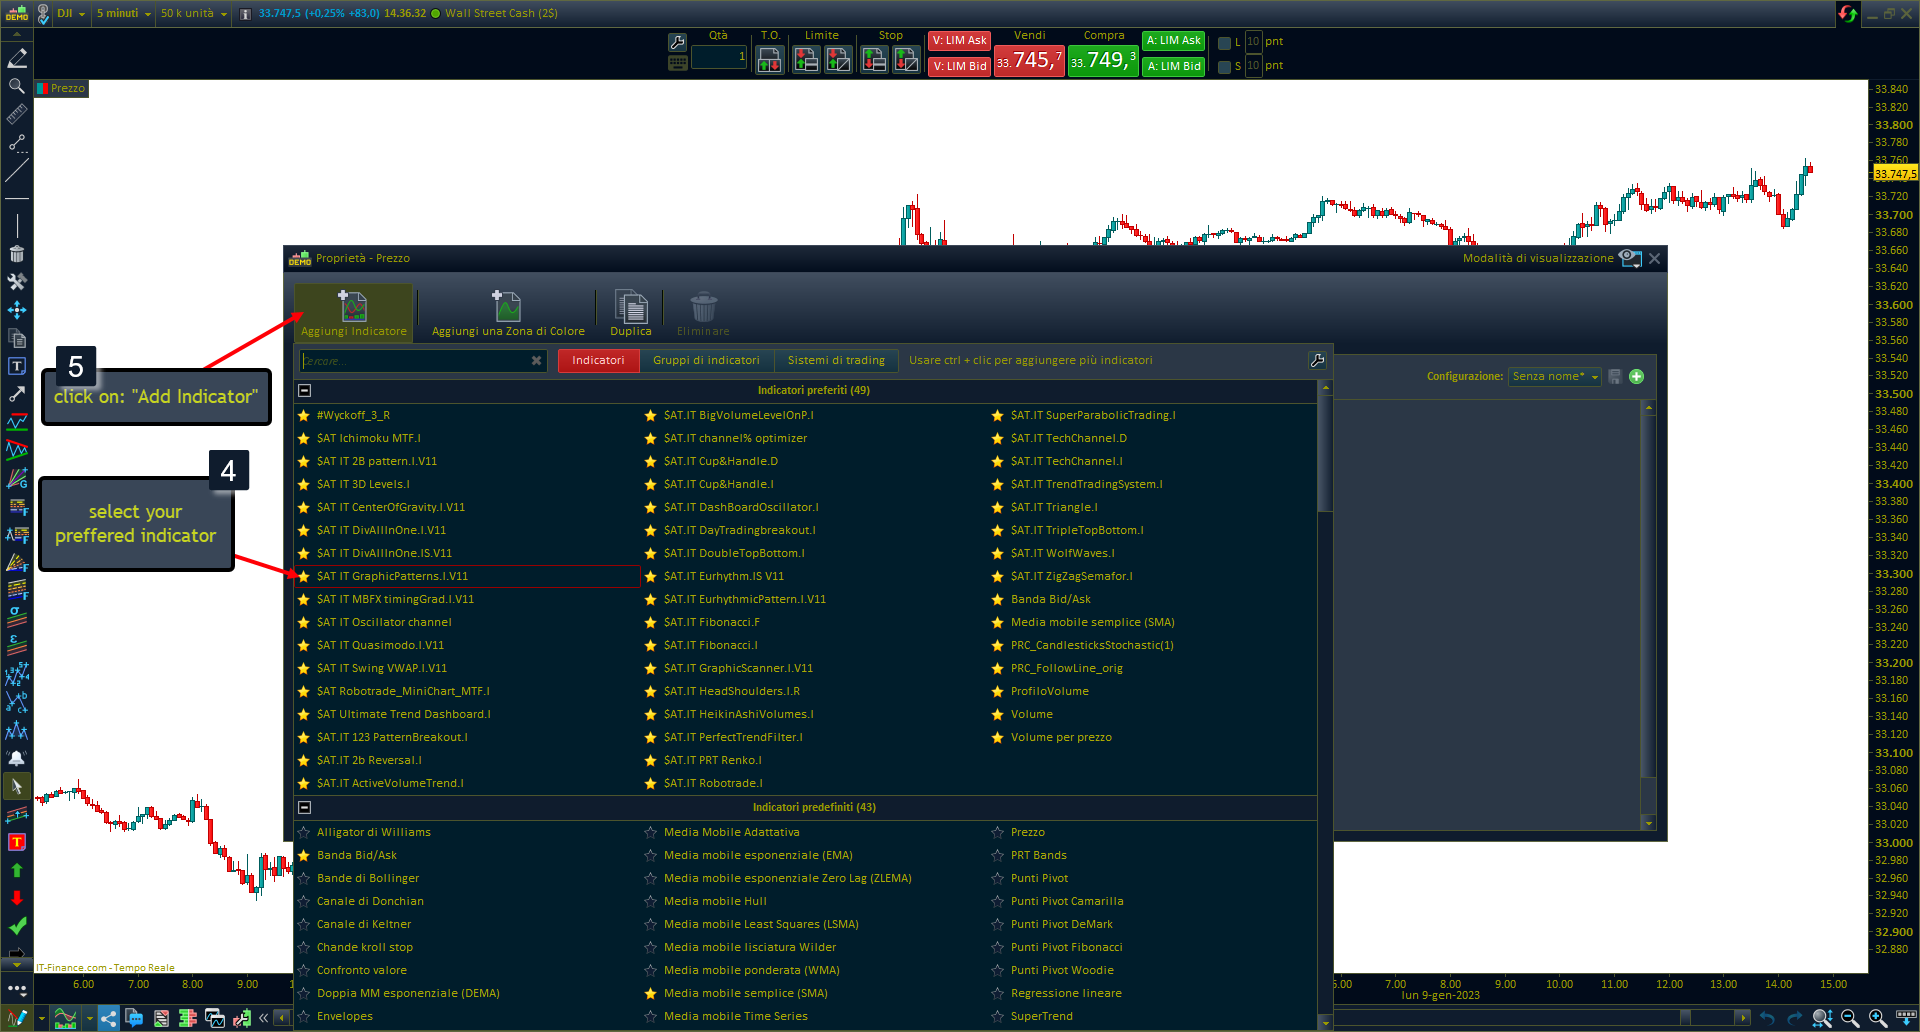
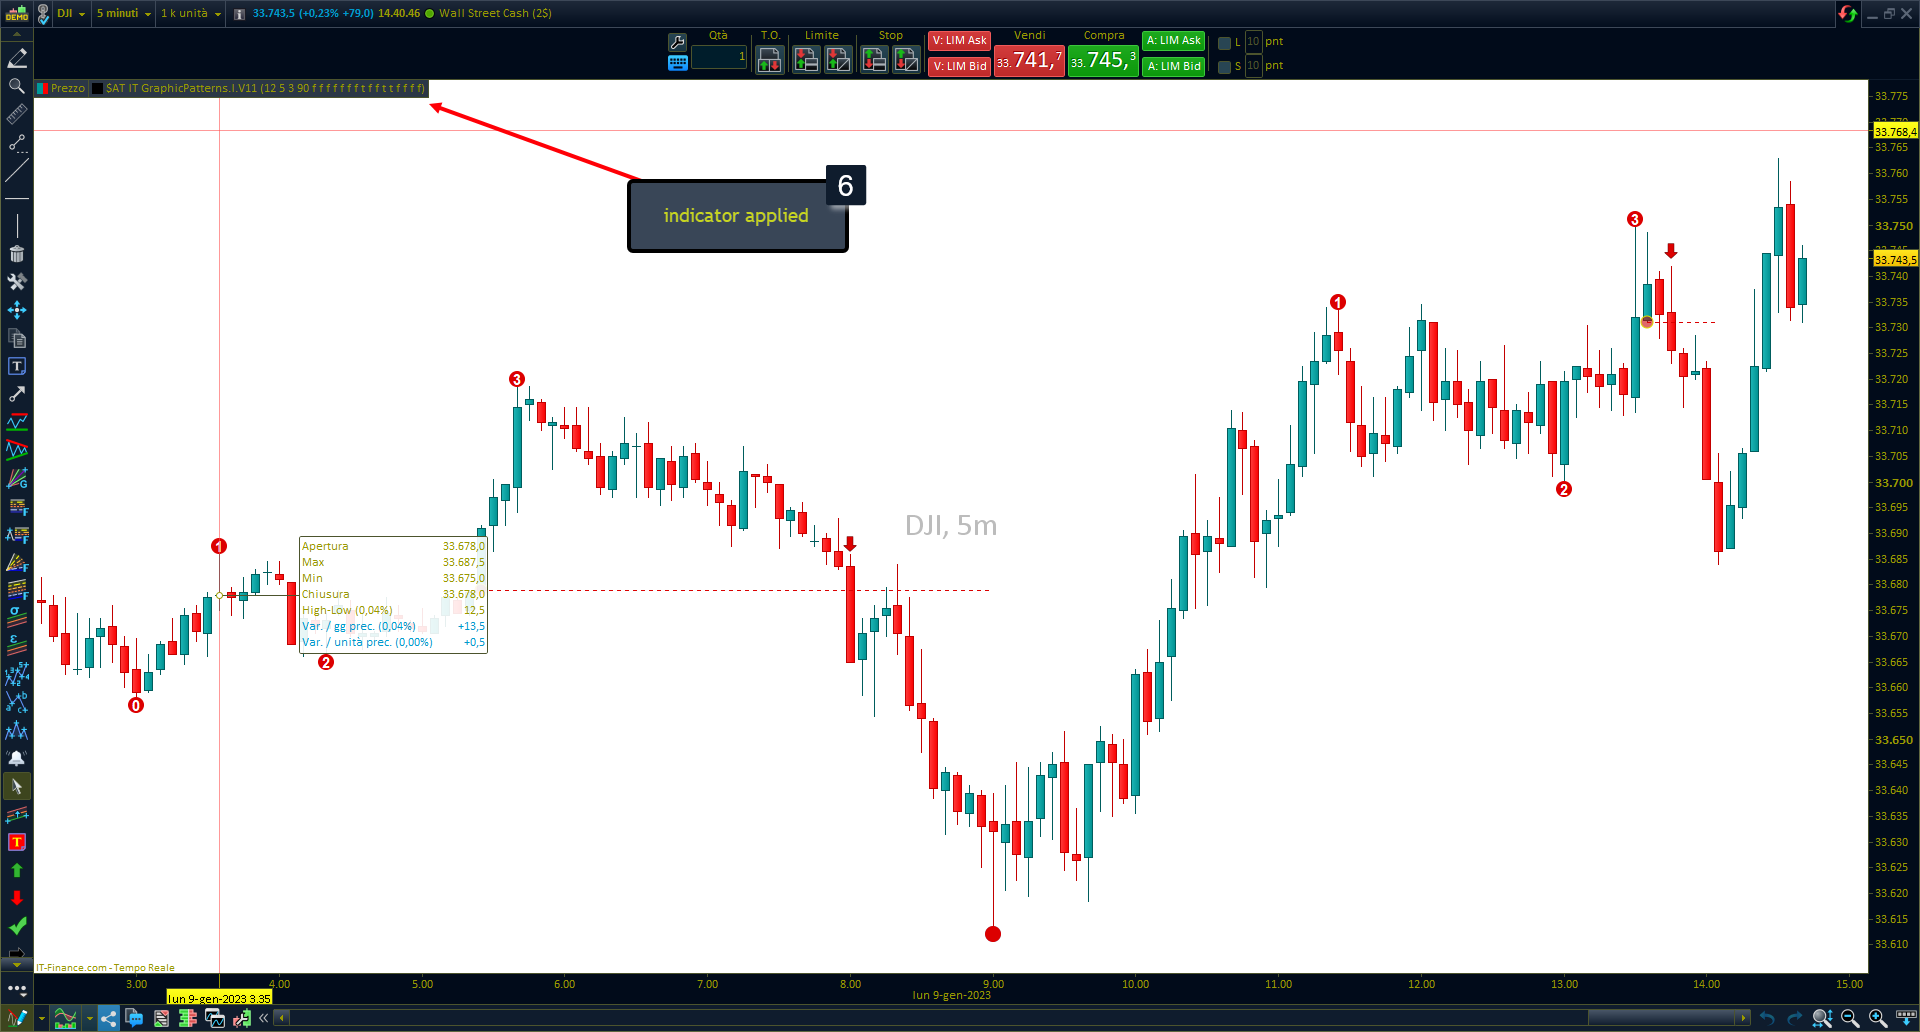
HOW TO ADD INDICATOR ON PRICE CHART:
- Add indicator on price chart
- Add indicator on price chart
- Add indicator on price chart
- Add indicator on price chart
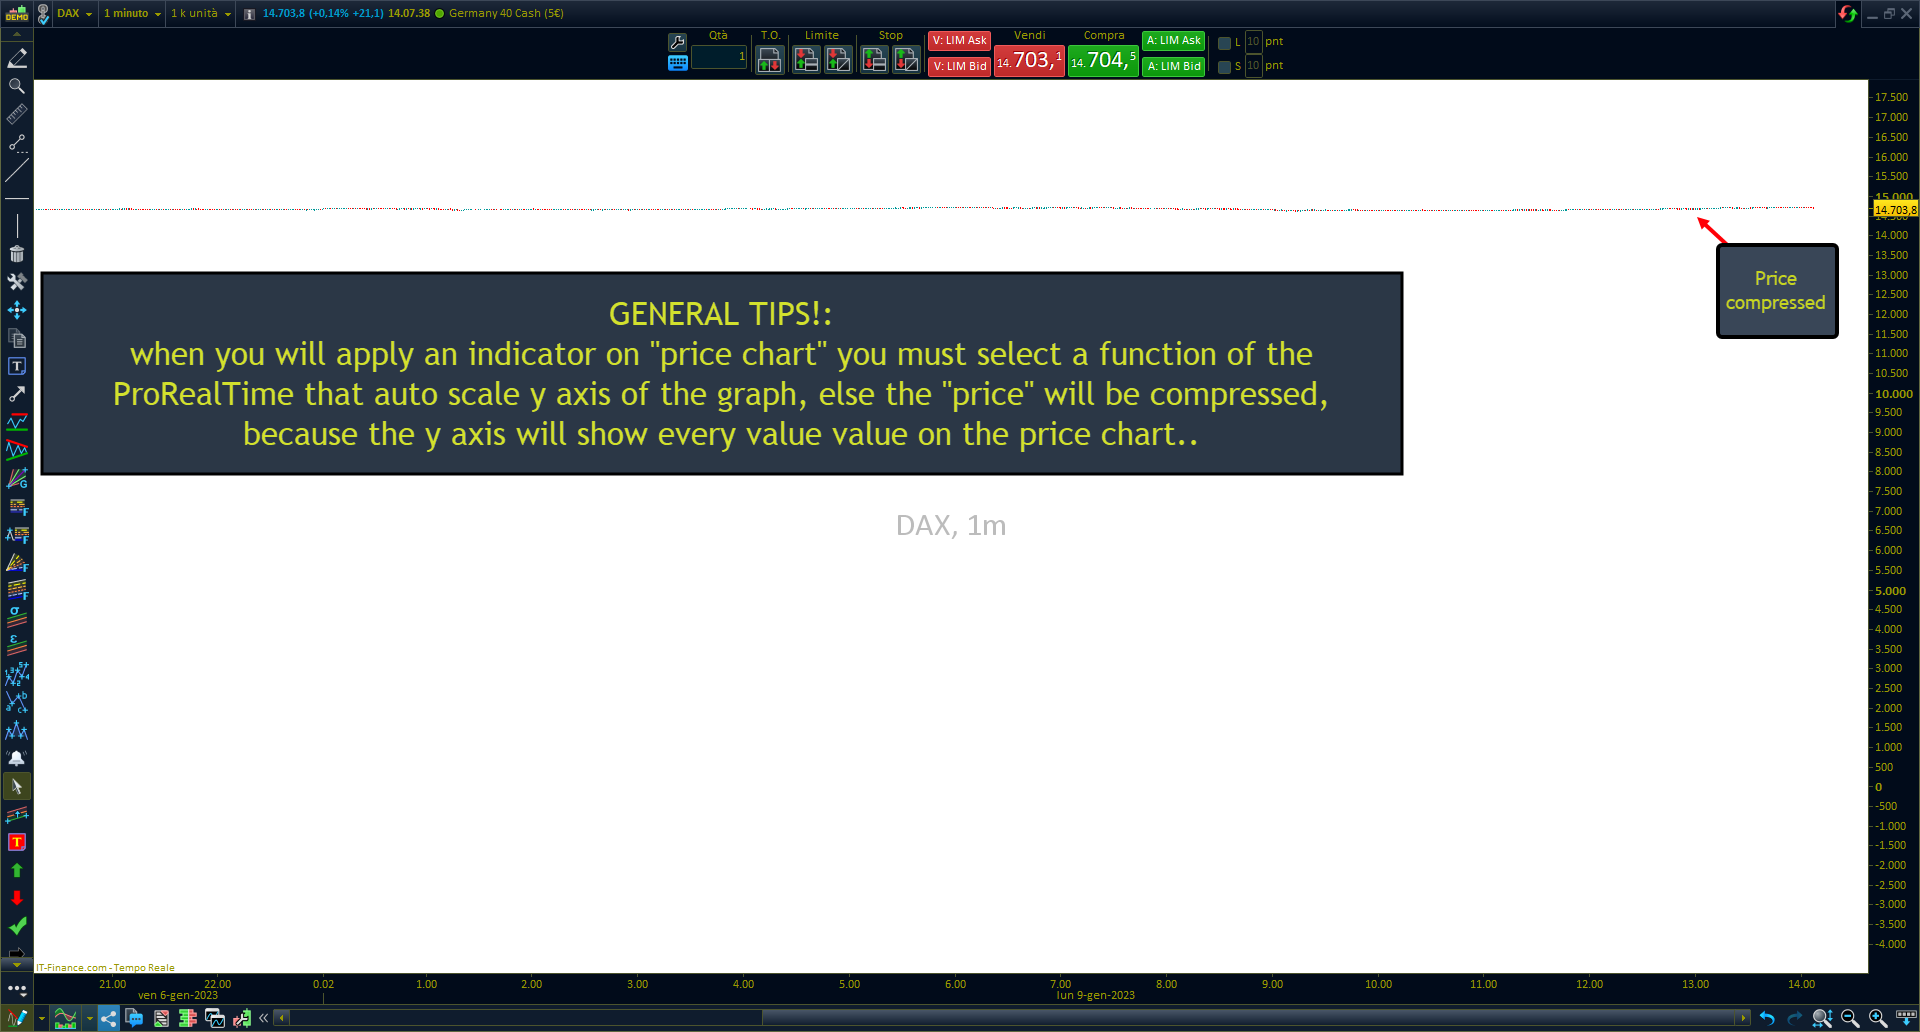
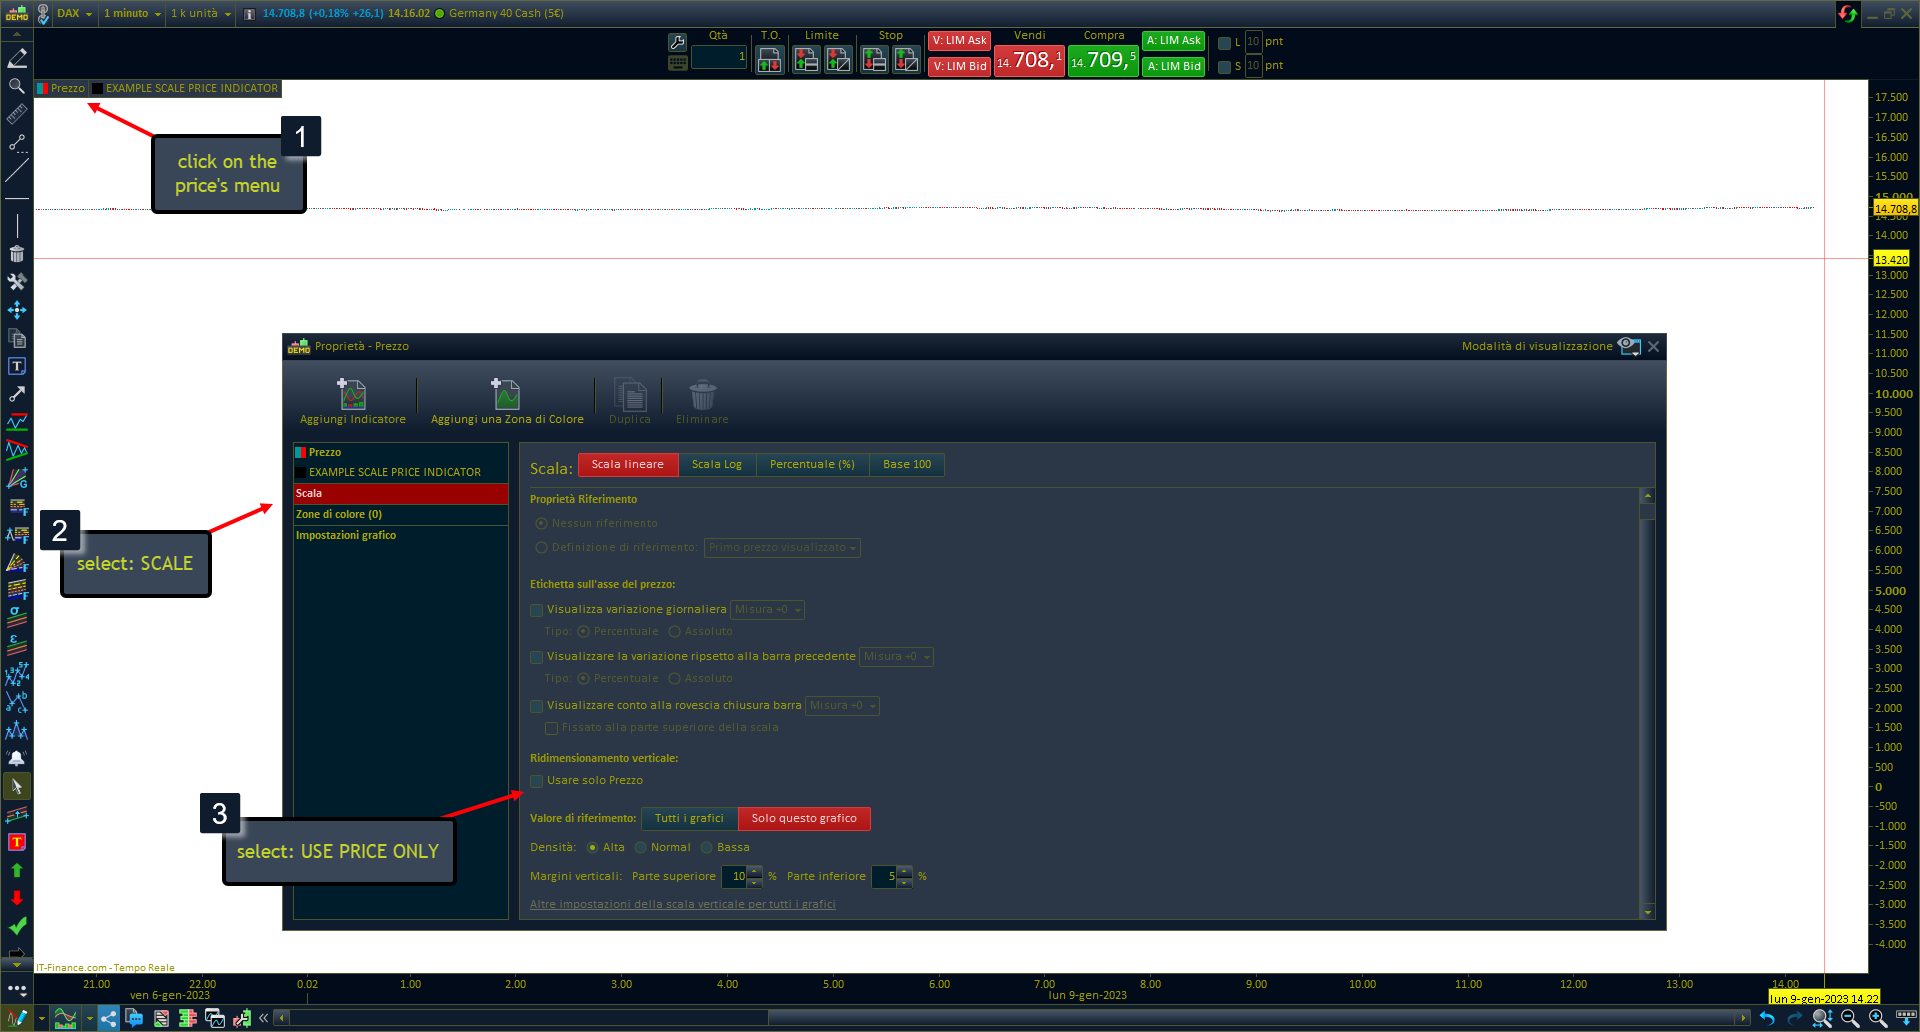
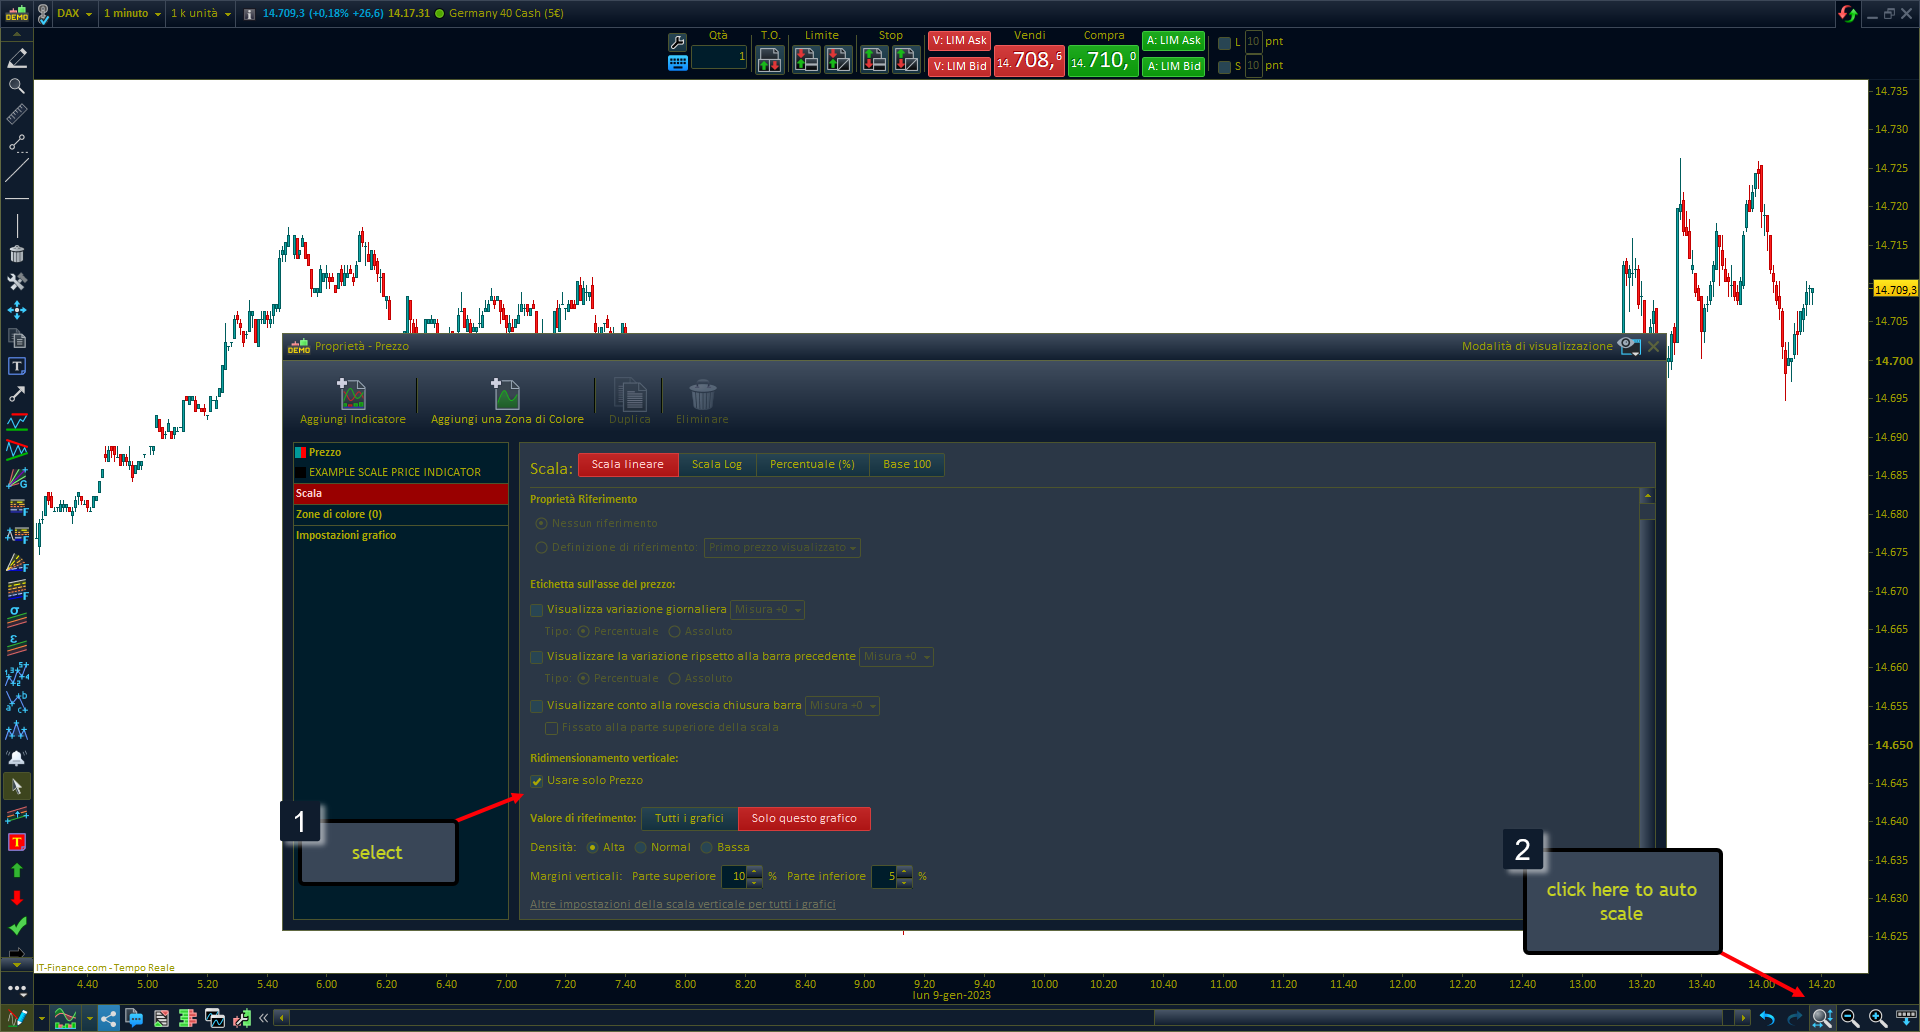
HOW TO SET SCALE OF PRICECHART:
- Set scale of price chart
- Set scale of price chart
- Set scale of price chart
How can “Oscillator channel “helps you?
You can finally compare the movements of the oscillator with the price
With just 1 indicator you can quickly view the status of different oscillators without having to keep them under the chart.
You can easily see any kind of divergence overlaid on the price.
You can use the channel and linear regression to evaluate the possibility of price reversal towards the center of gravity (center line of the channel)







Reviews
There are no reviews yet.