

 INSTALACIÓN

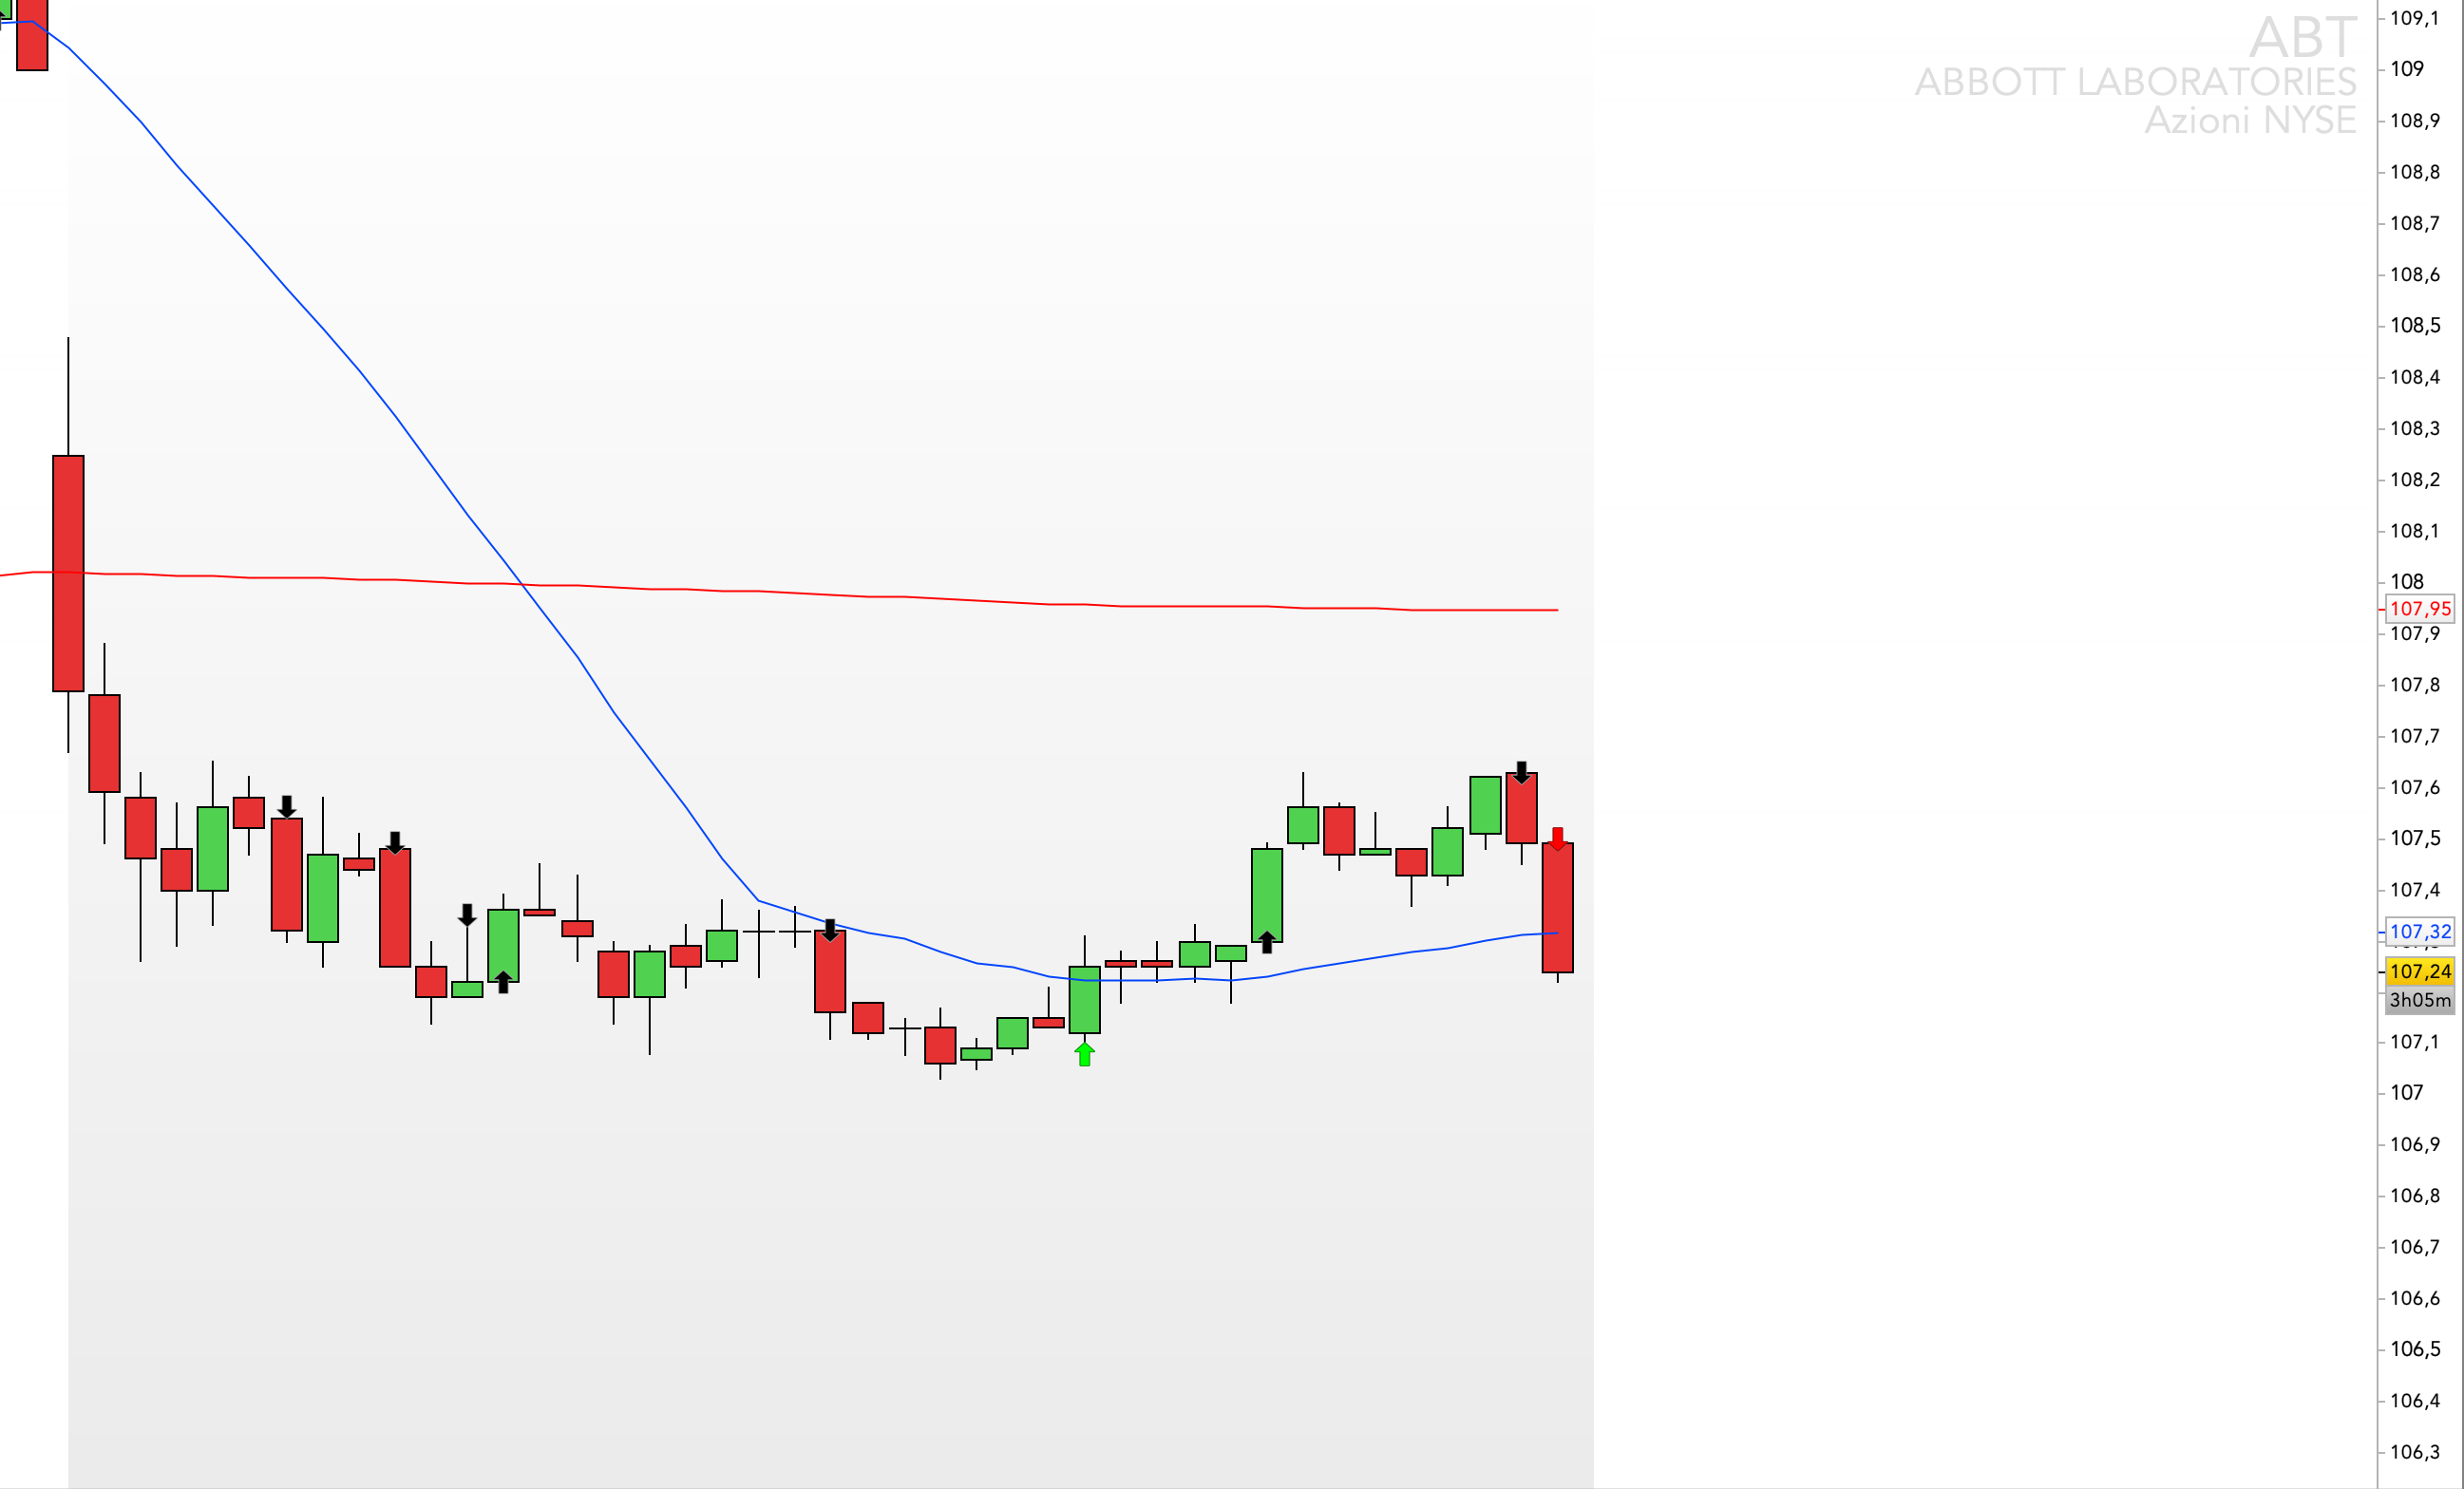

The screener scans a market or a list for the four major actionable events in trading (by Oliver Velez) that should make up the core of all trading activity.
These four events represent the majority of trading opportunities in the market. Here’s a summary:
- Elephant Bar: This represents about 65% of all trades in the market. There are different versions of Elephant Bars, but the majority of trades stem from some version of an Elephant Bar. The speaker emphasizes that traders can make their entire living in the markets just based on Elephant Bars.
- Tail Bar: There are different versions of a Tail Bar as well. The speaker focuses on the main one where you have a green top. A Tail Bar is not just any bar with a wick on it. A Tail Bar is more special. It’s a bar where the tail represents about 85% of the entire bar.
- Bull/Bear 180: This is where you have a Red Elephant Bar immediately reversed by an even bigger, more powerful Green Elephant Bar. This is considered the quintessential Bull 180.
- Red/Green Bar Ignored (RBI): This is when you have one Red Bar that immediately gets ignored. The quintessential RBI is when you have strength to the left that immediately experiences a pause, but the pause is small. The best is when that pause is in the upper portion of the strength to the left of it.
Please refer to the following video to get more insights and knowledge about these events:
https://youtu.be/fXyfhLBFpME?list=LL
Screener features:
The screener works on any timeframe. It is suggested to be used on a 2 min for day trading.
Once launched, it returns the list of stocks that are showing one of the events that is developing with the last candle.
In order to distinguish which event is developing, I added a “SIG” criteria that has to be read as following:
- “999999”: Supervent, that means the best opportunity, which is one of the four events that is additionally surging from either the 20MA or the 200MA. (explained in the video)
- “999”: Good event: that means the best opportunity, which is one of the four events that is additionally near either the 20MA or the 200MA. (explained in the video)
- “666”: Elephant bar event
- “333”: Tailbar event
- “111”: RBI event
- “180”: Bull/Bear 180 event
Screener settings:
- POSITION: flag to scan only for previous events in a suitable location (near 20 MA or near200 MA in a bull trend or bear trend)
- FAB4: flag to scan only for signals that are out of the FAB4 area (the trap zone)
- TFALIGN: flag to scan only for signals that are aligned (either bullish or bearish setup) with higher timeframes (5 and/or 15 minutes)
Based on the event location, it is up to you to decide to enter the market long/short.


Valoraciones
No hay valoraciones aún.