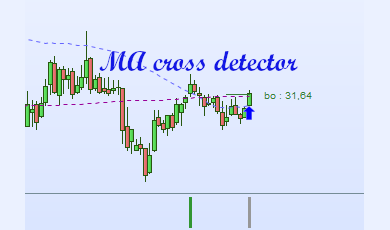
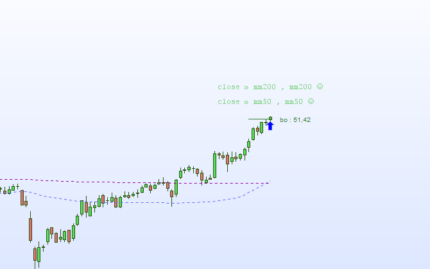
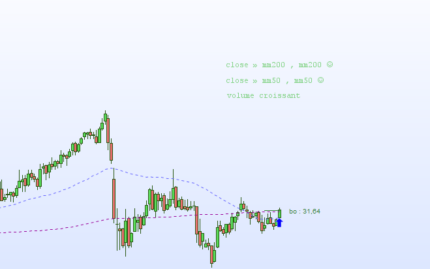
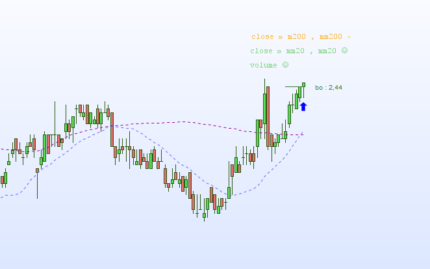
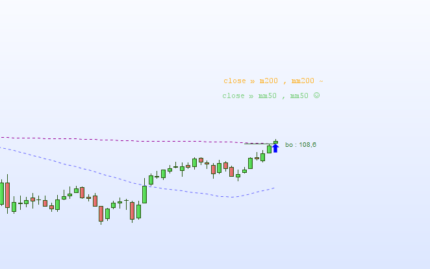
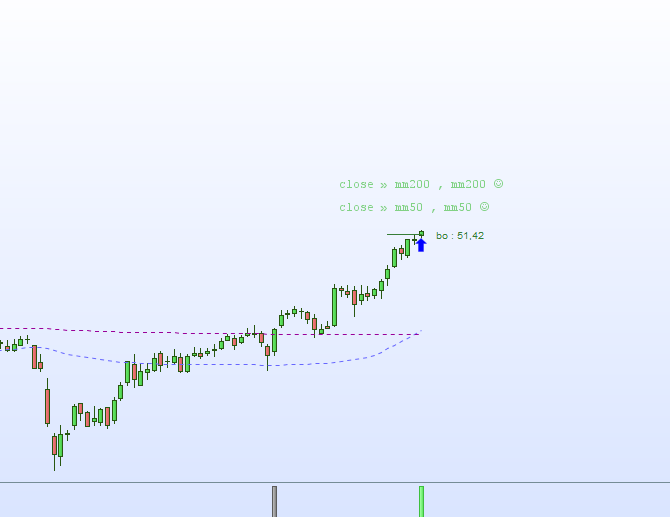
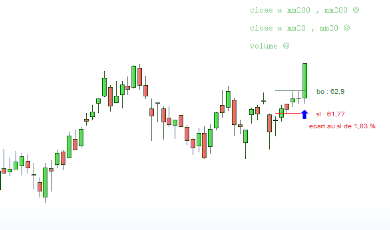
This indicator detects various configurations on a stock for trendfollowing.
- a gray bar indicates a price crossing the MA200 (WEEKLY timeframe).
- a green bar indicates a high signal on moving averages for trendfollowing.
- a lightgreen indicates a crossing of moving averages (MA200 and MA20 in DAILY timeframe / MA200 and MA50 in WEEKLY timeframe) for trendfollowing.
- a blue bar indicates a stock doing a retest after a detection.
Advantages :
- the indicator can be used in DAILY or WEEKLY timeframe, but the use in WEEKLY is more relevant.
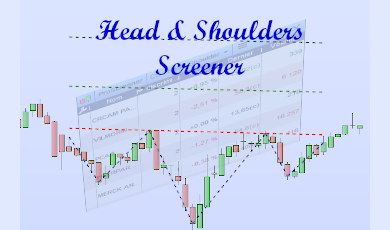
- a screener is available to detect stocks with these configurations.



Valoraciones
No hay valoraciones aún.