How the “Market Price” indicator works
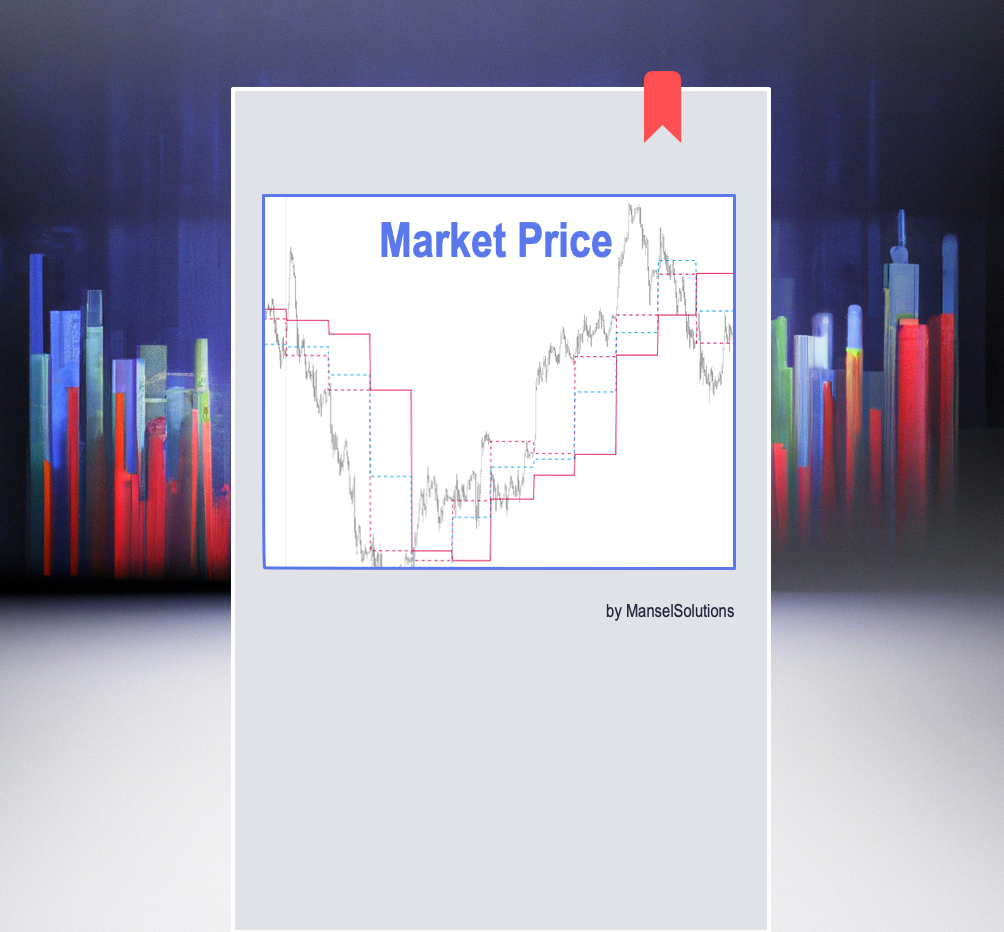
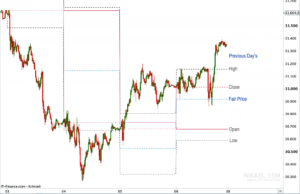
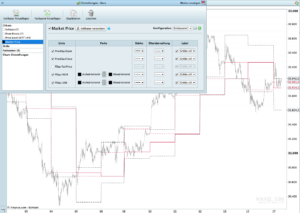
The “Market Price” indicator uses the main points of the previous day’s candle(s) to determine the current day’s POI’s (points of interest). As you can see, the price levels defined by the previous days have a great influence on today’s market movement. The indicator shows you the previous day’s opening/closing levels, the previous day’s highest and lowest prices, and the “fair price”, which depends of the previous day’s direction and is calculated considering the highs and lows.
How to trade the “Market Price” indicator
Try the “Market Price” indicator in 3M, 5M or even 15M time frame for daytrading. All you need to trade this indicator is a additional daycandle-timeframe, maybe with a trend view indicator like the Price Level indicator or pivot points and you will be surprised at how accurately you can determine entry and exit points for your trades.
the indicator with previous day’s open/close, fair price
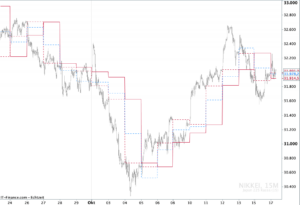
or with the highs/lows of the previous day
One more way
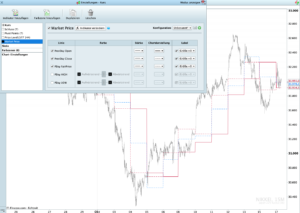
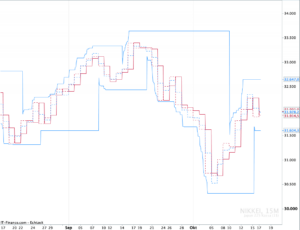
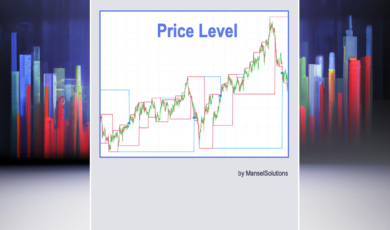
An another possibility to use the indicator is to hide the candle chart and use the drawing/structure of the indicator to determine and see clearly a higher level movement of the market. Here is an example combined with the Price Level indicator.
Remarks
Of course, the indicator’s calculation depends on the market open/close time – in markets with 24/7 trading hours is the previous day’s close the new day’s open at 0:00 time (change of day). So the indicator’s calculation depends on this fact and on your time zone also.
Terms and Conditions
Please note our general terms and conditions.
These are accepted by you when purchasing our products




Bewertungen
Es gibt noch keine Bewertungen.