40
Compatible desde

Favoritos:1   Vistas:565   Reseñas:0  

At a glance, monitor any asset !

Perfect for intraday traders

Compatible with cfd / Futur / Crypto…


Category: Etiquetas: ,
Report Abuse

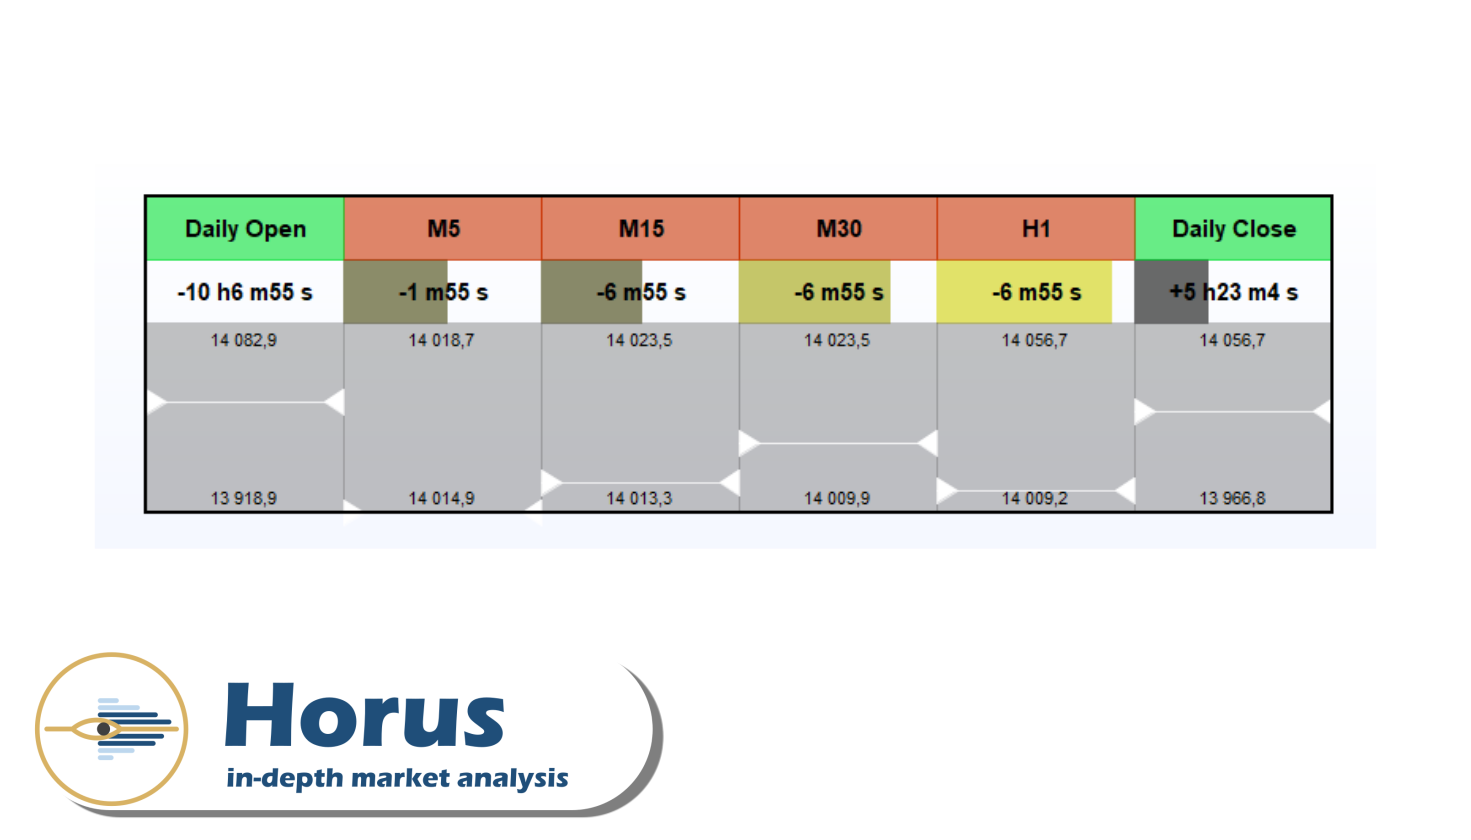
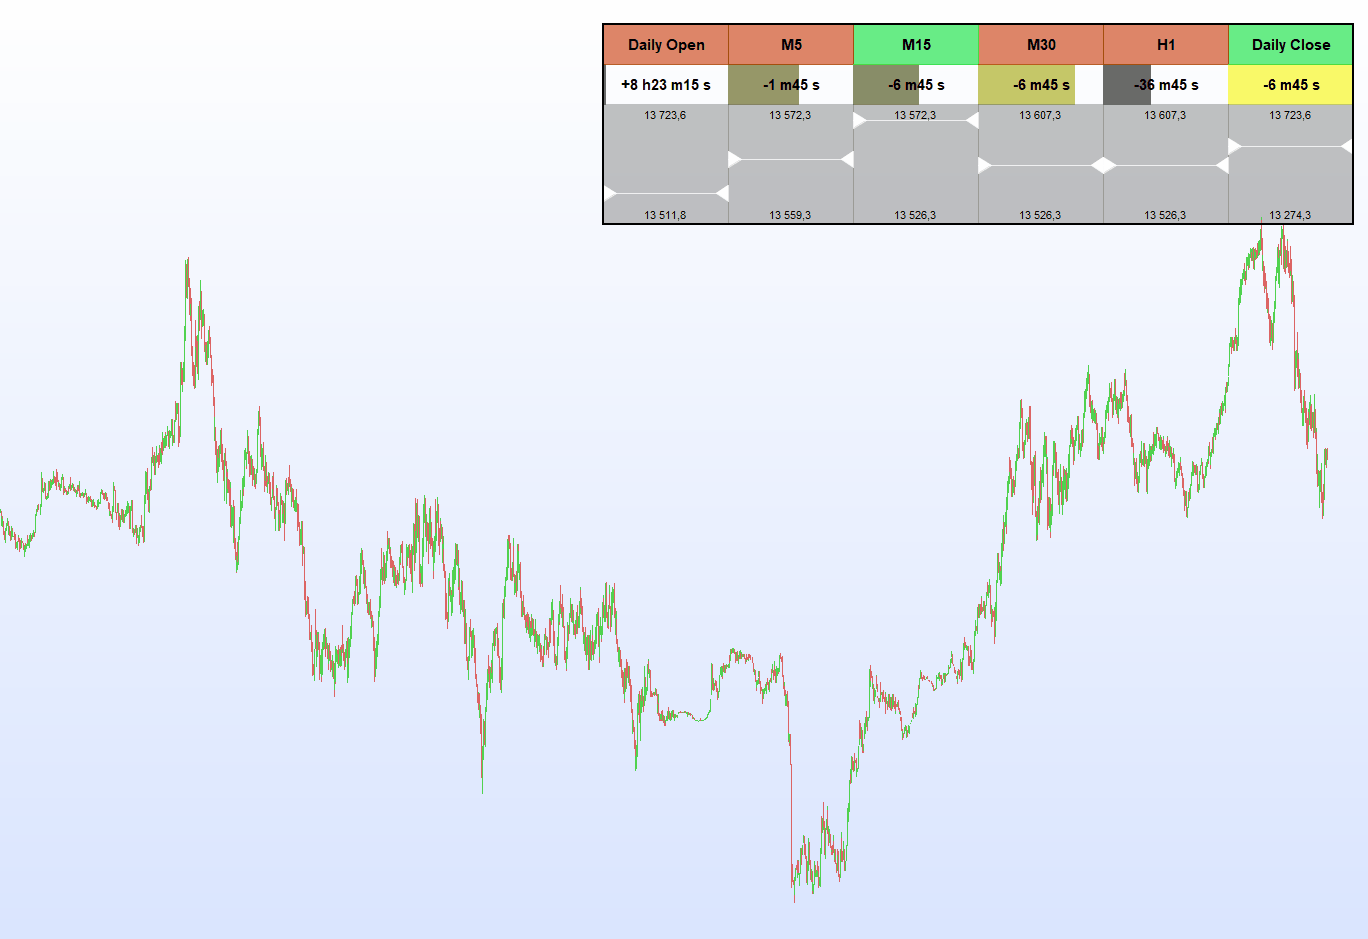
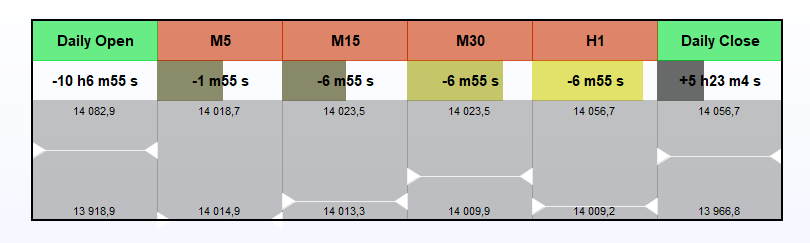
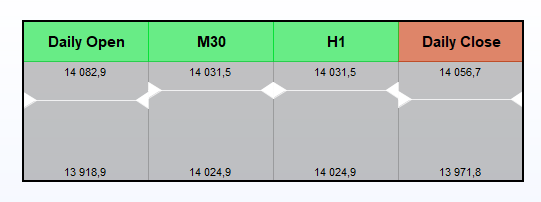
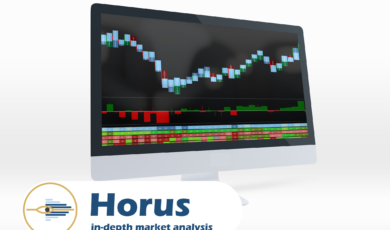
The first row shows if the current price is below or above the open of every time frame.

The second row shows the time remaining before the next close.

The third row shows the position of the current price between the high and low of every time frame.


You can select each time frame and each row you want to display.

Valoraciones

No hay valoraciones aún.

Solo los usuarios registrados que hayan comprado este producto pueden hacer una valoración.

Solicitud de información

Your personal data will be used to support your experience throughout this website, to manage access to your account, and for other purposes described in our política de privacidad

Más artículos por Horus

Product Image

Horus – Candle / Brick

Display higher time frame candle and moving average on any chart (eg: tick)

40

7

Product Image

Horus – FootPrint

The perfect combination between price and volumes.

310

4

Product Image

Horus – Mega Bundle – All Our Premium Indicators – limited offer

Get access to all of Horus' premium indicators for just €350

350

1

¡Listo para unirse a nuestro mercado trading!
Además de 1,000,000 los clientes potenciales necesitan productos trading de calidad profesional
Únase a nosotros hoy mismo