There is a very old debate in the statisticians world : why do we still use the standard deviation (SD) nowadays ?
Historically, before the age of computers, SD was saluted for his nice algebraic properties, while the mean absolute deviation (MAD) was considered “clumpsy”, difficult to compute and not “academic-friendly”. This “social inertia” contributes to keep old tools and concepts in the practices of statisticians. Moreover, SD suffers from a major flaw : it is NOT relevant to non-normal distributions. Outliers are “square weighted” in the computation process and impact negatively the following computation (error propagation).
If this historical debate interests you, I suggest you to read the excellent paper from Stephen Gorard (York University) published in the British Journal of Educational Studies, vol. 53, no. 4, from december 2005. You can find an online copy of this article here : Revisiting a 90-Year-Old Debate: The Advantages of the Mean Deviation (emilkirkegaard.dk)
We propose here a new tool based on the ideas of this paper. By using the Mean Absolute Deviation we benefits from very nice properties :
- Does not fundamentaly assumes a normal distribution (Market prices are non-normal by nature)
- Equal treatment of outliers
- No distortion implied by the square/square root computation
- Error propagation-free
- Intuitive and simple perception : we simply measure the average distance between points and their average
- the MAD is know to be a robust statistics metric, proven on real word data
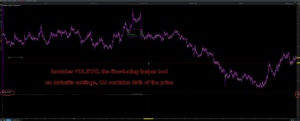
Moreover, the Chebyshev’s inequality tells us that at default settings, The CB should contains about 75% of price closes. In pratice, by the underlying use of the Carnazzi Filter, we are about 95% of price containment. You can assess this with the VOLSTAT helper tool. You can read more on Chebyshev’s inequality and its applications on non-normal distributions here : Chebyshev’s inequality – Wikipedia
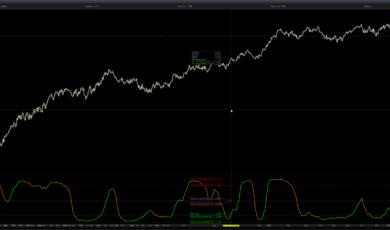
You can see in the following picture that at the default settings (period = 200, n = 2.25), the price containment is about 95%, using the VOLSTAT helper tool :
How to use the CB ?
The CB is not a standalone tool. You have to include the provided hints in your analysis/algorithm.
Globally, the market can be in two modes : trending and cycling.
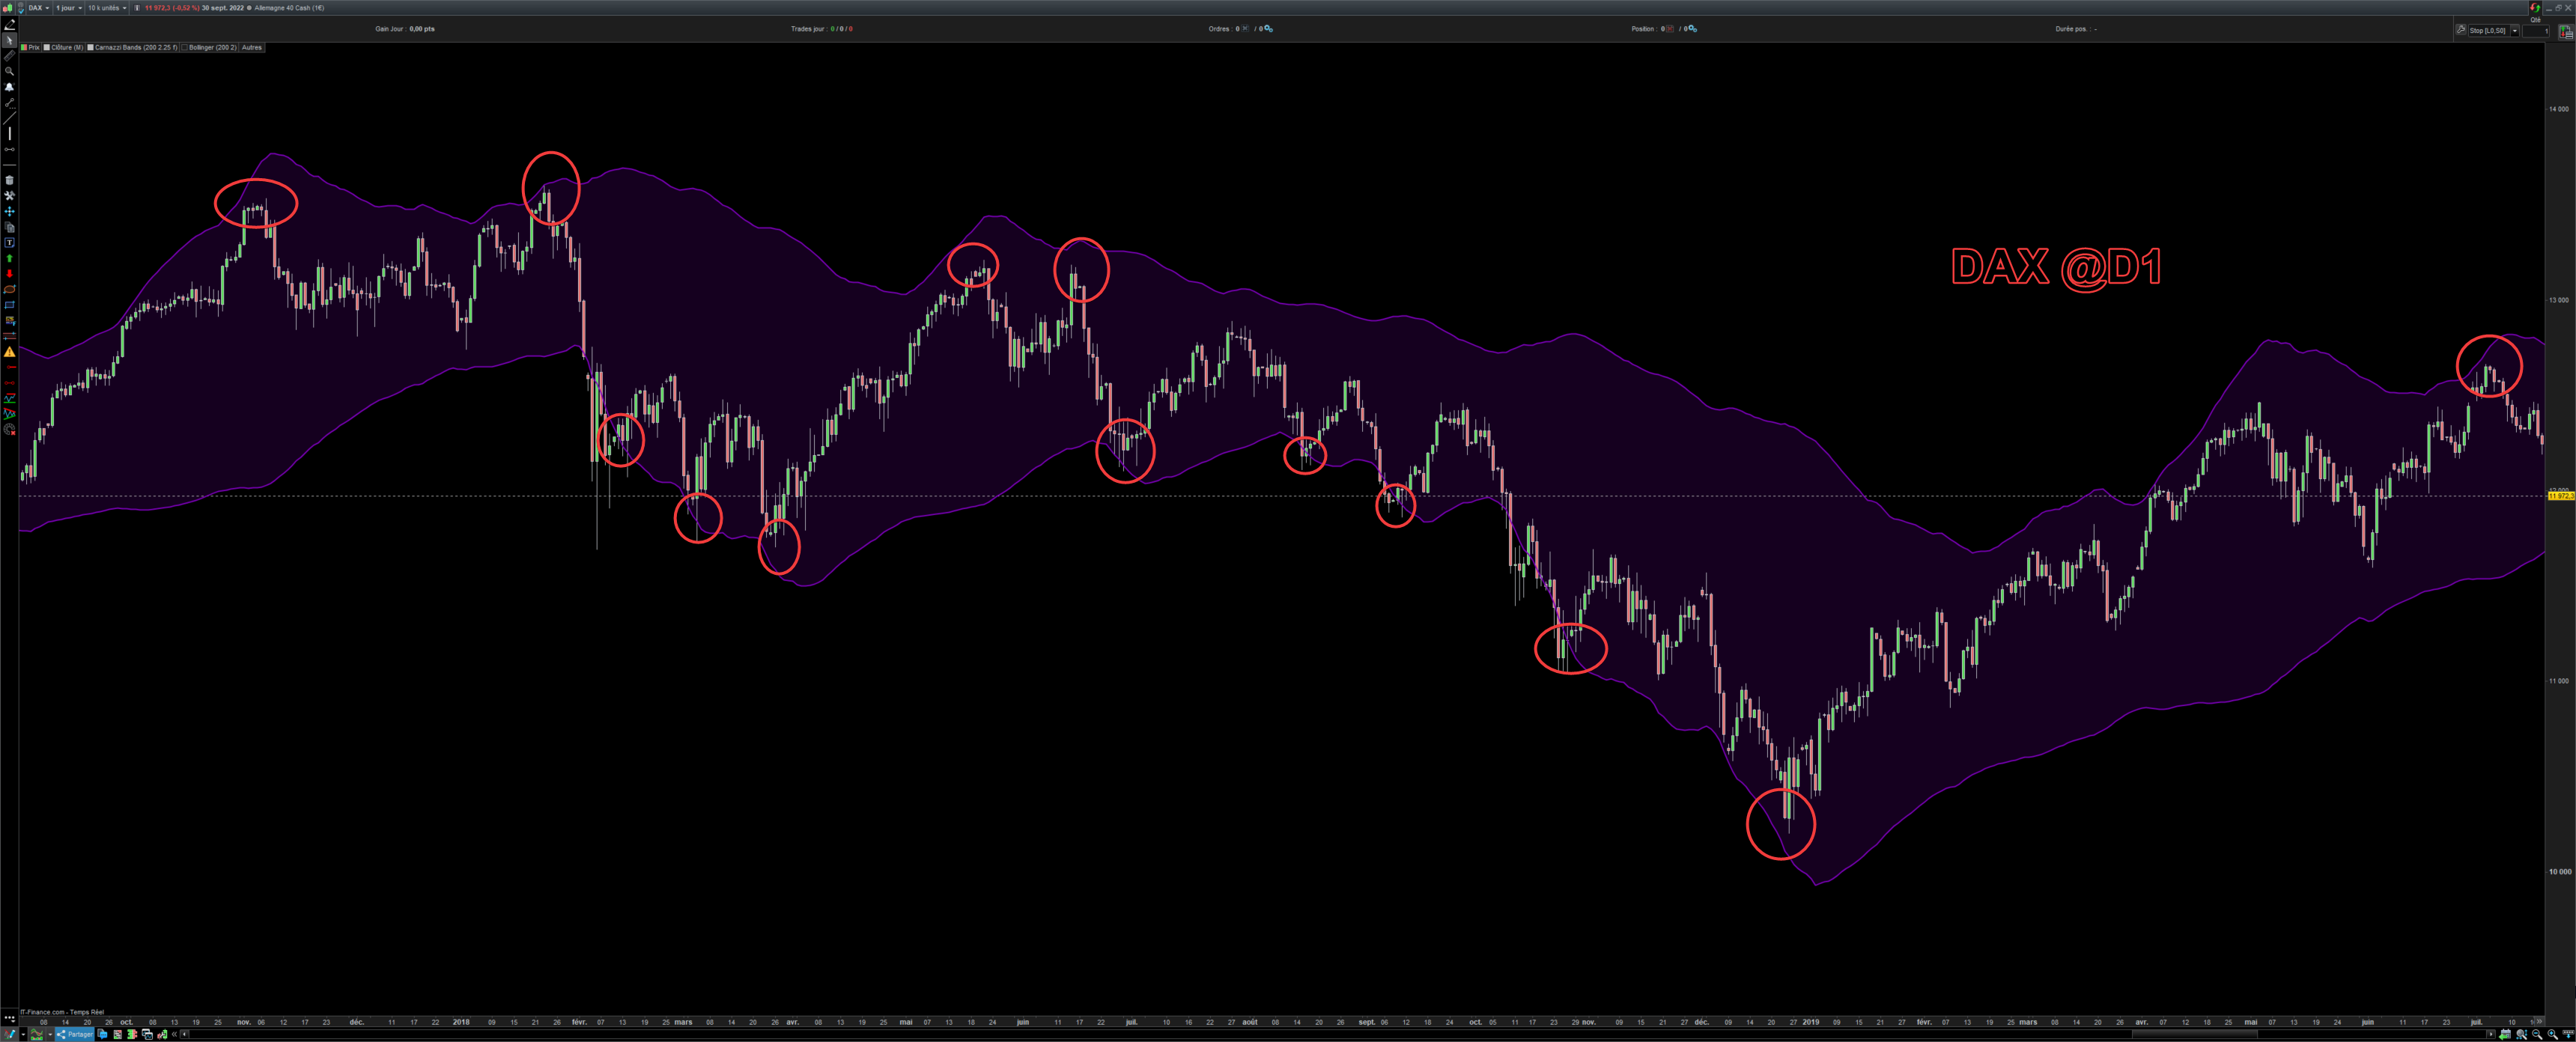
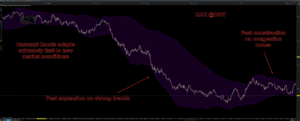
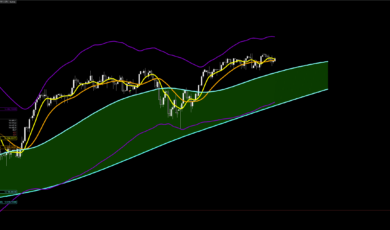
In trending mode, the bands widen and you have to stay in position until the next congestion zone. You can also exit when the price is starting to decelerate and moves away from the bands. In this use case, the CB is used as an exit indicator.
The following picture reflects this use case :
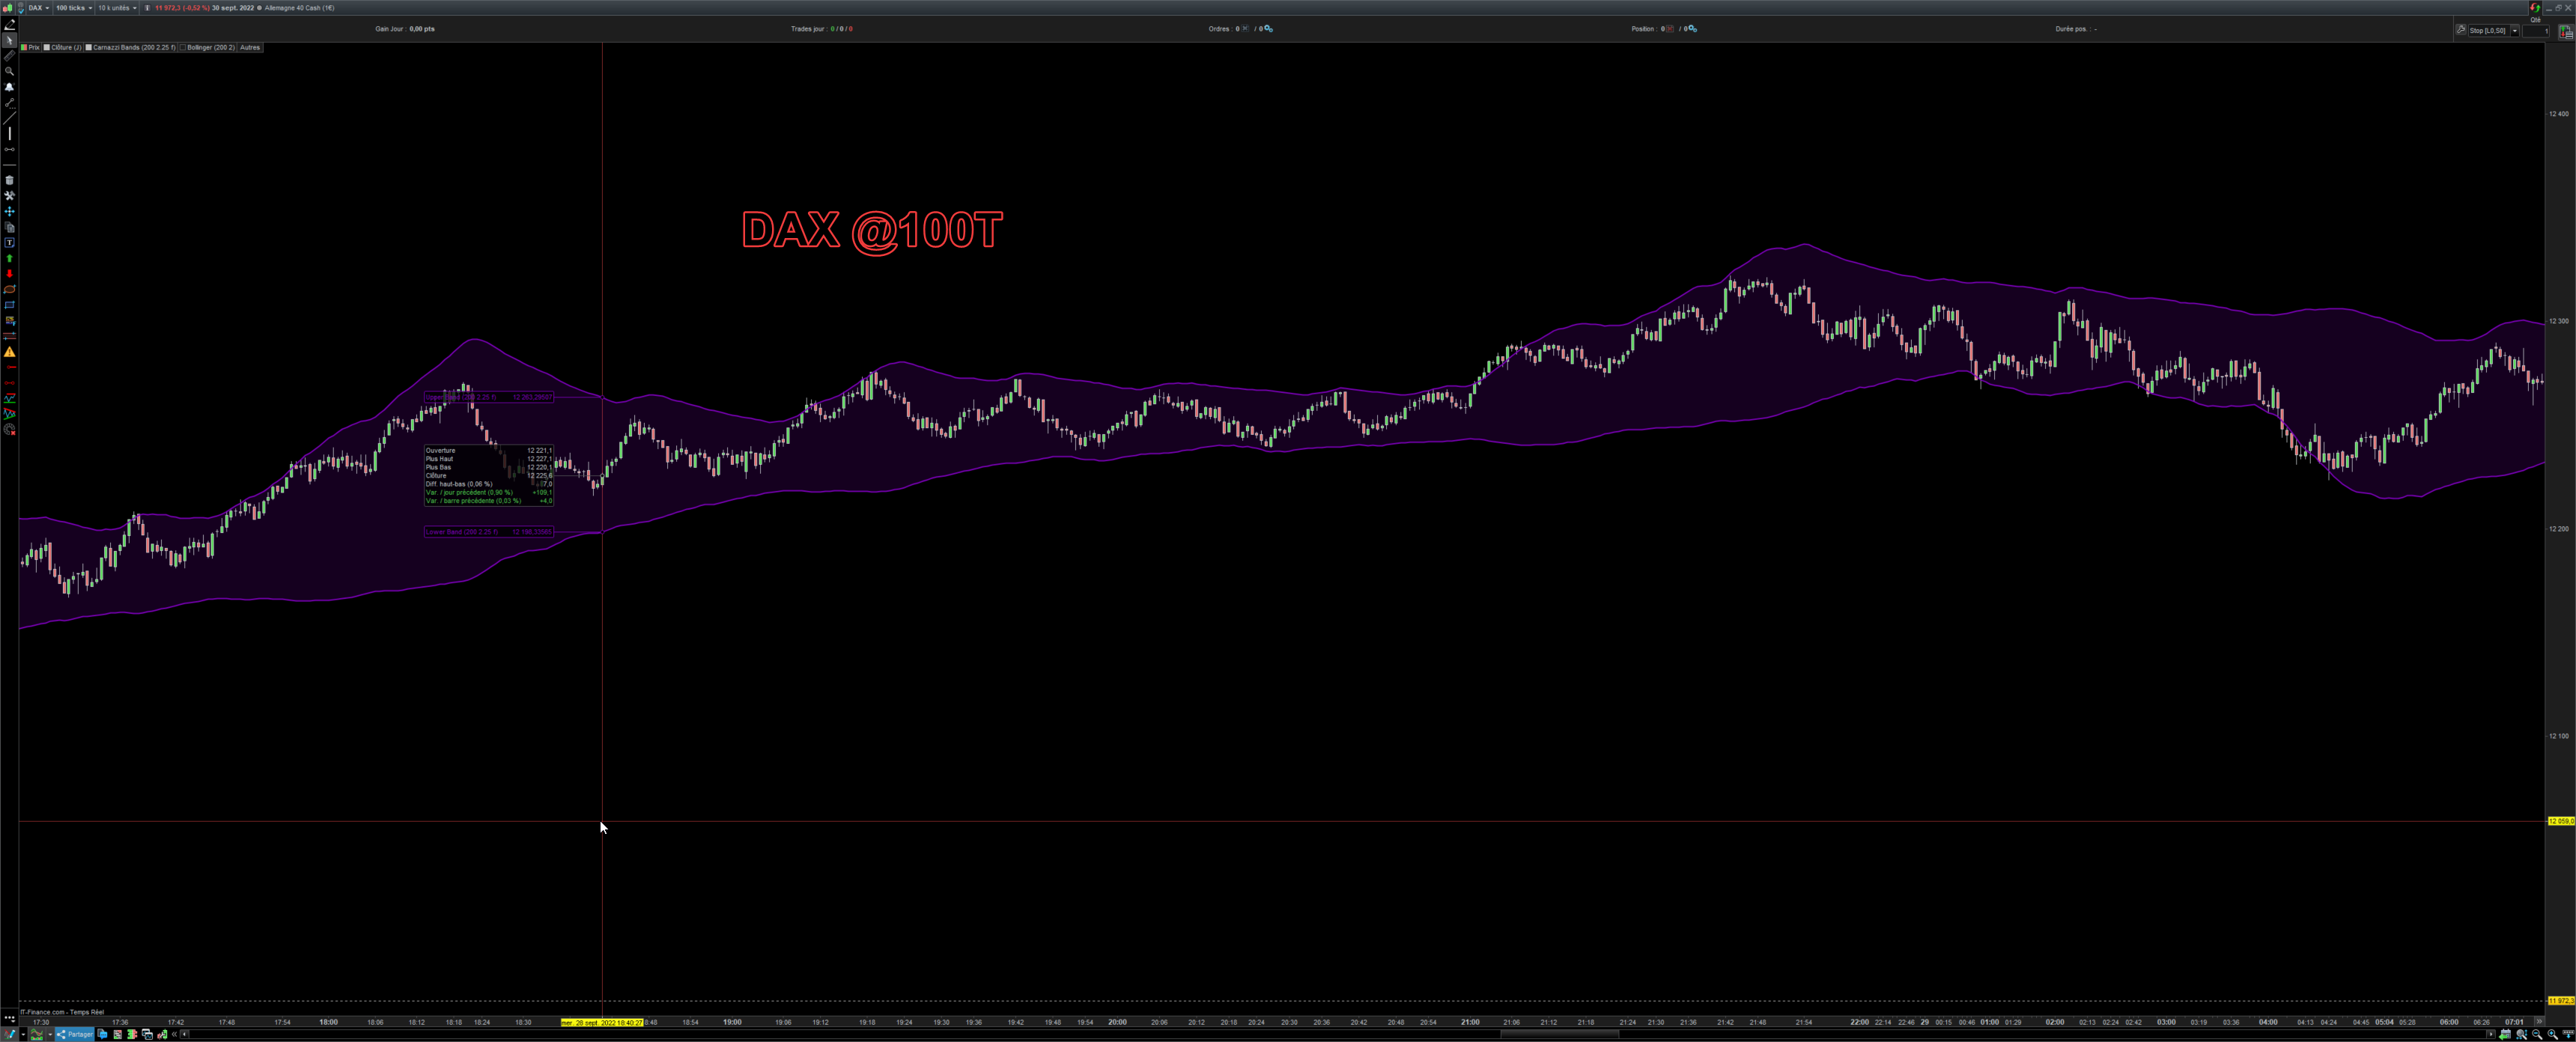
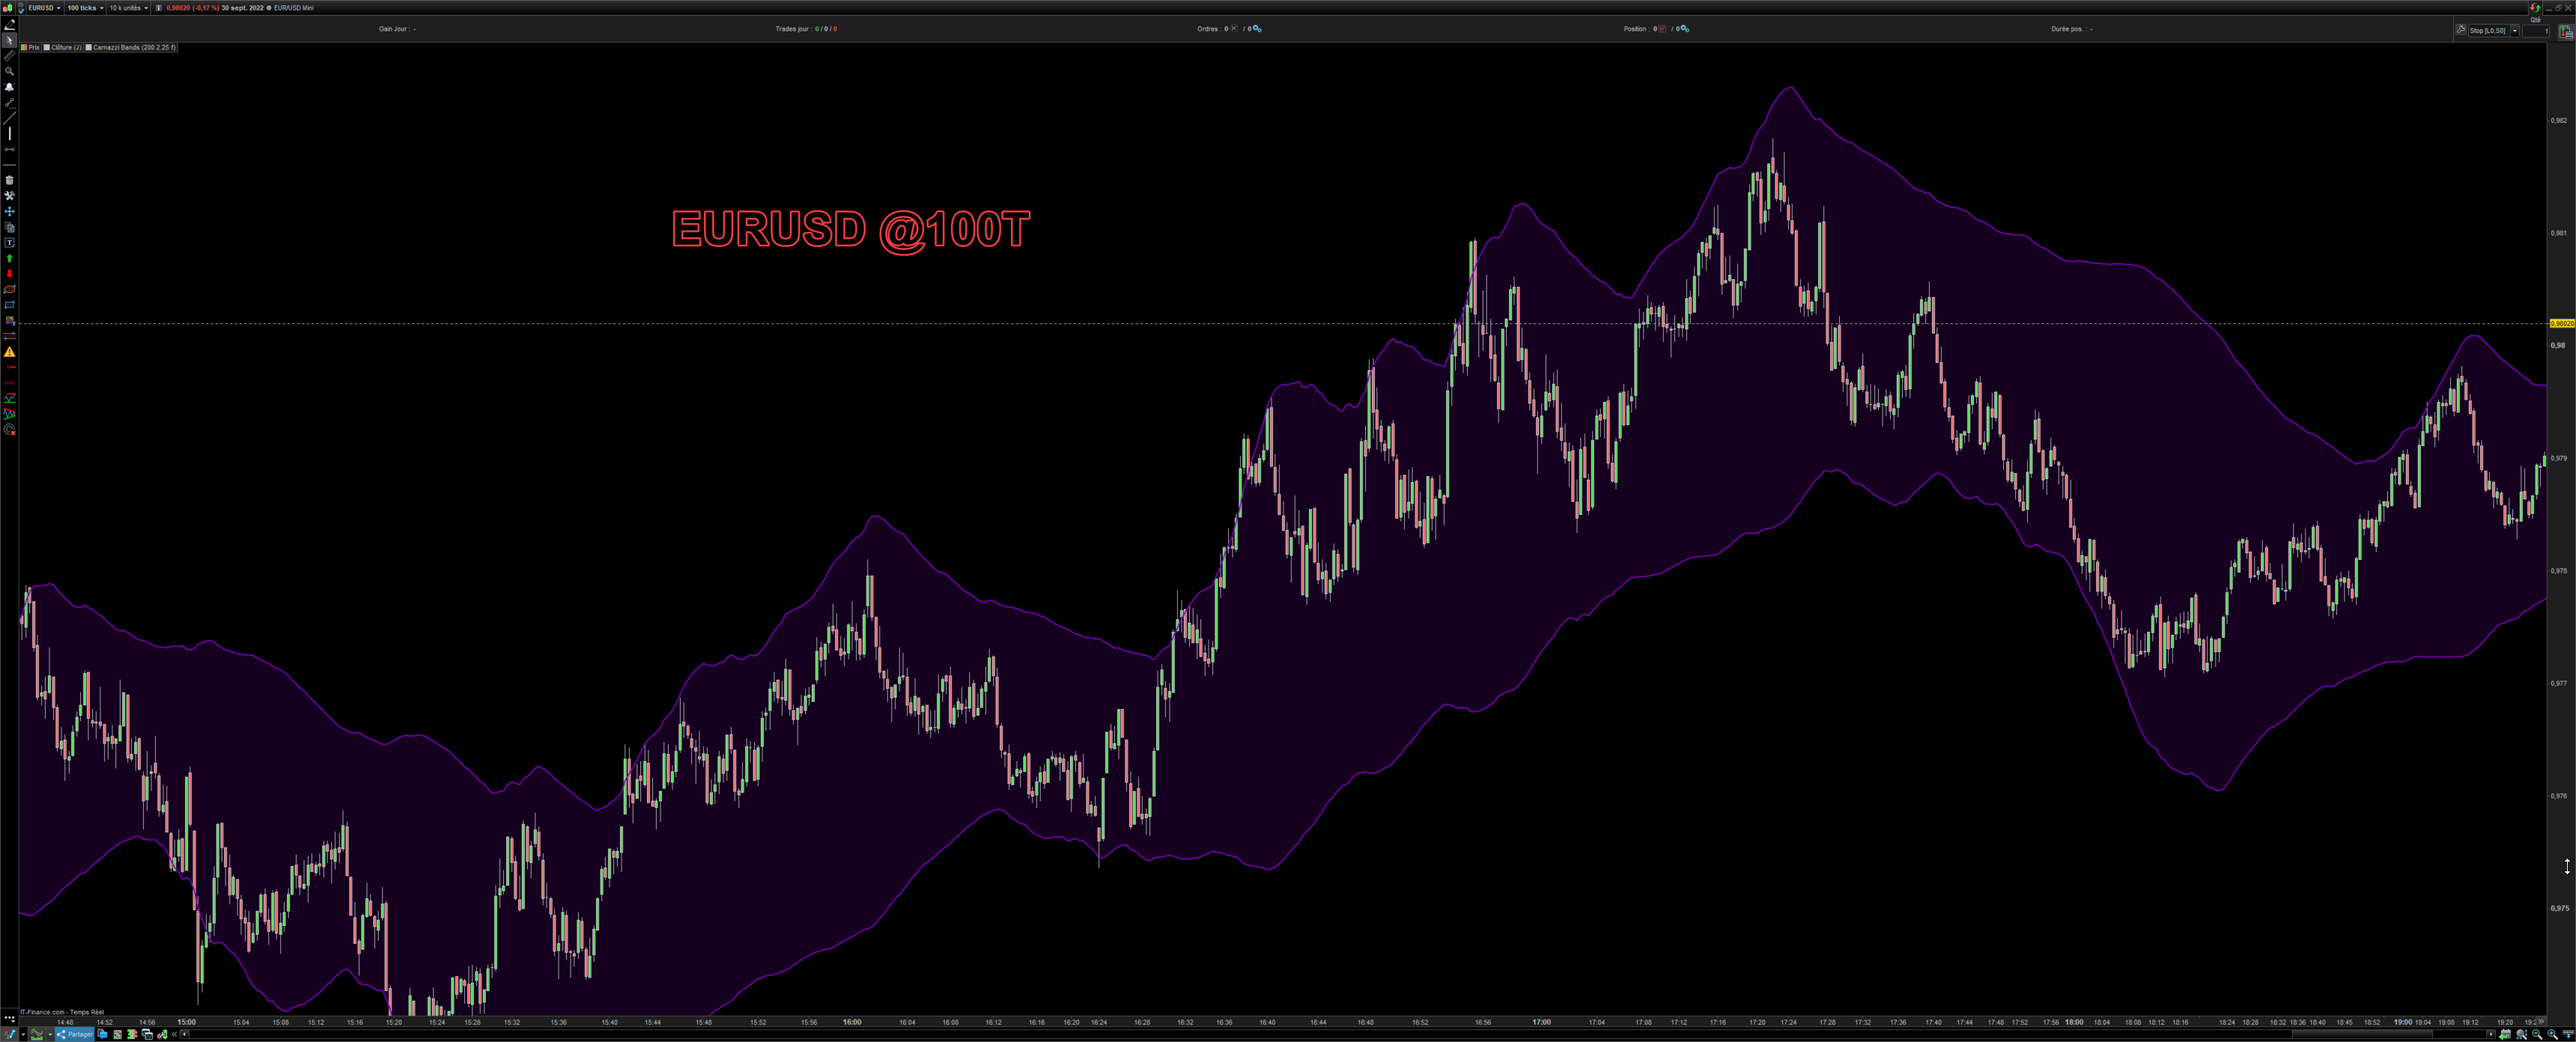
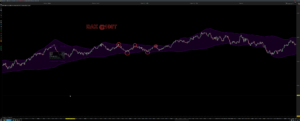
In range market, you can use the CB as both an entry and exit indicator, allowing you to take advantage of small price movements :
In both cases, CB defaults settings (period = 200, n = 2.25) are appropriates. For specific needs, you can tune these parameters with the help of the VOLSTAT provided tool.
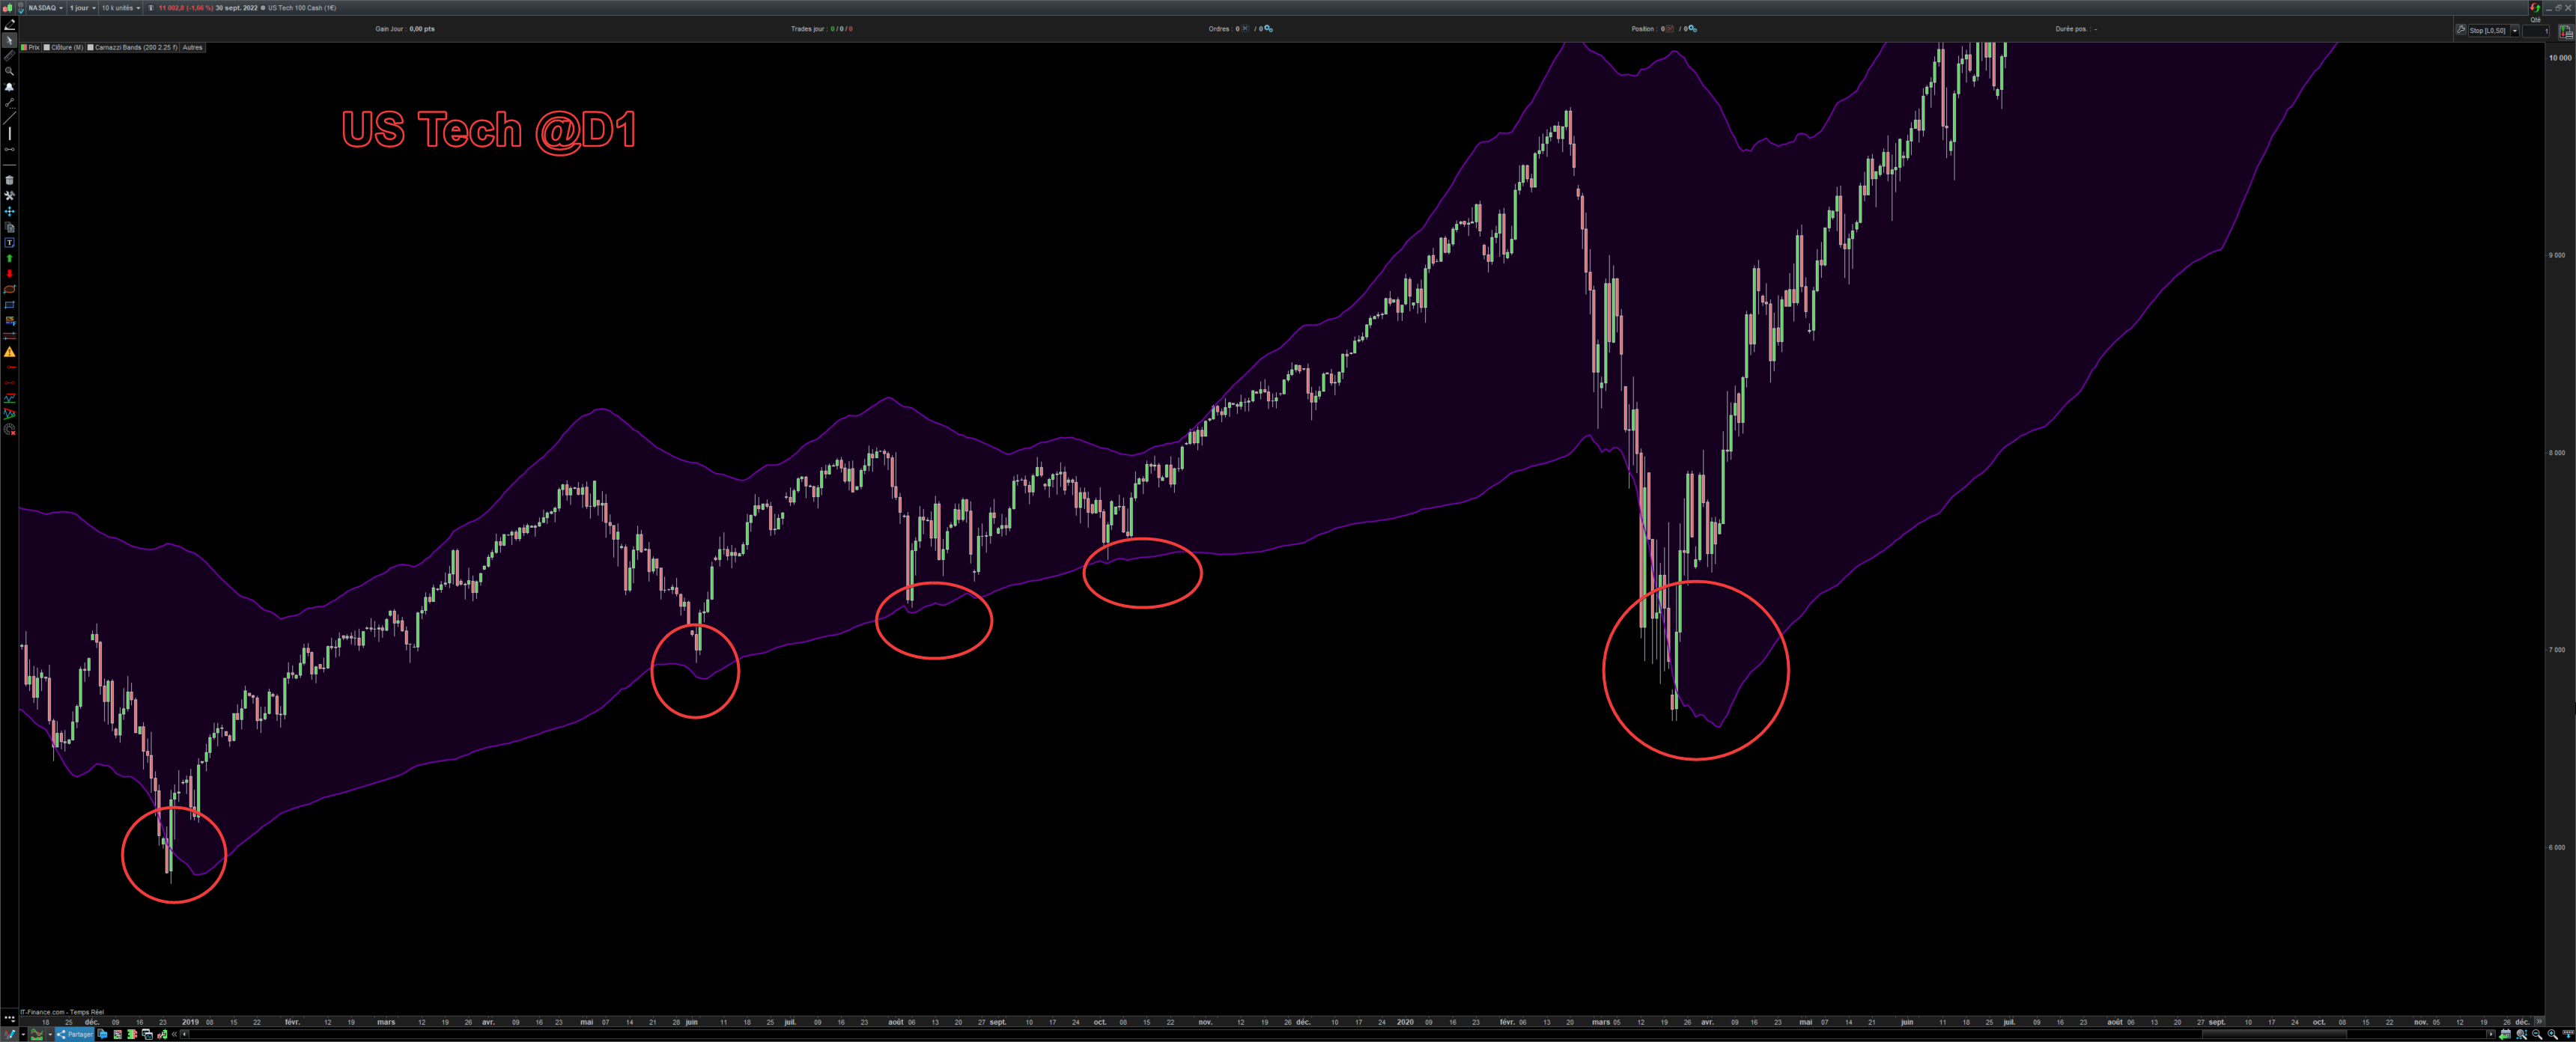
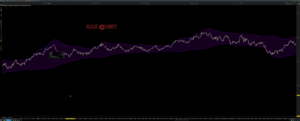
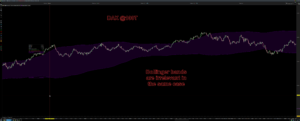
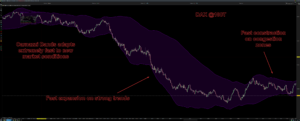
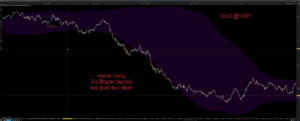
For the sake of completeness, we provide a comparison on some identic situations of the Bollinger Bands and the Carnazzi Bands :
CB :
BB :
CB :
BB :
Final note : CB use a derivate form of the Carnazzi Filter, specially tuned for volatility purposes. It DOES NOT comes with the CF. If you superpose CF and CB, you will see that most of time, the CF is not the center of the bands. CF in his normal form is designed for movement tracking, not volatility measure. This is a major difference with the classic Bollinger Bands.
I am sure that this tool will bring you the greatest satisfaction and I wish you an excellent trading.
Best regards,
Bruno.

Bewertungen
Es gibt noch keine Bewertungen.