

Main Features of Black Scholes Merton (BSM) 6×3 Calculator :–
Work Out if your Broker is Under and/or Over Pricing Options:
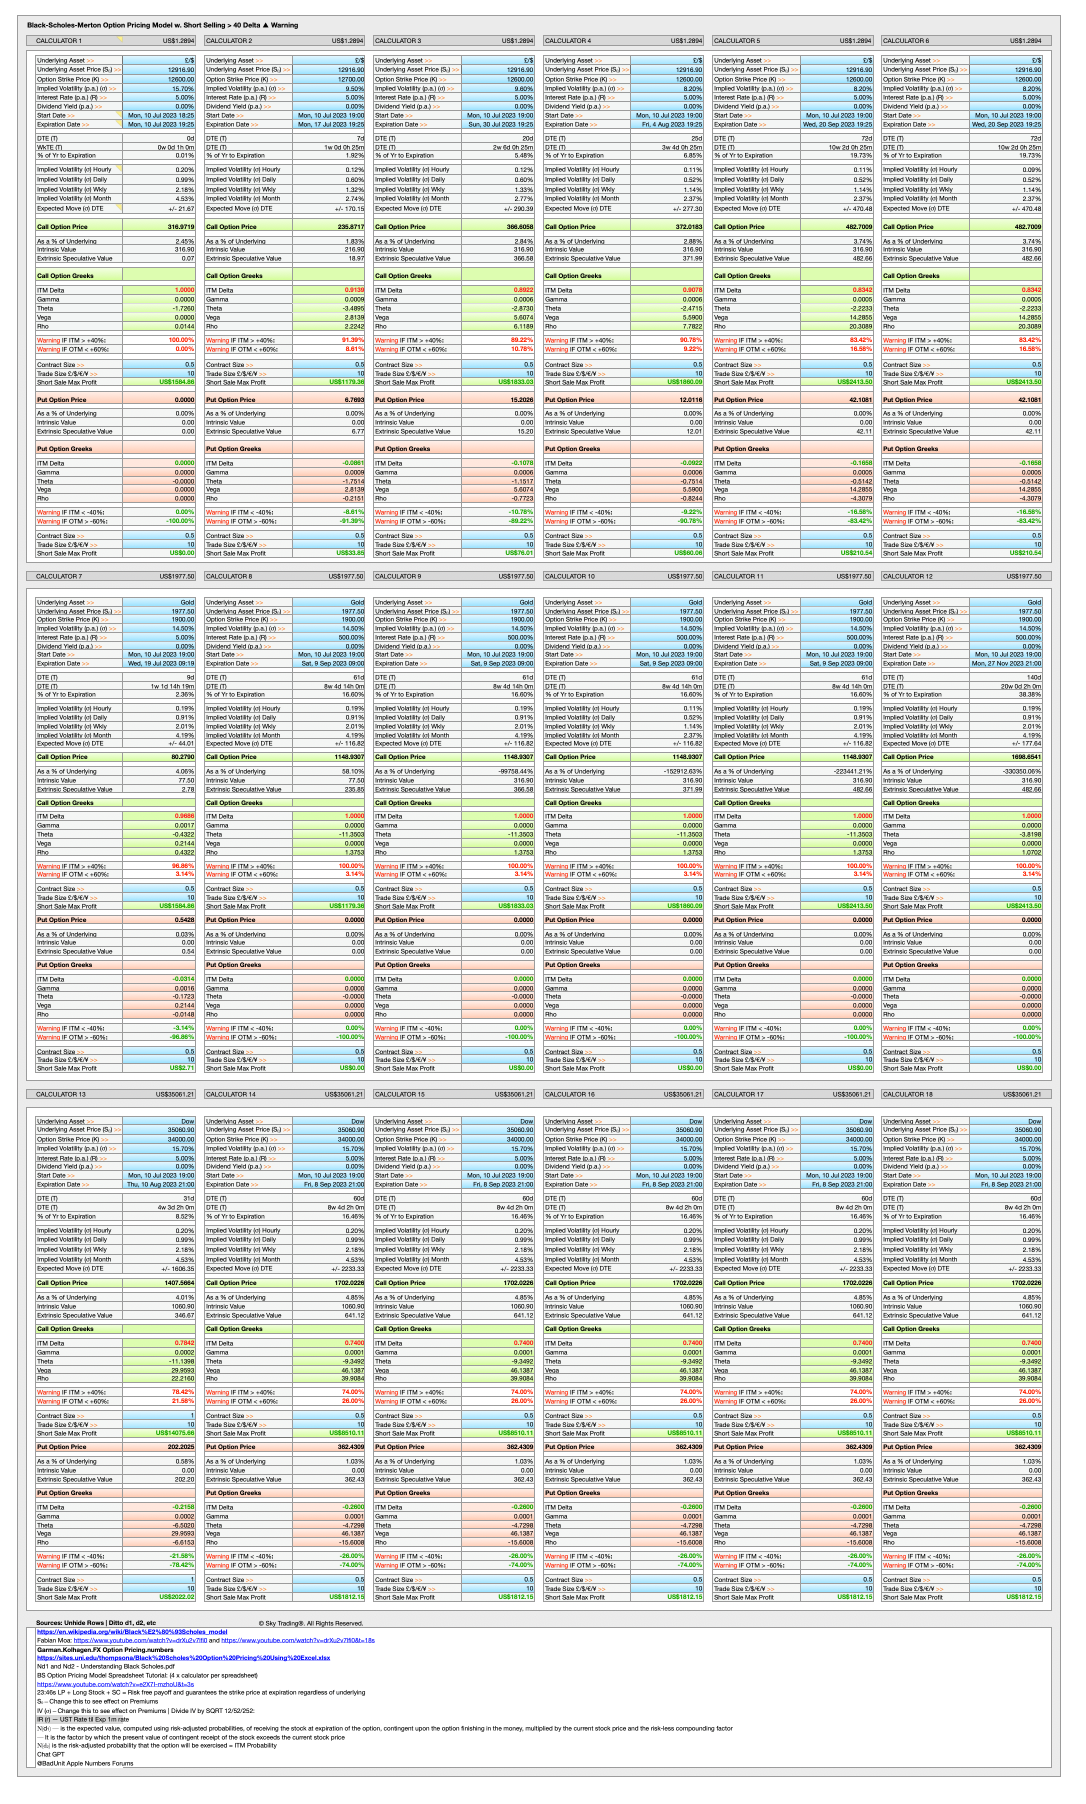
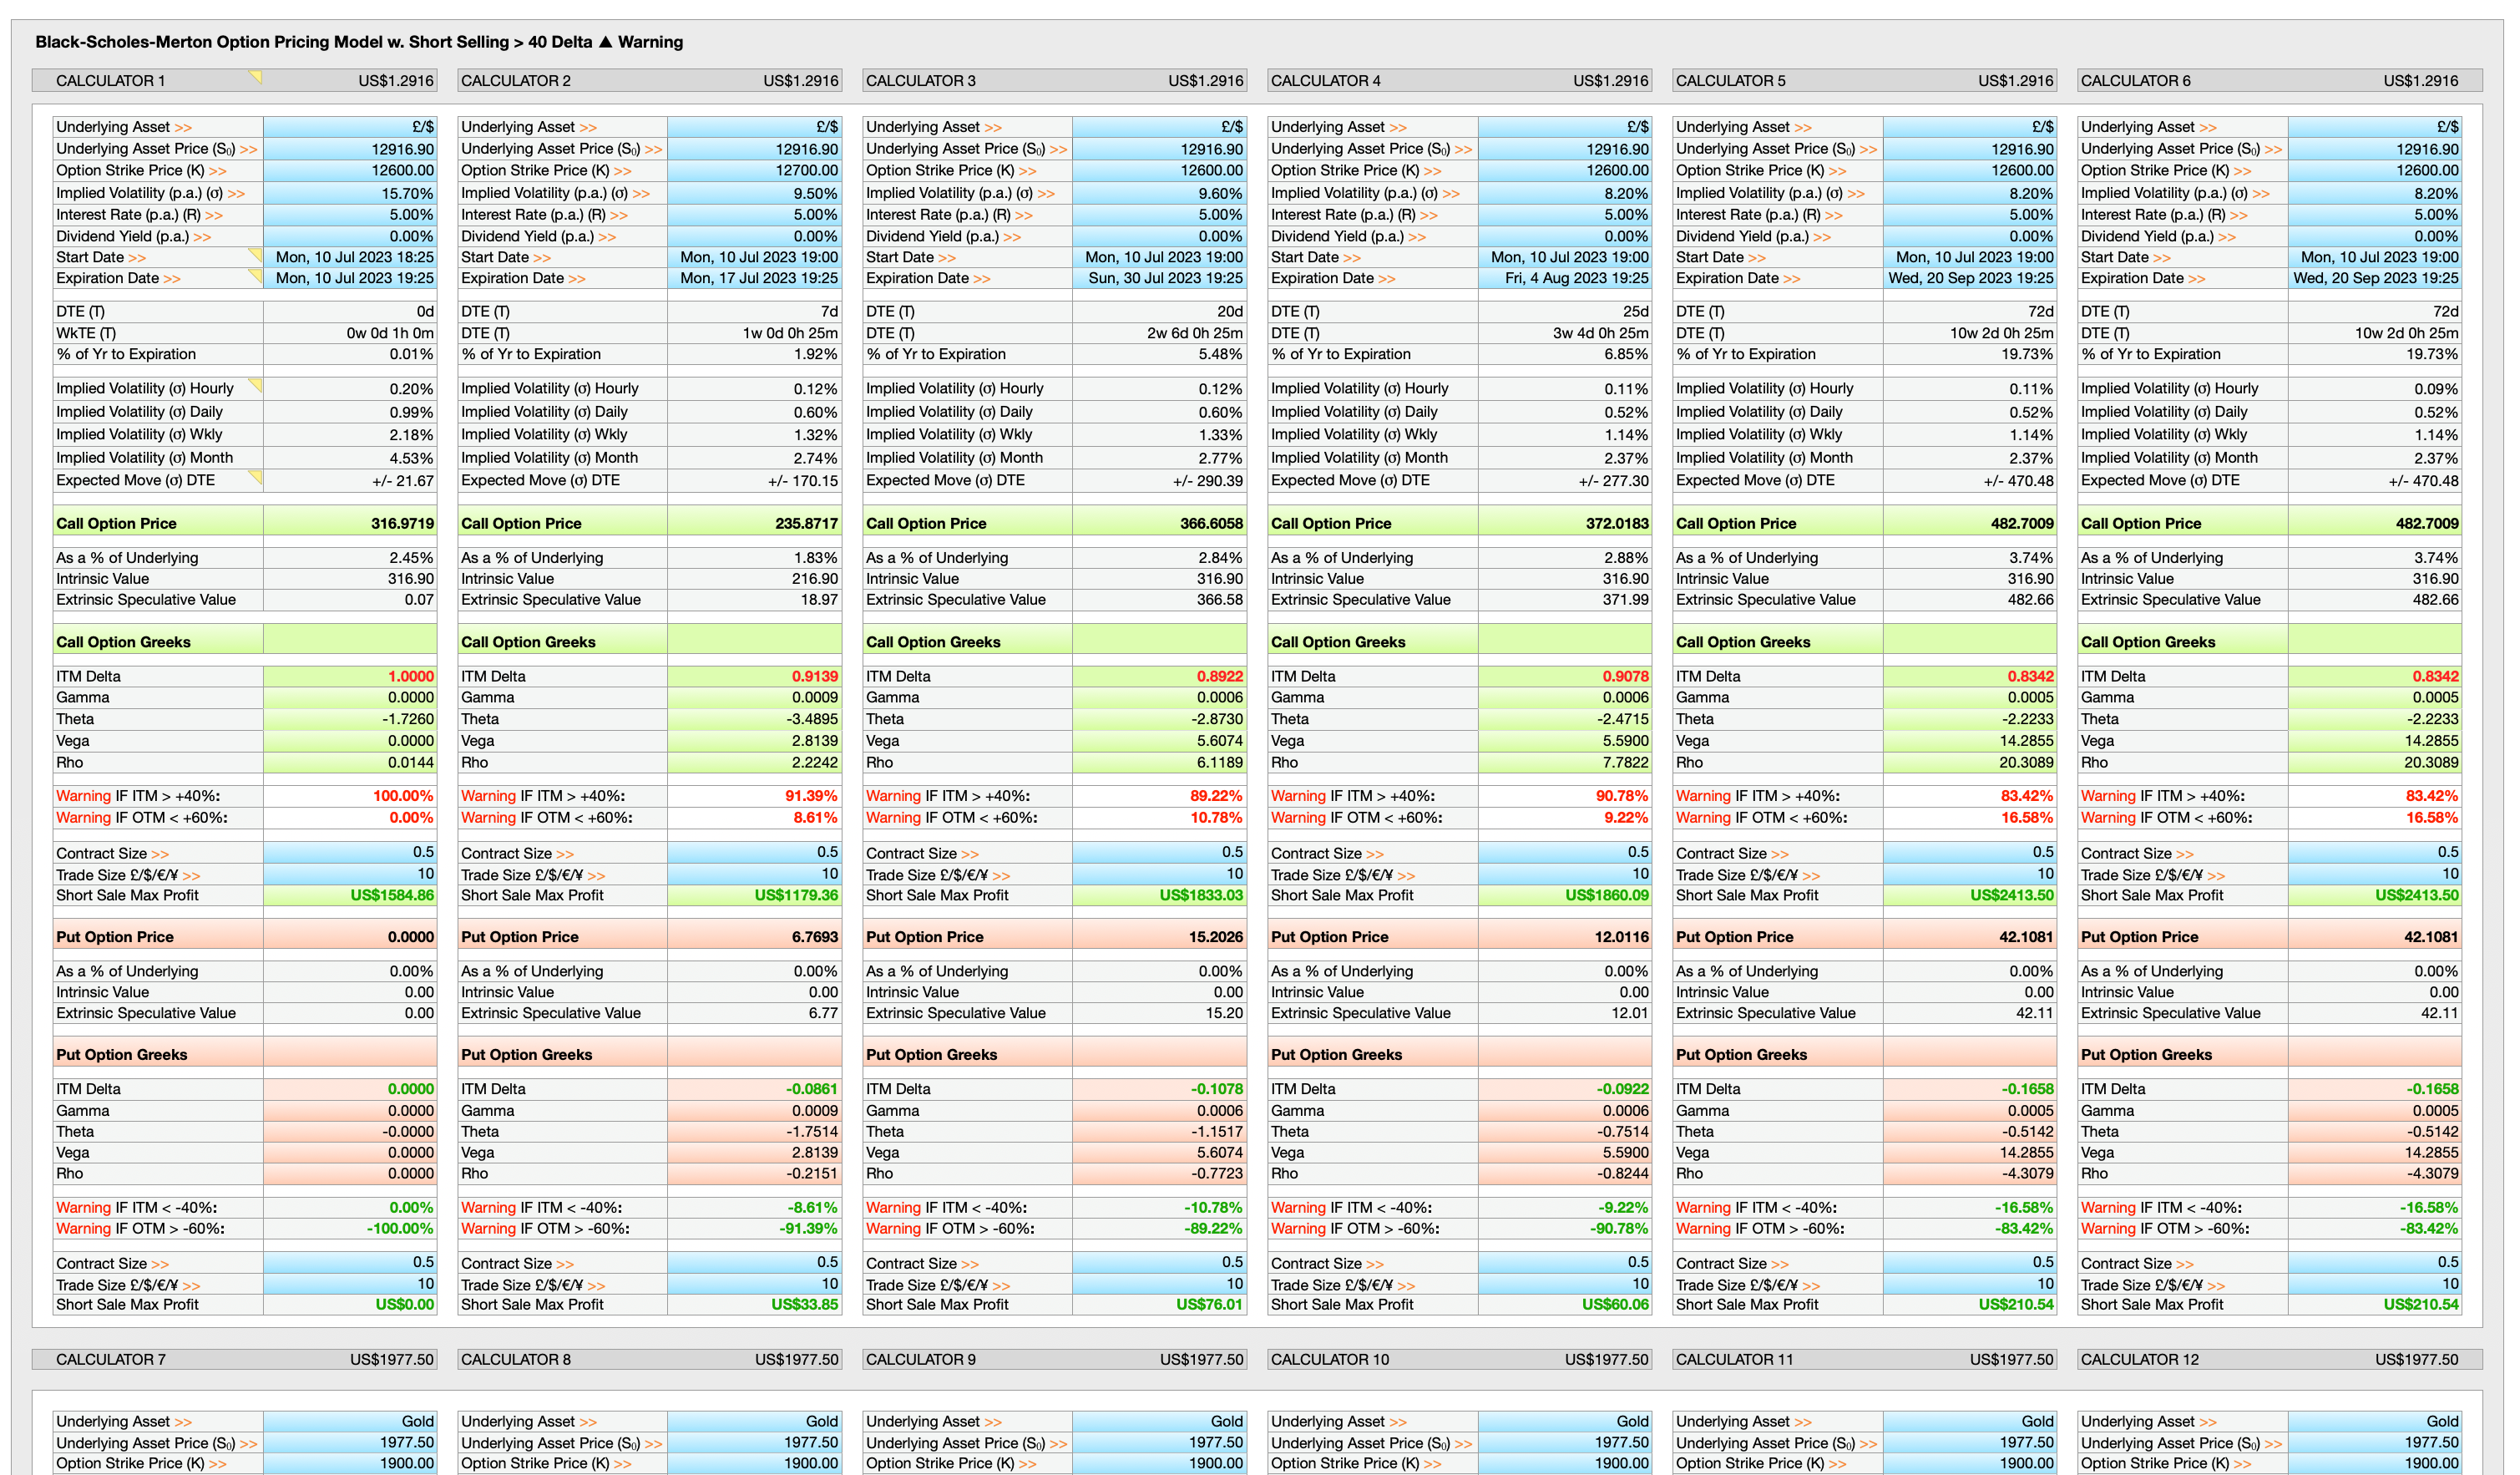
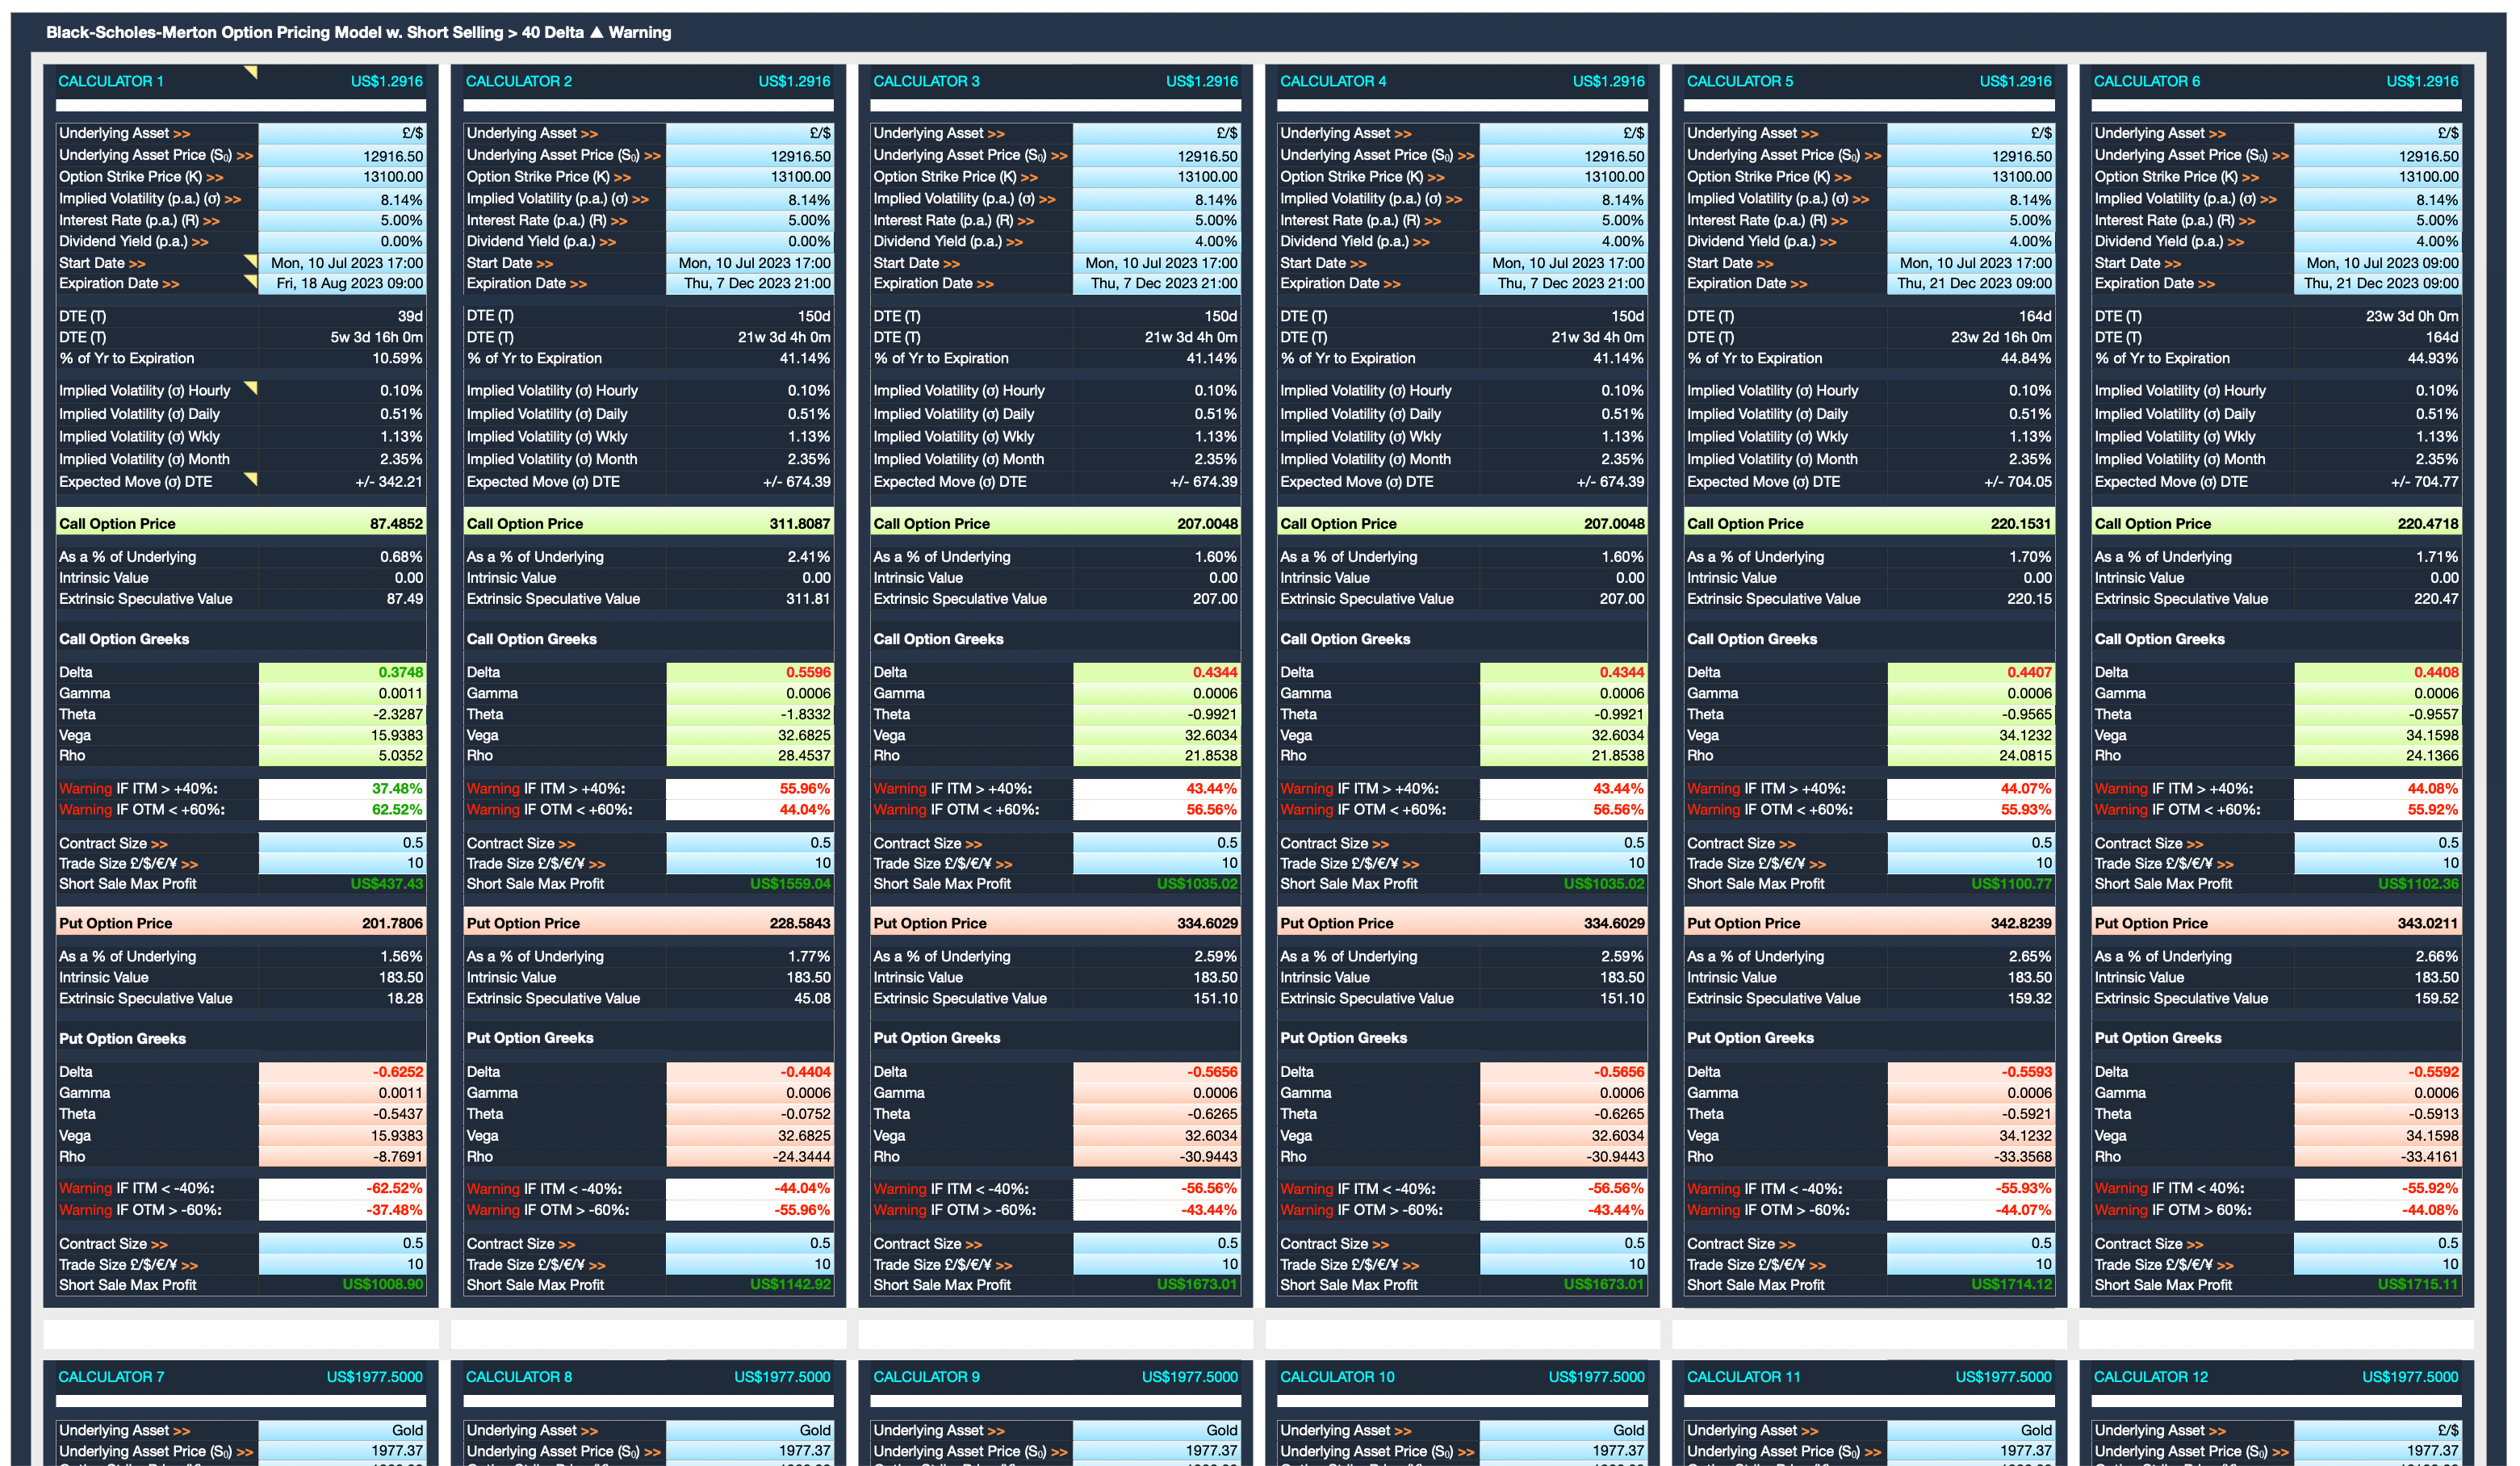
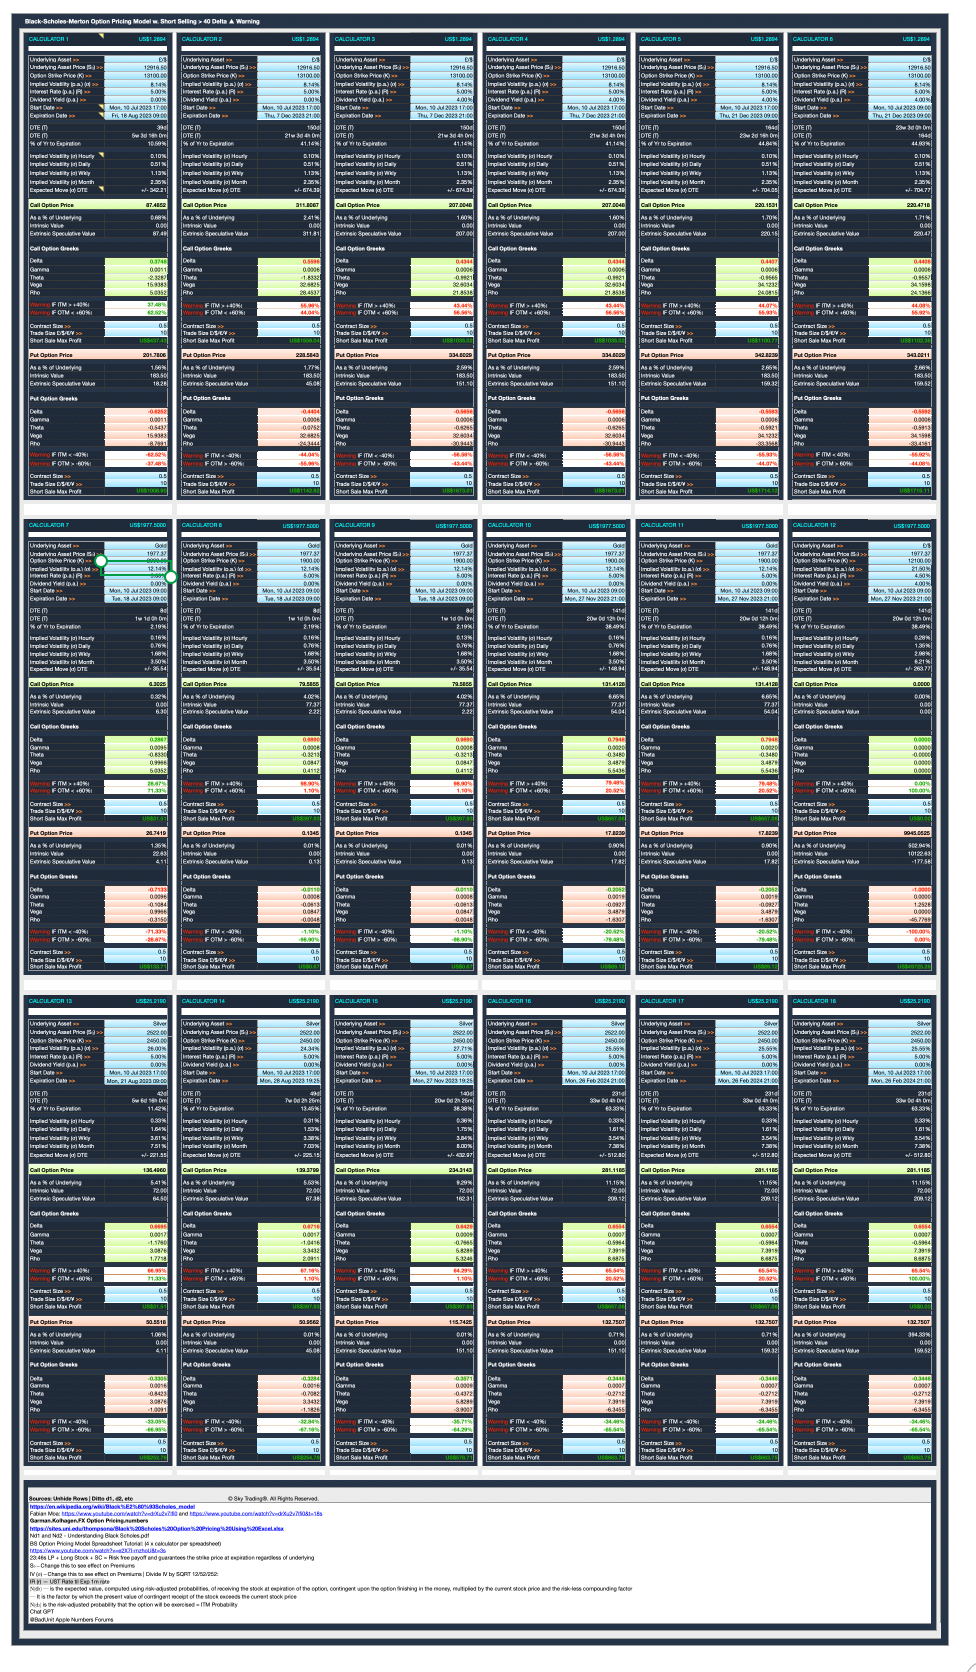
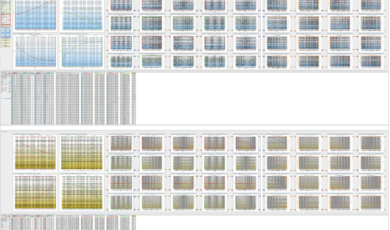
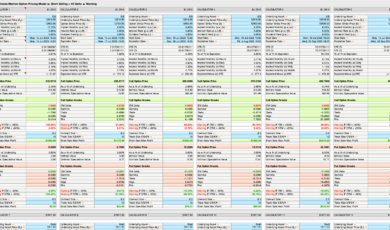
This Multi Bank Calculator allow you to trade your favourite assets and see if your broker is under or over pricing Calls or Puts. There are 6 calculators per row and 3 rows making 18 separate calculators in total. Note: Implied Volatility will need to match that of your brokers IV I the Option Chain in order to get an accurate assessment of option price differences between your broker and the BSM Model’s Call and Put price results.
Comes with “Greeks” Calculations, Delta, Gamma, Theta, Vega and Rho.
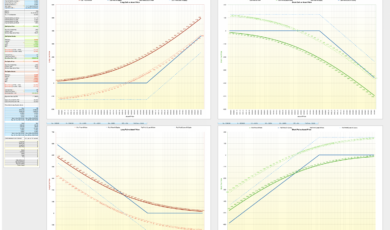
Calculates Greeks, based on the DTE remaining for the Option Contract for:
Delta: The rate of change of Option Prices to changes in the Underlying Price and Directional Move Probability.
Gamma: The speed Delta is Changing. Important for Options close to Expiry.
Theta: The amount Time Decay reduces the Option Price.
Vega: The impact of Volatility on the Option Price.
Rho: Sensitivity of Option Prices to Changes in Interest Rates.
Calculate Option Premiums for 0DTE (Zero Days to Expiry) to Monthly:
Allows traders to see Option Prices for 0DTE (eg 8 hrs), 1DTE, 2DTE etc, Weekly Expiry, Monthly Expiry and longer, useful if traders are targeting premiums to earn from short selling Calls or Puts. All the online BSM calculators are for single use/input.
Includes Expected Moves Formula:
Each Calculator comes with the Expected Market Move in Points for whatever time period you set it to, all the way down to the final minutes of an Options life. Work out how much an Asset Price is Expected to Move from an Hourly to Yearly basis with:
68.2%
95.4%
99.7%
Probabilities / Confidence.
Understand how far the Market is Expected to Move and be able to work out Entries and Set Stop Losses easily.
It comes with examples of EM’s for Oil in the cell comment field in the calculator (I have also described the EM formula using Oil as an example below here in this description).
Implied Volatility (IV) Market Move Percentages
Allows you to see IV Percentages across multiple timeframes, Hourly, Daily, Weekly and Monthly
Accuracy:
Option Prices are calculated using the Nobel Prize Winning Black-Scholes-Merton mathematical Option Pricing Model and are accurate to 2 decimal places when tested against and compared to the Options Education org website calculator. Dependent upon using the same Implied Volatility figures from your broker. IG Index for example get their I.V. figures from the Union Bank of Switzerland (UBS).
Saves Time:
It saves traders time by avoiding the replication of inputting data like the Asset Price and Strike Price, Implied Volatility, Interest Rates, Start and End dates (DTE, Days to Expiry), over and over again as there are 6 calculators per row, and 3 rows making 18 individual calculators in total. I have mine set like this:
Row 1 — £/$
Row 2 — Gold
Row 3 — Dow Jones
On any Row, my first of 6 calculators is set for 0DTE, the second one for daily (1DTE) and then the rest for Days, Weekly and Monthly Pricing.
Live Option Price Updating:
Option Start Dates can be set to live “@Now” to see Call and Put Option Price changes in Real Time. (Computer CPU power dependent).
Dividends:
Allows for Dividend Interest Percentage input. (The Merton part of the Black Scholes Model)
Delta Warning for Short Sellers:
It comes with a Red Text Warning for Short Sellers when the OTM (Out the Money) Delta falls below <60%. (The % level can be changed to suit your own risk tolerance/trading style)
Yahoo Asset Price Feed:
It features an Asset Price Feed via Yahoo Finance.
Design:
Finished to a High Degree of Professional Design.
Not your basic free amateur Excel Spreadsheet like those found on the net!
For each calculator cells are editable and unlocked.
Simply the Best, Most Accurate Options Pricing Calculator on the Net.
Take Control of Market Risk.
Download my Options Trading Calculator Now.
€19.95 only for PRC Members ☺️ (€29.95 everywhere else)
———————————————————————————————————————————————-
*Expected Move Explanation:
Something regular traders might not be aware of, but which Option Traders use, is the Expected Move (EM) formula which calculates the amount the Underlying Asset Price is Expected to Move in the time remaining to expiry (DTE), Days to Expiry.
EM = (Asset price) x (Annualised Implied Volatility) x (Square Root of [days to expiration] / 365])
By definition, Implied volatility (IV) is a 1 Standard Deviation (SD) annual move, indicating a 68.2% probability for an asset to trade within that 1 SD range over a year.
Eg, if asset XYZ is trading at £200 with a 10% IV, there’s a:
68.2% chance it will trade between £180 and £220 within a year.
Multiply the EM by 2x and there is a:
95.4% chance it will trade between £160 and £240.
Multiply the EM by 3x and there is a:
99.7% chance it will trade between £140 and £260.
These probabilities are derived from probability distributions, such as bell curves, which describe likely values for a random variable like stock prices.
Asset prices historically exhibit log-normal behaviour, making them suitable for probability distributions, meaning they follow a distribution that is approximately symmetric on a logarithmic scale.
Low IV implies narrow trading ranges for an underlying asset, while increasing IV suggests wider potential ranges. Rising IV also leads to higher option premiums when buying or selling options on the underlying asset.
In the previous example with stock XYZ and a +/- £20 move, if IV increased from 10% to 25%, the new probability distribution would be as follows:
• 1 SD – 68.2% probability of the asset closing between £150 and £250 a yr from now.
• 2 SD – 95.4% probability of the asset between £100 and £300 a yr from now.
• 3 SD – 99.7% probability of the asset between £50 and £350 a yr from now.
Further examples of IV Calculations and EM’s:
US Crude Oil Price = £66
Strike Price for a Put option =
£63 (Out the Money — OTM)
IV = 24.95% (annual)
Therefore there is a 68.2% chance of the price being +/- £16.46 within a year (£66 x 0.2495). (The Sq Root of 1 is 1)
Therefore expect:
• 1 SD– 68.2% probability of oil closing between £49.54 and £82.46 a yr from now.
• 2 SD – 95.4% probability of oil closing between £33.08 and £98.92 a yr from now.
• 3 SD – 99.7% probability of oil closing between £16.62 and £115.38 a yr from now.
Implications of Changing IV:
In a rising volatility environment, the expectations for movement in the hypothetical underlying XYZ undergo significant changes. Initially, with a 10% IV, a 1 SD move was between £180 and £220. However, with an increased IV of 25%, the 1 SD move widens to £150 and £250.
This shift in IV and SD creates potential opportunities for options traders. In the low volatility scenario, a trader selling a 1 SD Strangle would target the £180 and £220 Strikes. In the high volatility scenario, the same strategy would shift to the £150 and £250 Strikes.
In high volatility environments, where movement expectations are expanding, short volatility traders face a choice:
• Sell Strikes closer to at-the-money (ATM) for higher credits received but with a lower probability of profit (POP).
• Sell Strikes further from at-the-money (ATM) for slightly lower credits received but with a higher probability of profit (POP).
Reviews
There are no reviews yet.