
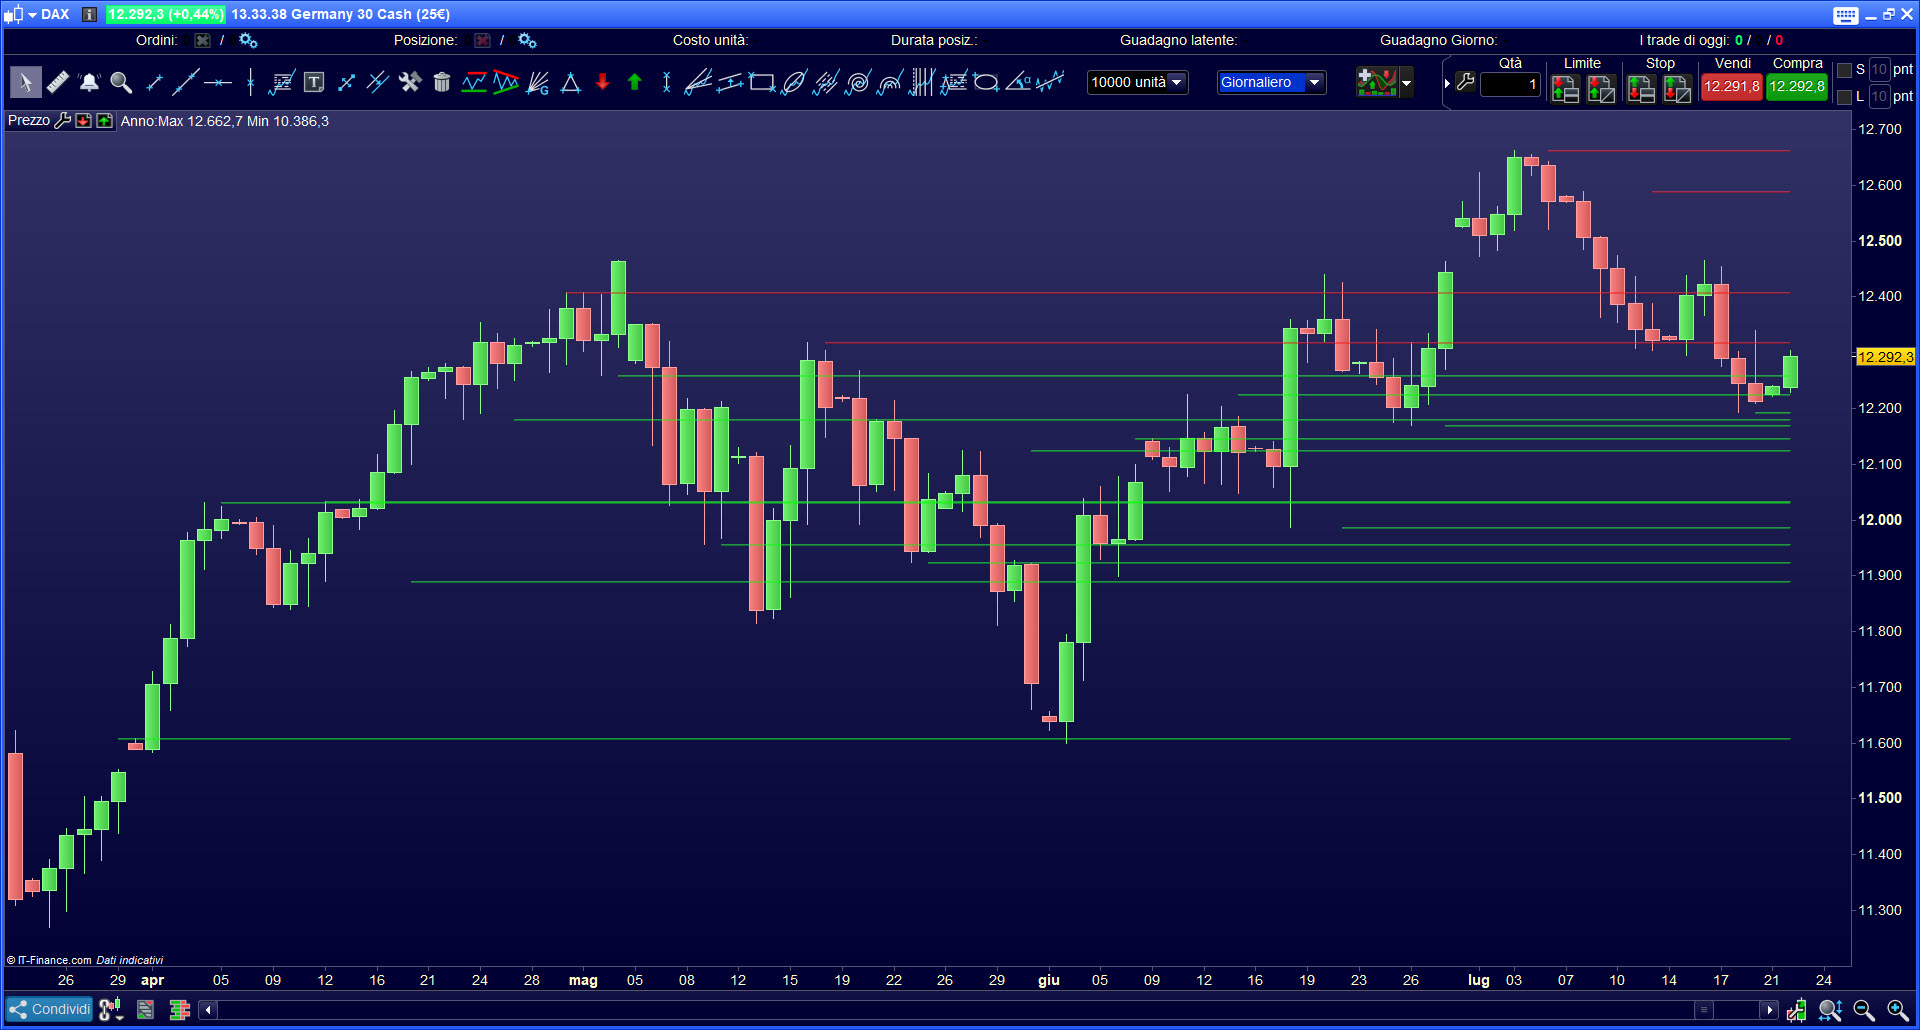

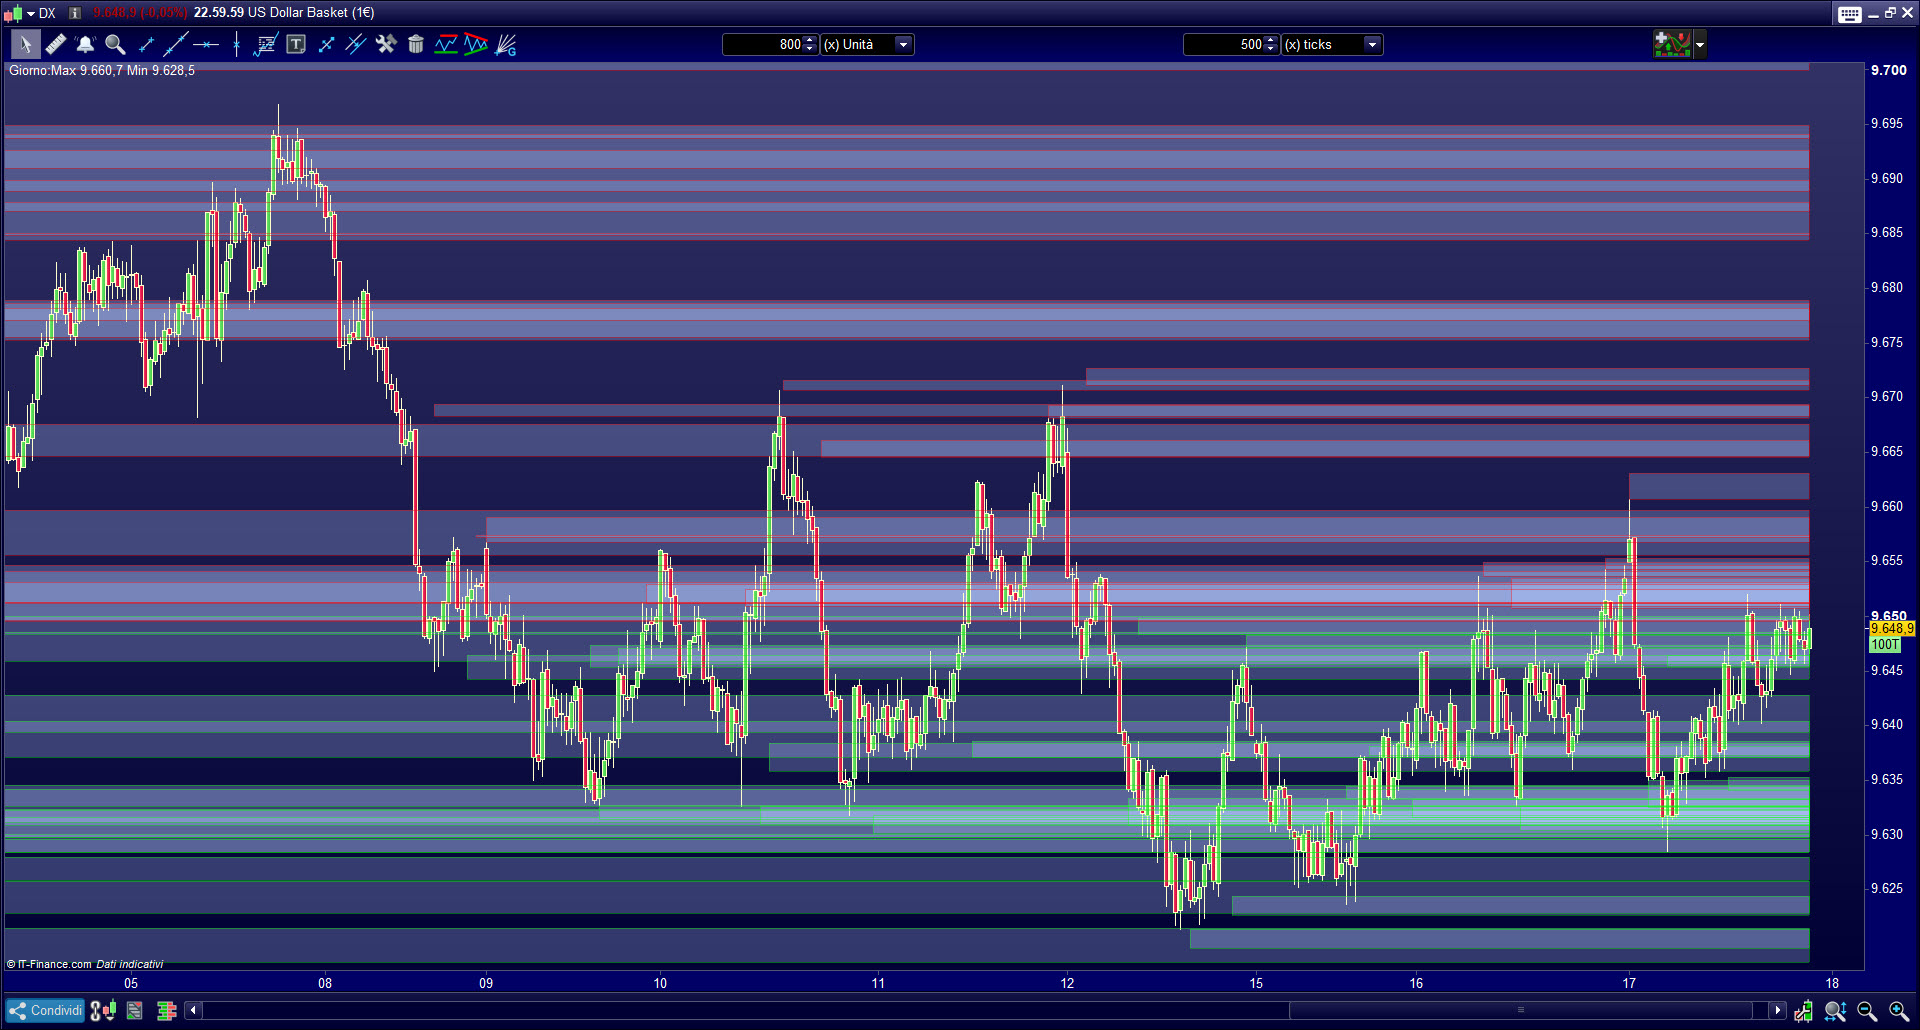
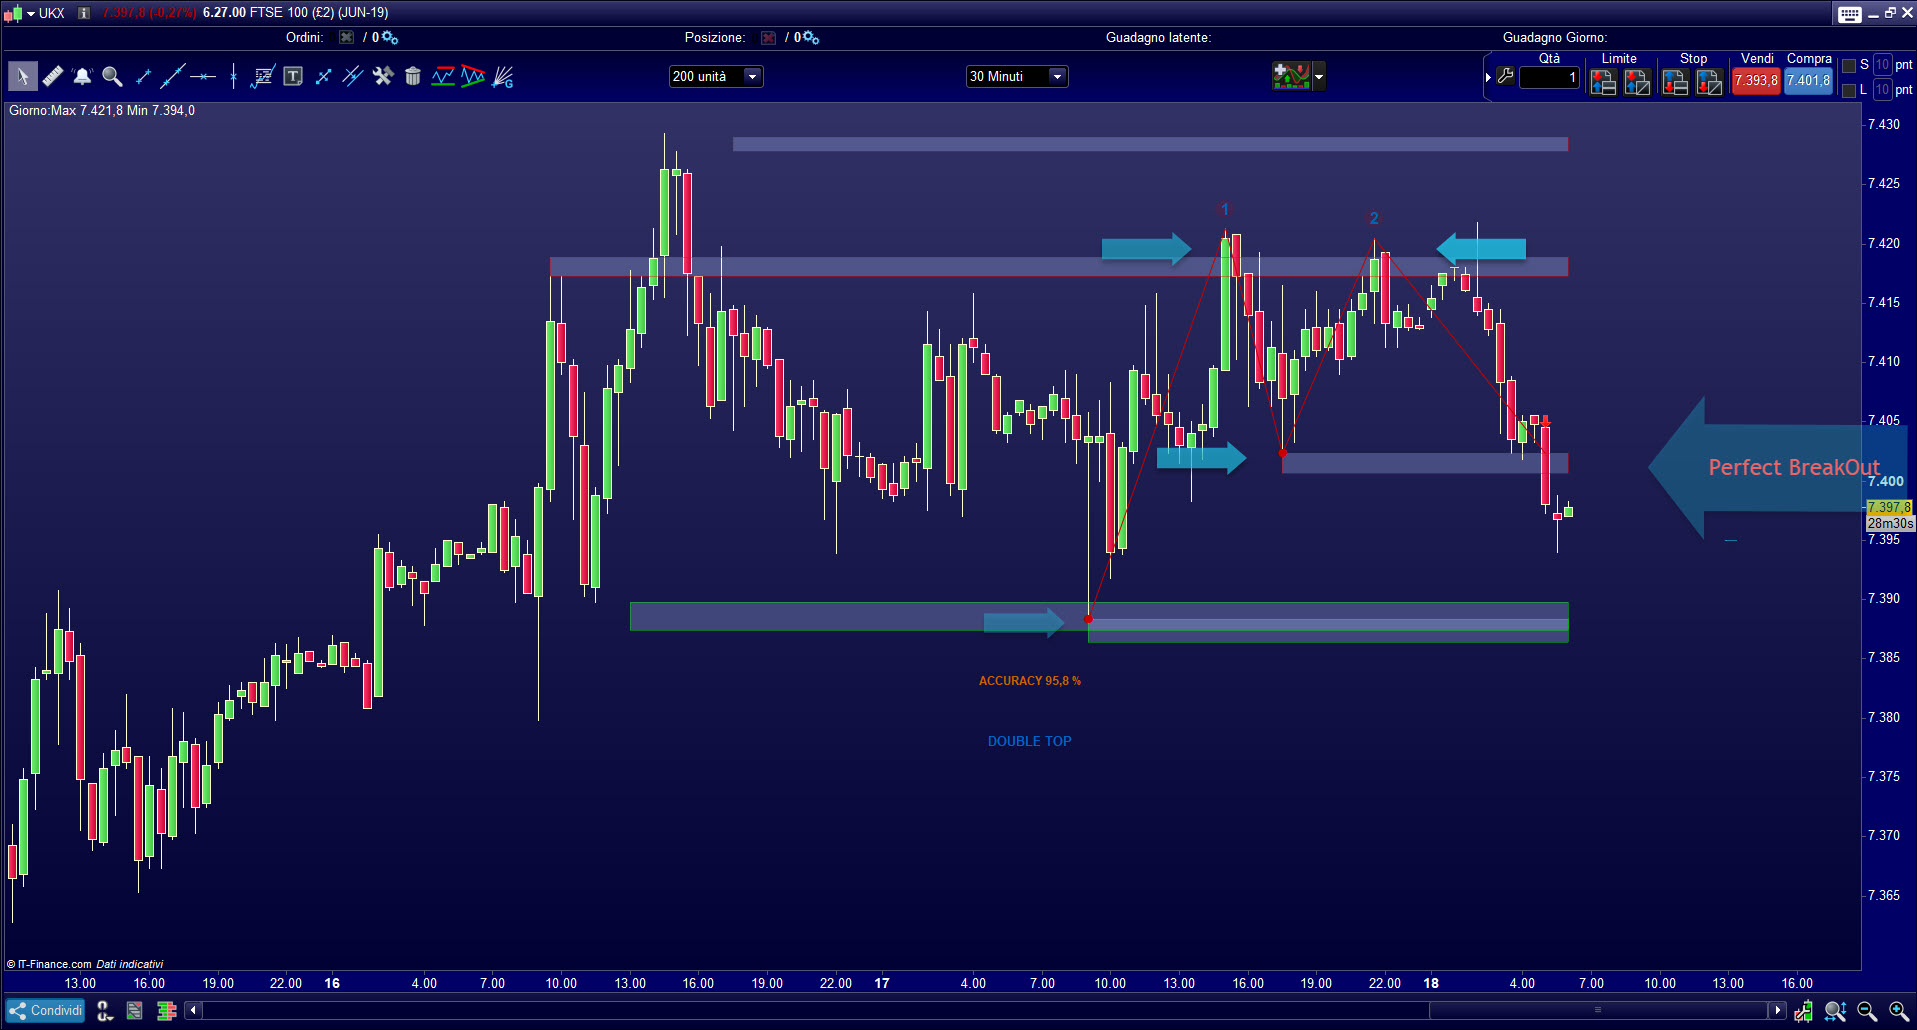
Volume data is essential for analyzing market trends. This ProRealTime indicator “Big Volume Level” detects volumes increase in real time, when volumes exceed a specified threshold in the indicator interface, new support or resistance levels are automatically reported on the chart as zones. These major support and resistance zones are plotted on the chart for the desired period of analysis.
The Support and Resistance areas (rectangles) are calculated by our algorithm to give an indication of the intensity of the identified volumes on each zone.
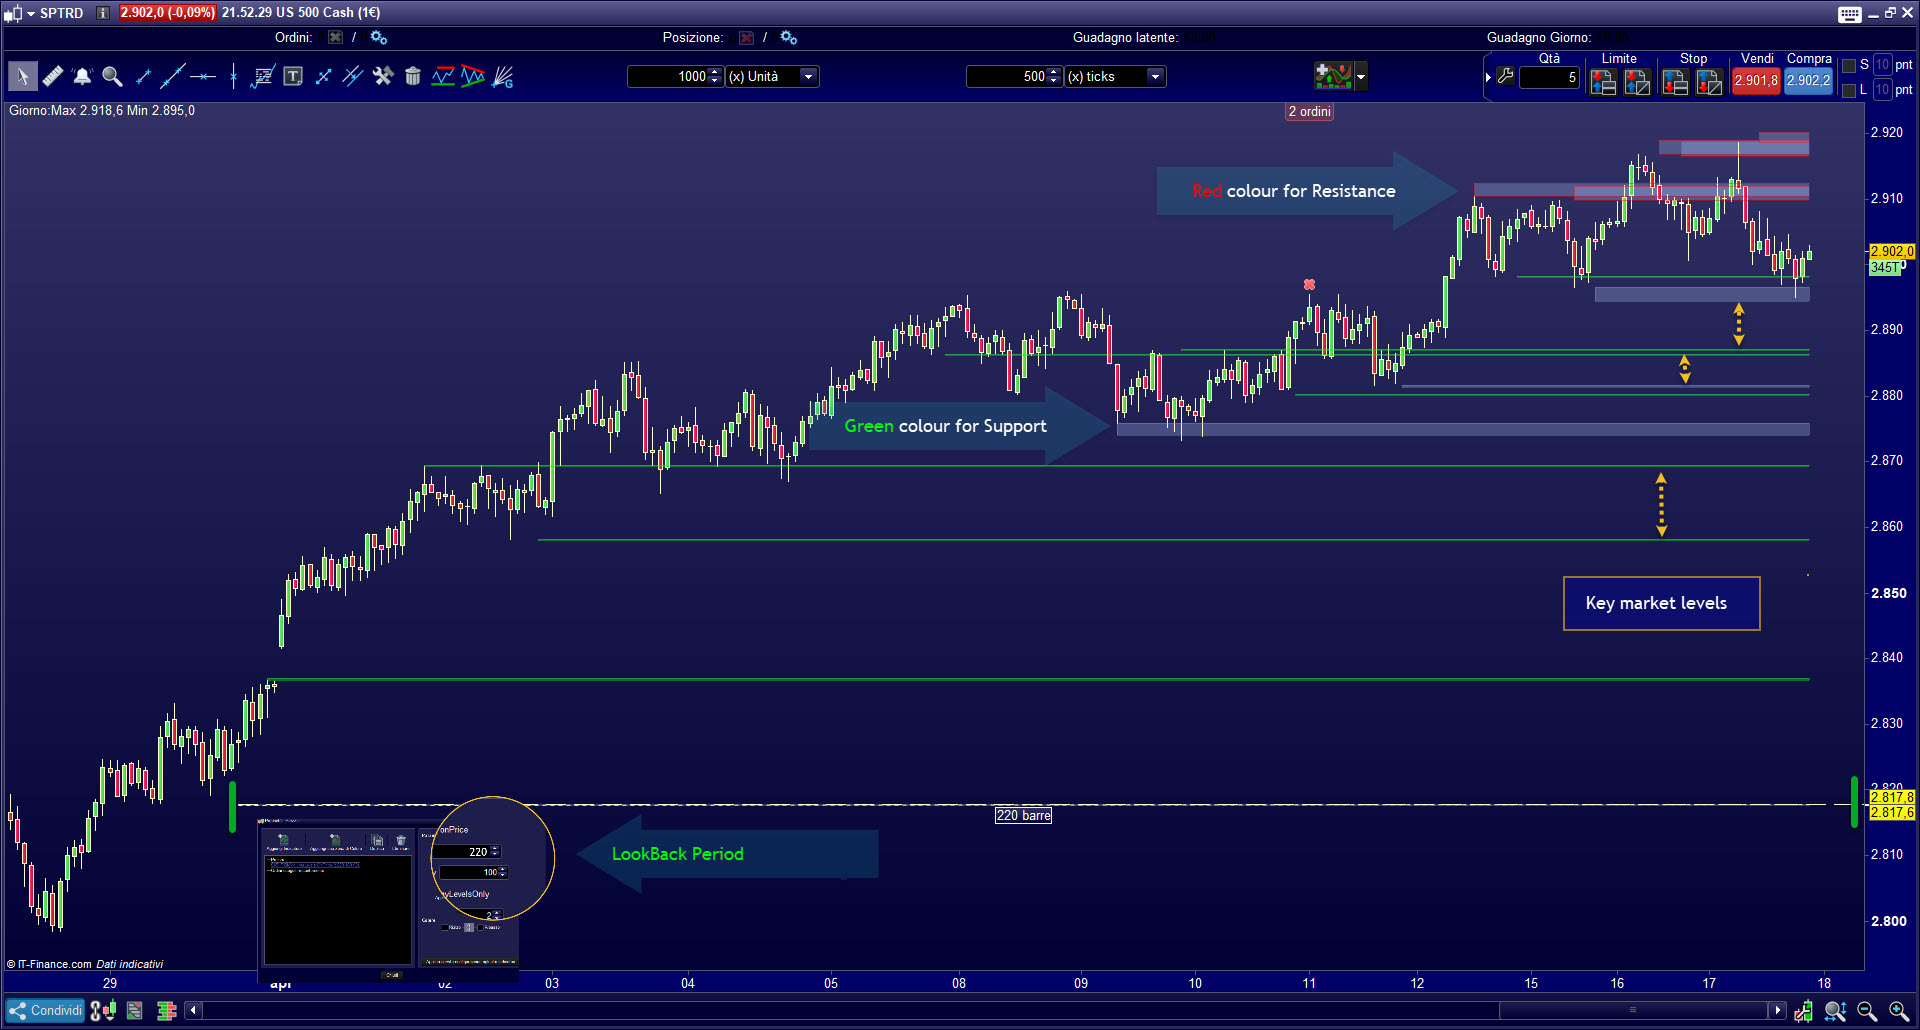
The color of the rectangle specify whether the area is a support or a resistance depending of the actual price.
Thus the measured values are key market levels, that could be considered as important levels to guide us through the market.
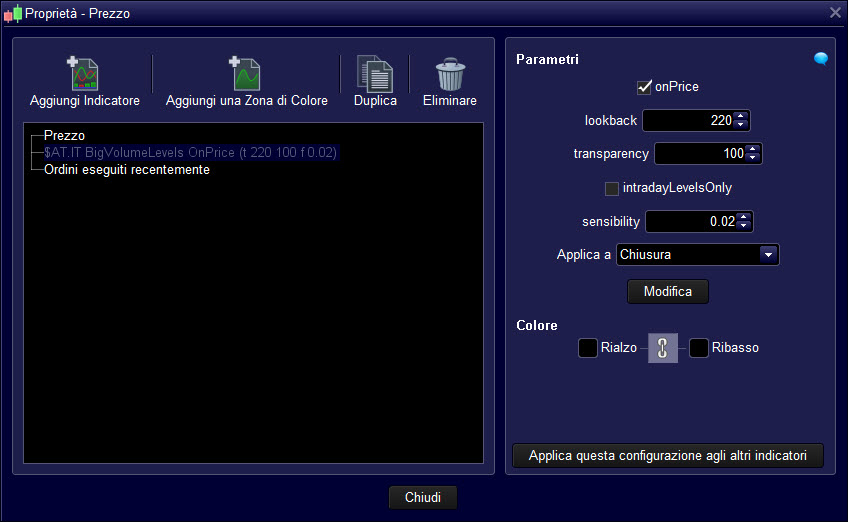
Using the sensitivity of the indicator, we can detect a greater or lesser number of data. By increasing the sensitivity of the indicator, the quantities of volumes needed to define a new zone will have to be larger, which consequently reduces the amount of new zones detected. Below we show some examples to understand the fundamental aspects of this must-have indicator.
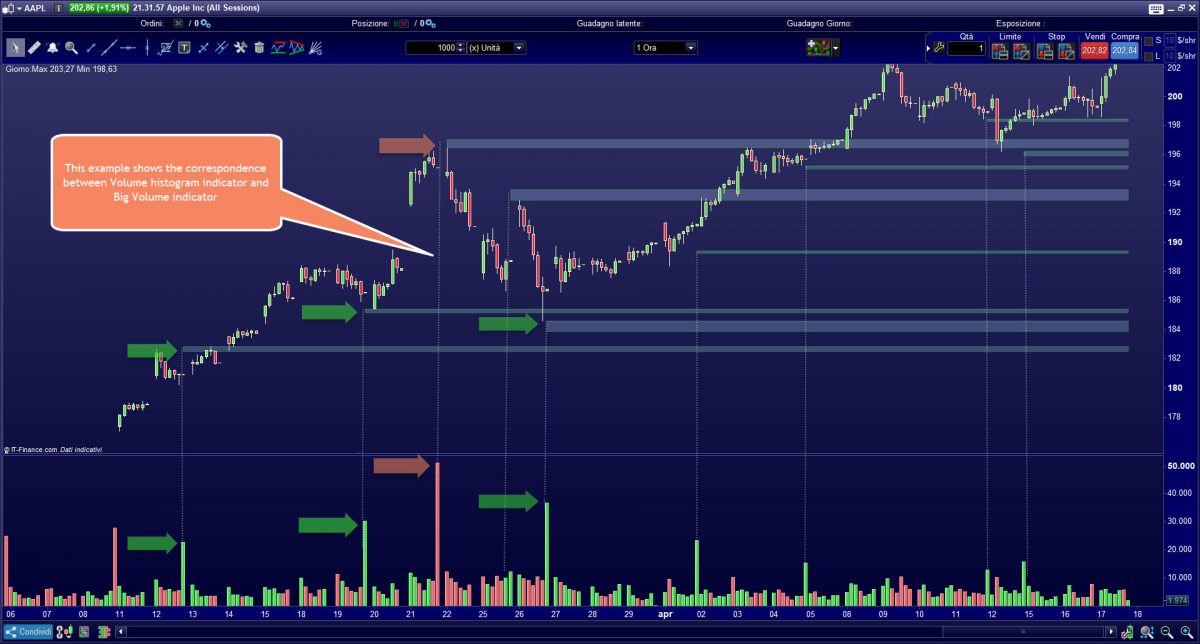
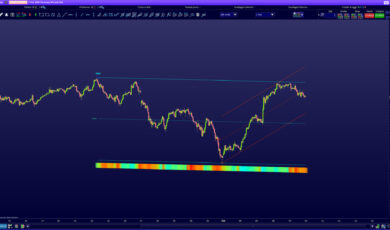
In this example, we show you where a significant volume area was detected, while the dotted line indicates the length of the analyzed period, ie the number of bars.
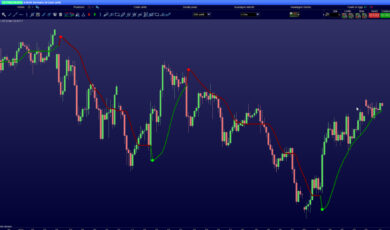
The sensitivity of the support and resistance detection algorithm is the main setting to adapt to increase or decrease the discovering of new key levels:
In the below pictures you can see how the sensitivity setting affect the quantity of detected zones:
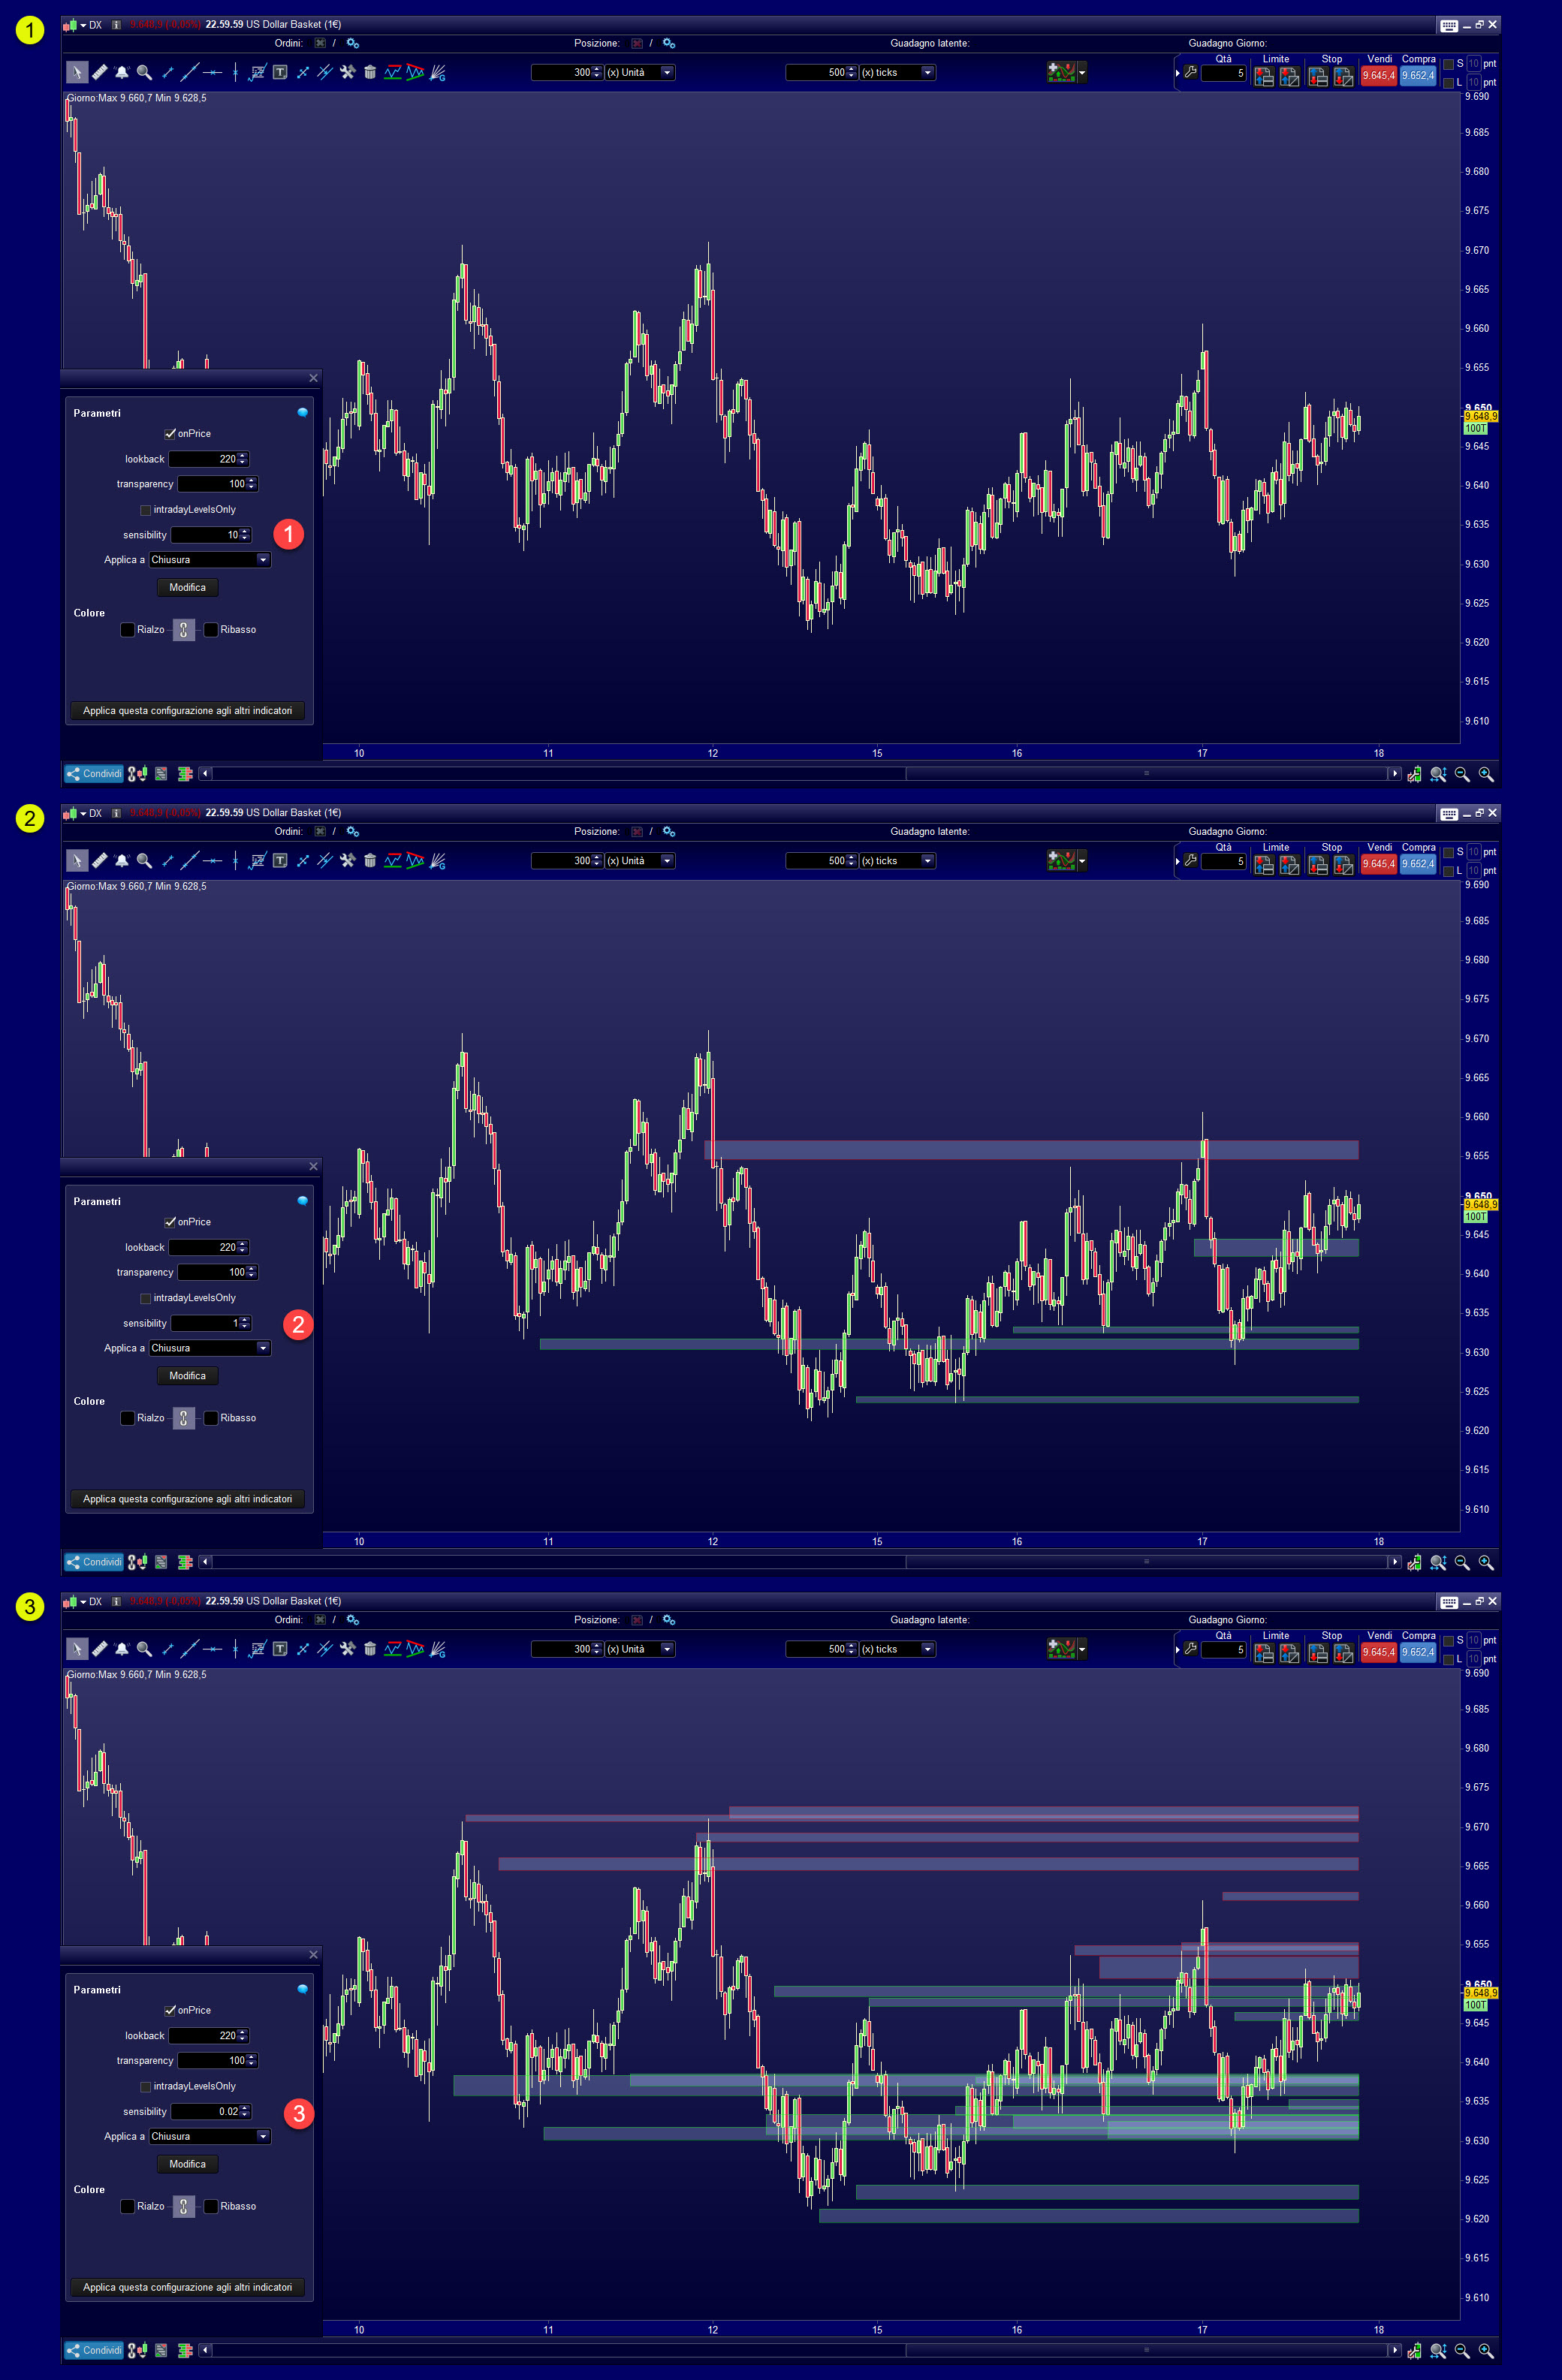
In this image we show you again how, as the sensitivity decrease, the values of the volumes detected by the indicator increase, and how the density of the lines creates a profile of volumes indicating key levels of the market.
For the intraday traders, the indicator adapt its own algorithm to suit the detection to the current day only, just check the option box in the settings:
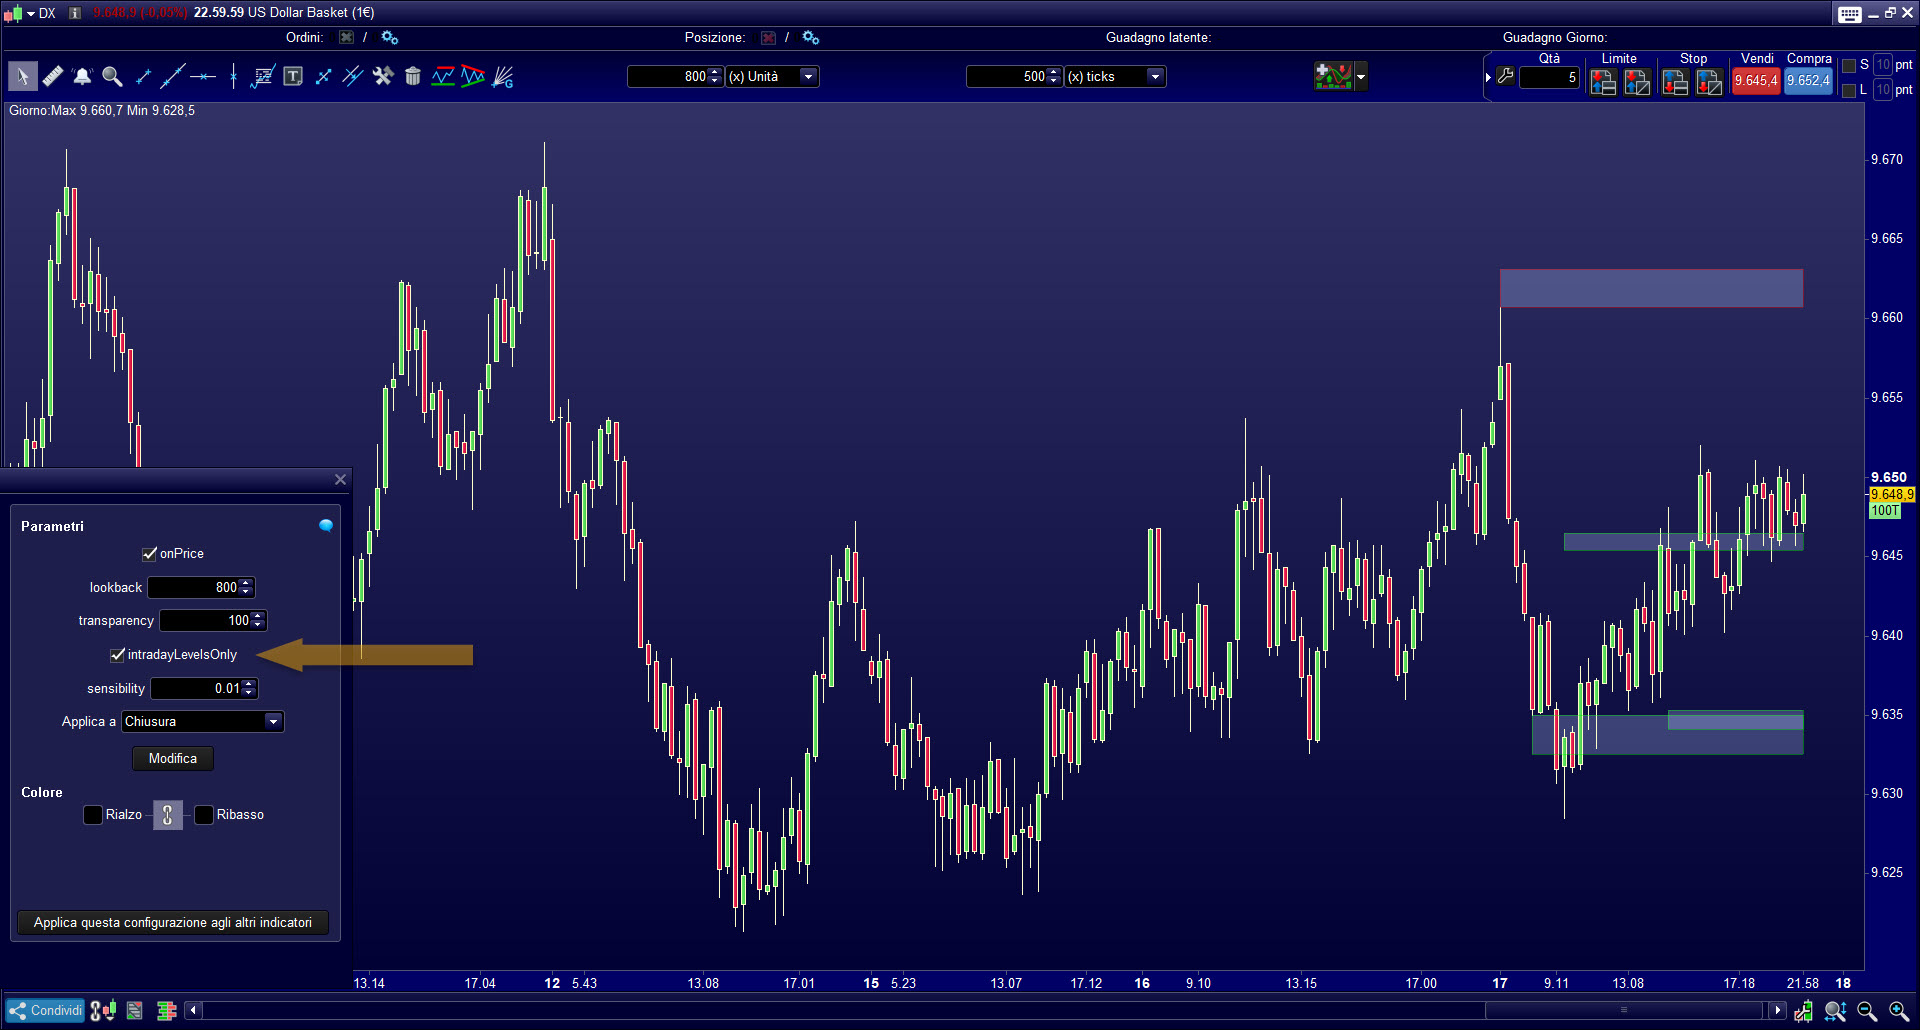
This indicator obviously works with any timeframe and any type of market.
HOW IT WORKS
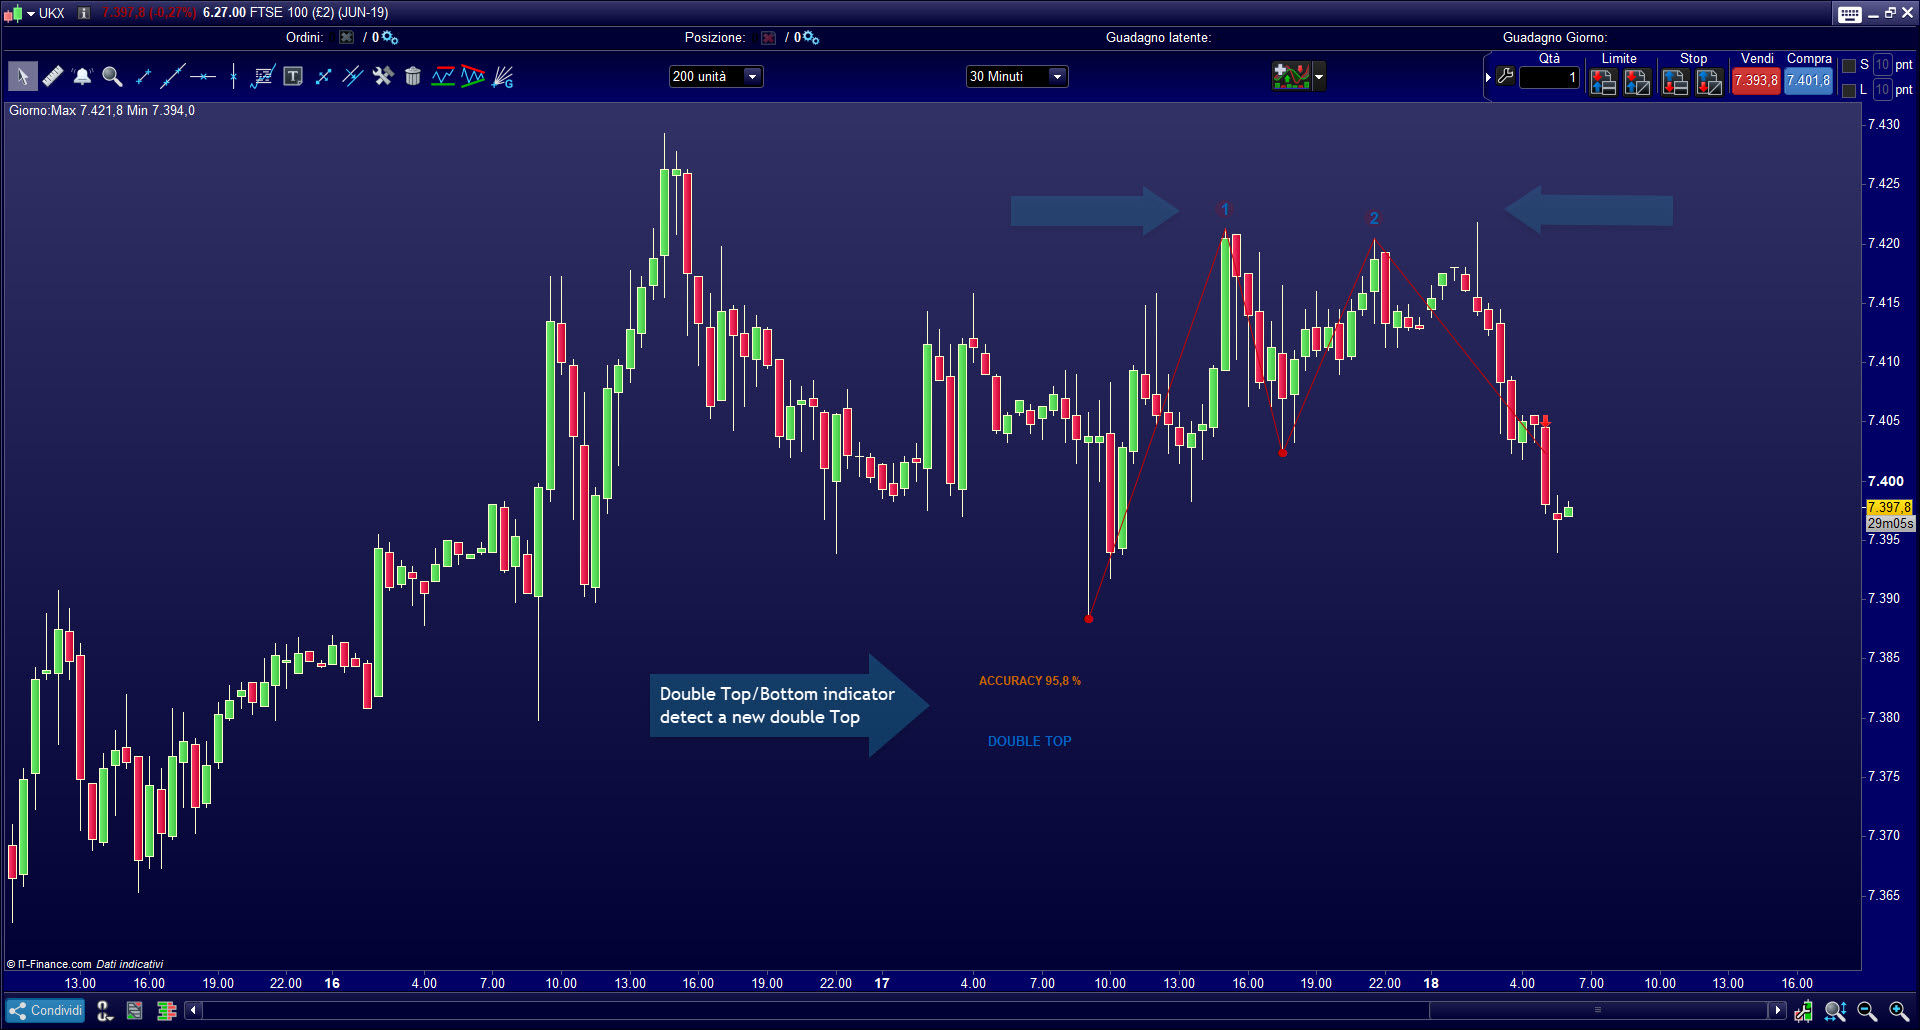
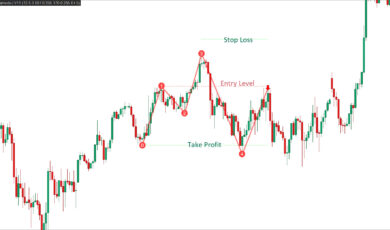
Identify supports and resistances, with a long or a short term price data history. Identify market profiles to precise your market entries and exit and define your takeprofit and stoploss with greater precision!
Below is an example of the management of a market order:
Advantages of using the “Big Volume Level” indicator
- Easy to find price key levels
- Automatically identifies the potential support and resistance zones!
- Define your stoploss and takeprofit with greater precision
- Compatible with all instruments
- Compatible with all ordinary timeframes and even on tick-charts!
- Compatible with Heikin ashi, Renko, Ticks, Kagi, Three Line Break, and more
- The indicator is completely customizable to suit your own trading style
- The indicator can be integrated into any indicator, using ProRealTime’s ProBuilder function
- The indicator can be integrated into any automated trading strategy, using ProRealTime’s ProBackTest and ProOrder function
This product works in any Futures, Forex or Stock/ETF Markets
Bewertungen
Es gibt noch keine Bewertungen.