
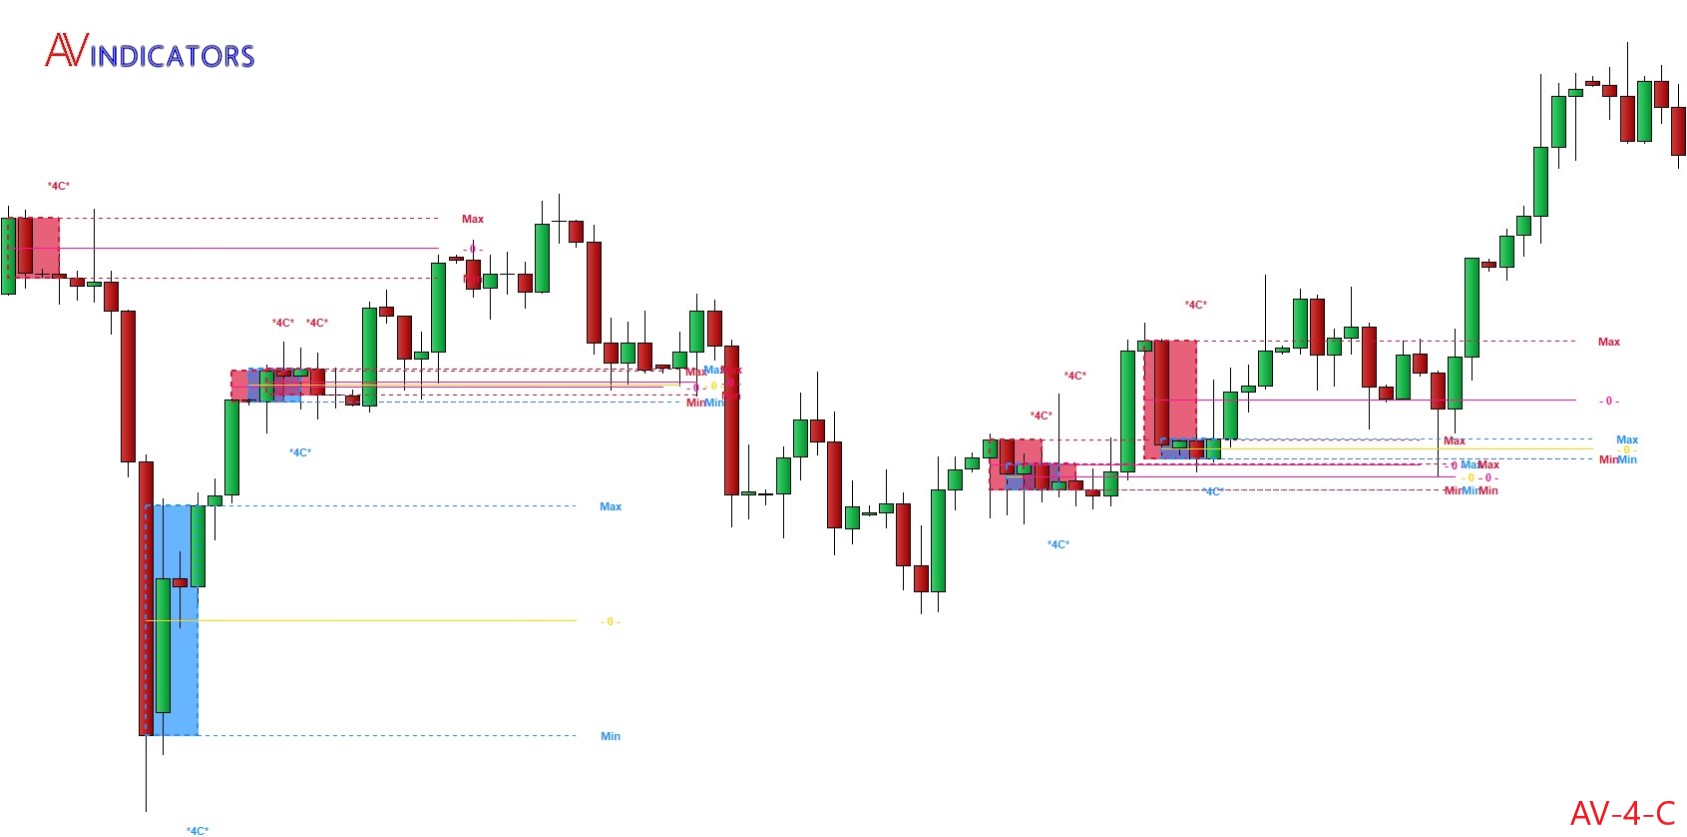
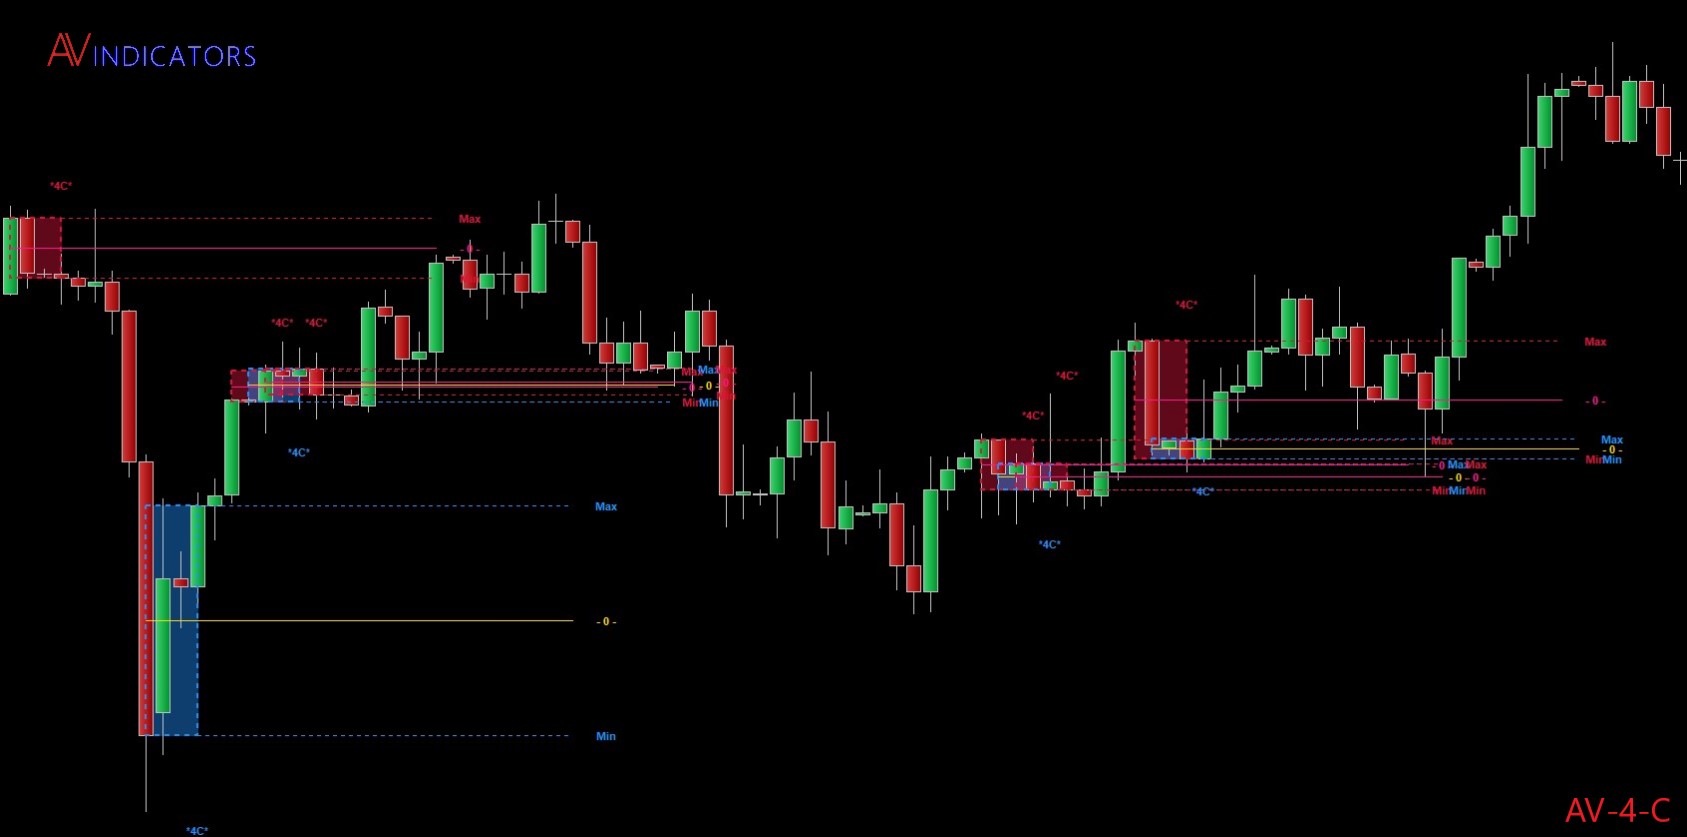
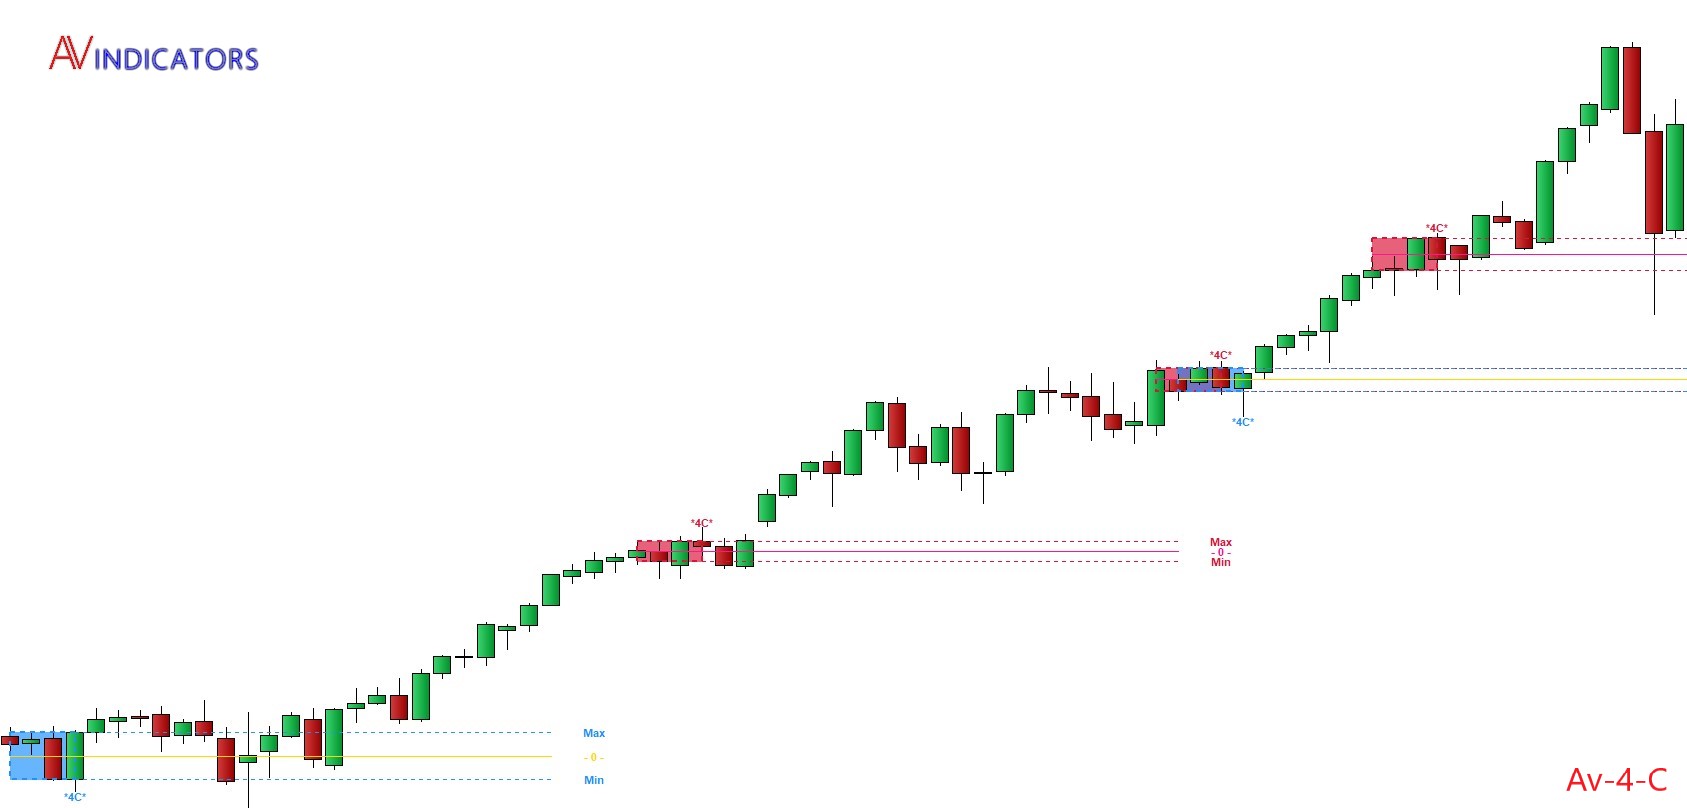

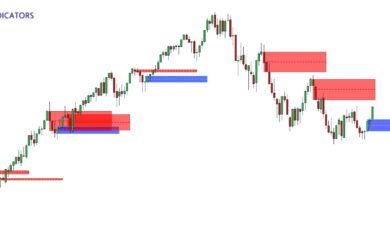
The indicator AV-4-C displays patterns created on 4 candles. These patterns identify potential upside or downside areas. Potential laterality, accumulation or distribution.
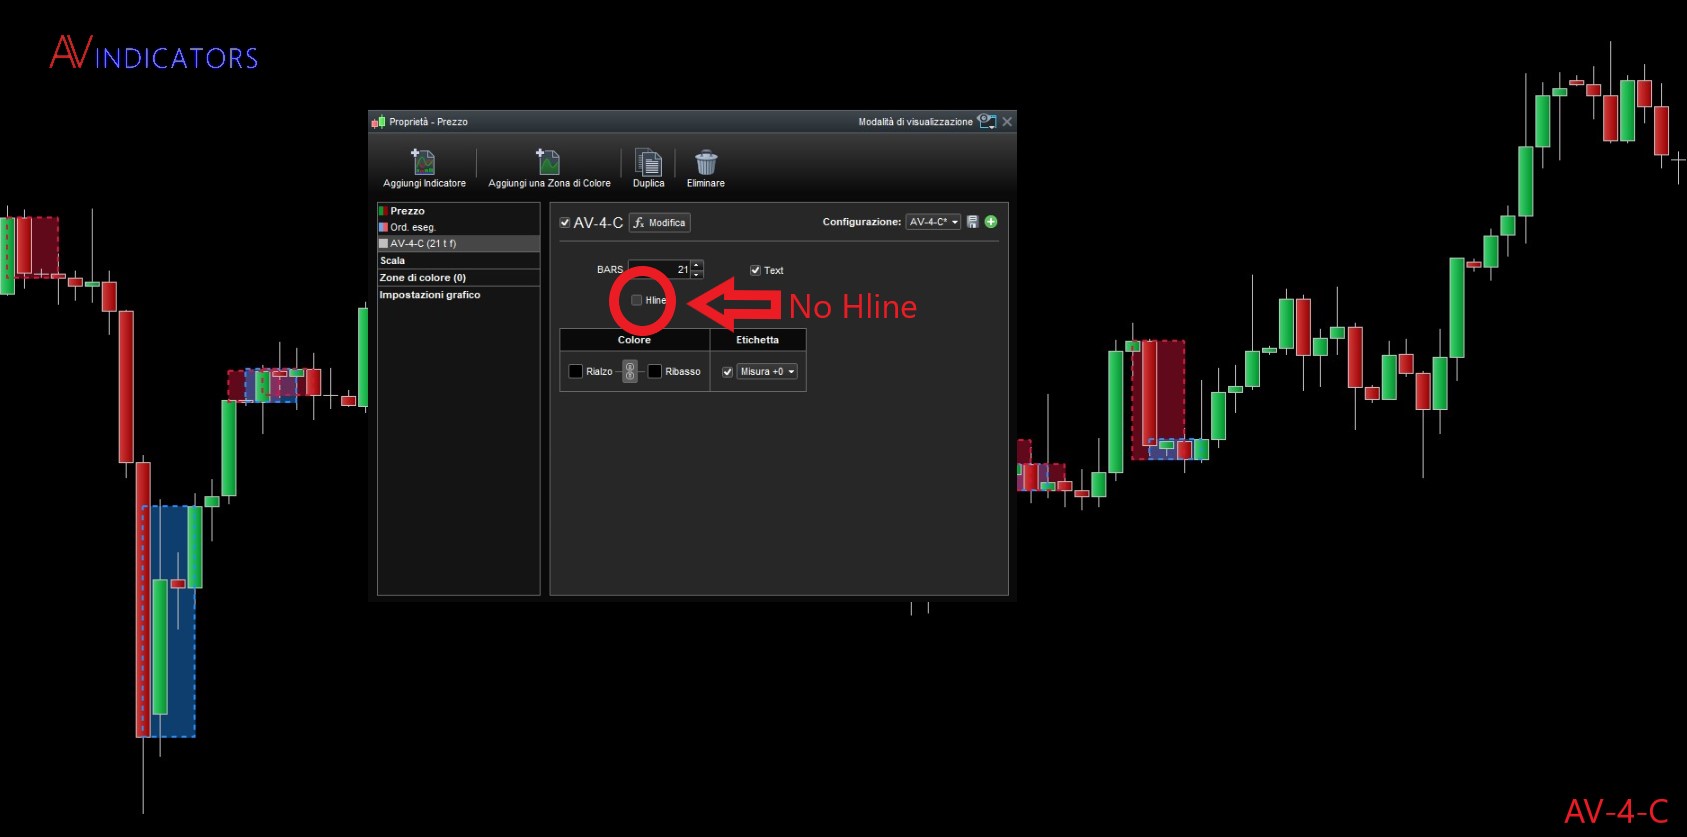
This type of Pattern, in many cases, overlap each other. The text “4C” on the chart, is visible on the HIgh of the last candle, with the pattern down. Visible on the Low of the last candle with the Pattern up. This will help you understand how the trend could change. Hlines are cyclical resistances and supports. As you can see.
If you want to try a demo of one of our indicators that you are interested in for five days, write to av.indicators@gmail.com indicating the name of the indicator you want to try. Use it, fall in love with it, buy it.
Valoraciones
No hay valoraciones aún.