Second edition
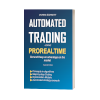
The present book is a complete revision of the previous version representing a real improvement for the reader. Most of the chapters have been rewritten, and many new thematics have been appended:
- Correlations between technical indicators
- Combinatorial and arrangement
- Chap recognition using Euclidian distance
- Multi-timeframes fractal correlation
- Voluntary under-optimization model
- Over-optimized strategy arbitrage
- + Source code of an automated trading strategy
- + Source code to recognize a Double Bottom
This book is calling to become a must-have reference work for anyone interested in trading system development using Prorealtime.
| Date of publication | 2022/04/28 |
| Editor | Self-publishing |
| Format | E-BOOK PDF |
| Number of pages | 638 |
What about the news?
1. How to choose the best technical indicator?
I will give you a source code that calculates the correlation between two technical indicators. That will help you better choose your indicators for manual trading as automated trading. Using uncorrelated indicators improves the market reading and the decision-making.
2. Find the best moving average crossing
You will find the best profitable moving average crossing thanks to an algorithm built on the arrangements without repetition. The source code is easy to use, and it can be applied to any trend indicator.
3. Chartist figure recognition
I completely rewrote this chapter. I provide you with three algorithms capable of recognizing any chartist figures, from the simplest to the most complex. The first algorithm works with correlation, the second with Euclidian distances, and the third with Hausdorff distance. Mathematic distances are particularly efficient with chap recognition. The source codes are detailed and explained. You simply have to put your preferred figure in the dataset to create your chartist indicator.
4. Multi-timeframe fractal arbitrage
It is a new chapter in which I introduce an arbitrage between two timeframes. The algorithm calls the multi-timeframe fractal correlations to anticipate a bullish reversal. This strategy works on most of the main indexes like the S&P500, the Dow Jones, or the Dax40.
5. Voluntary under-optimization model
This model is straightforward to understand and use. It consists of voluntary degrading the performance of a backtest to increase the probability of gains in the future.
6. Overfitted strategy arbitrage
It is the opposite of the previous model. An over-optimized strategy has more chance of losing in the future than winning. This model tries to turn the risk of loss into an expected gain. It consists of voluntarily over-optimizing a strategy to open reversal entry in the future. However, you will need to respect some rules to apply this model.
Table of Contents
Introduction
- What is algorithmic trading?
- Why have I chosen to create trading systems?
- What is the style of trading that I have chosen?
- An example of automated building entries
- Automated trading expectations
- Limitations and possibilities of automatic trading
- Differences between automatic and autonomous systems
- Unadaptability of automatic systems
- The problem of the unadaptability to the environment
- How to resolve the automated system’s unadaptability?
- The extreme “complexity versus simplicity”
- The management rules
- The global context
- The decision-making variables
- Why Prorealtime?
- The programming language of Prorealtime
- Properties of the programming language
- ProOrder Autotrading functioning
- On which assets can I launch a bot?
- The programming language of Prorealtime
Handling the Prorealtime platform
- Overview of the development environment
- Development and test environment
- Backtest result
- Execution following environment
- ProOrder Autotrading window
- Opening entries window
- Create and launch the first test
- Create a ProOrder system
- Probacktest and Automated Trading
- Probacktest & Automated trading editor
- Create by programming
- Explanation of example code lines
- First bloc
- Second bloc
- Create a ProOrder system
The great concepts of algorithmic trading
- The three pillars of automatic trading
- Efficiency
- Definition
- Loss of efficiency
- Maintain the efficiency of a system
- Concept of software engineering
- Effectiveness
- Definition of the effectiveness
- Complexity
- Classes of complexities
- Reduction of dimensionality
- Reduce the dimensionality thanks to the booleans
- The principal component analysis
- Conclusion about the dimensionality reducing
- Reduction of the granularity
- The Monté-Carlo algorithm
- Alpha-Beta pruning
- Effectiveness and complexity – For further
- The “ideal” number of technical indicators
- Effectiveness and complexity synthesis
- Performance
- What is the Performance?
- Involve the risk with the performance
- Sharpe ratio
- Be careful with the latent volatility
- Conclusion
- Efficiency
- Risk management and integration
- Risks related to the automated trading system
- Exposure to the financial risk
- Financial Risk integration
- Example of risk integration
- Trading and Gambling
- The heads or tails game
- Heads or tails game without fees
- The heads or tails game with fees
- The roulette gamble
- Roulette gamble without the green color
- The Martingale roulette gamble with the green color
- Conclusions Trading and Gambling
- The transaction cost
- The risk of a transaction
- The spread/expected gain ratio
- The heads or tails game
- Strategy versus Tactic
- Definitions of strategy and tactic
- What is a strategy?
- What is a tactic?
- Strategical approach
- Arbitrage opportunity
- Big guys versus little traders
- The actions of algorithms and robots
- The target prices
- The trading strategy cycles
- Conclusions about the strategical approach
- Tactical approach
- Zero-sum games
- Von Neumann Minimax theorem
- MiniMax Algorithm
- Is trading a zero-sum game?
- Why the tactical approach?
- Should the strategy approach be rejected?
- Tactic and strategy meshing
- Your two first tactical choices
- Choice of your broker
- Thin market versus thick market
- Definitions of strategy and tactic
- The five activities of algorithmic trading
- Automated strategy researches
- Automated systems design
- Development and unitary tests
- Backtest and validation
- Automated system management
I. Automated strategy research
- Decision tree
- Find an entry point
- Decision tree modelization
- Complete code of the research system
- Test running
- Short strategy version
- Source code for a short strategy with three indicators
- Running and interpretation of the result
- Combinatorial and arrangement
- Try all the crossing combinations
- Arrangements without repetition
- What is an arrangement?
- Find the best moving averages crossings
- Source code to find the best crossing
- Chartist figures recognition
- Recognition by correlation
- The steps of recognition by correlation
- Double bottom indicator source code
- Double bottom detection example
- Open a long entry after a double bottom
- Source code of the double bottom algorithm
- The limitation of the recognition by correlation
- The Euclidian Distances
- A few words on Euclid
- What is the Euclidian distance?
- Chap recognition using Euclidian distance
- Source code of the green hammer recognition
- Majority vote principle
- Generalization of the recognition algorithm
- Double bottom recognition using distances
- Source code of the double bottom recognition
- The limitation of the Euclidian distances
- The Hausdorff distance
- A few words on Hausdorff
- What is the Hausdorff distance?
- Hausdorff distance formula
- Sequences of the Hausdorff algorithm
- Source code of the Hausdorff distance recognition
- Conclusions about chartist figure recognition
- Recognition by correlation
- Multi-timeframes fractal correlation
- What is a fractal?
- The fractal on the market
- How to exploit fractals on the market?
- Calculate the correlation between two timeframes
- Source code to calculate a multi-timeframe correlation
- Source code of a multi-timeframe fractal arbitrage
- Conclusion about fractal arbitrage
- Push the boundaries of the strategies research
- Find an entry point
II. Automated trading system conception
- Creation cycle of an automated trading system
- The conception cycle
- Model of conception
- The Cascade model
- The V cycle model
- General conception
- Description of the strategy
- Decisional description
- Functional description
- Management rules description
- Example of a general conception
- Description of the strategy
- Detailed conception
- Pseudo-code example
III. Development of an automated trading system
- Integrate the transaction cost
- DAX spread table
- IG Market spread
- Global architecture of the robot
- “Parameters and initialization” Block
- “Entries opening” Block
- “Opened entries management” Block
- “Emergency stop” Block
- Parameters and initialization of the variables
- Definition of the parameters
- PRELOADBARS
- CUMULATEORDERS
- FLATBEFORE and FLATAFTER
- Management of the time frame
- Choice of the time frame
- Multi timeframe
- Rebuild a superior time frame
- The tick-by-tick mode
- Tick-by-tick mode and reliability of a backtest
- Perception and vision of the market
- Human perception
- Market perception by a system
- Define an economic and market calendar
- Market trading hours
- Market trading days
- Vacancy and closed market days
- Particular days
- Saturday and Sunday cases
- Create a “calendar condition”
- Central bank days
- Limit the number of openings by day
- Source code to limit the number of openings by a day
- The ideal number of entries by day
- Initialization and reinitialization of the variables
- INTRADAYBARINDEX
- Undefined initialization
- Definition of the parameters
- The types of markets
- Identify the type of the market
- The six types of markets
- End of the trend and acceleration
- Choose a type of market
- Measure the market trend
- Trend indicator slope
- Moving average
- Linear regression
- Linear regression versus Moving average
- Quadratic regression
- Smoothing – lag adjustment of the technical indicators
- The three technical configurations generating errors
- Eliminate the false signals thanks to the smoothing
- The Smoothing/lag ratio
- Avoid the false signals using the standard-deviations
- Reflexion on the linear and polynomial regressions
- Example of bullish trend market detection
- Interpretation of the result
- Measurement of the market volatility
- Measurement of the historical volatility
- Implicit volatility
- Market characteristics of the raw materials
- Supply and demand balance
- The seasonality
- The storage capacities
- Conclusions of raw materials
- Measure the acceleration of the market
- Measuring price direction
- Measuring price acceleration
- Measure the acceleration of other indicators
- Identify the type of the market
- Open an entry
- Configure the stop-loss and the target
- Static positioning of the stop-loss and the target
- Dynamic setting of the stop-loss and the target
- The Grid algorithms
- Algorithm of stop-loss range adjustment
- My choice about stoploss and target positioning
- Opening entry instructions
- Structure of the opening entry instruction
- Open a long or short entry
- Number of contracts by order
- The types of entry opening orders
- Trigger range orders
- The validity period of the LIMIT and STOP orders
- The time between two entries
- Entry status of your trading system
- How to use the entry state variables?
- Entry opening conditions
- Market conditions
- Conditions of your trading strategy
- Configure the stop-loss and the target
- Manage an opened entry
- Stop-loss and target initialization
- The four types of stop-losses
- The four types of targets
- Example of stop-loss and target positioning
- Stoploss and target management
- Modification of the stop-loss and the target
- Inactivation of stop-loss and target
- Trailing stop-loss
- Program a trailing stop-loss
- The two types of trailing stop-loss
- Trailing stop algorithm
- Reinitialization of the variables
- Loss of efficiency risk
- Unexpected entry opening risk
- Create a reset block
- Target overwriting
- Chose a moving average as a target
- Algorithm of the Hundreds
- The indicator of the hundreds
- Algorithm of the rounded price detection
- Choose the hundred as a target
- Monthly pivot
- Calculation method of the pivot
- Monthly FIBONACCI pivots
- Profit securing algorithm
- Needed variables for the profit securing algorithm
- Management and adjustment of the STOP order
- Replace the target with a stop order
- The target order weakness
- Profit securing conditions
- Algorithm of the conditional stop selling activation
- Enrich the algorithm of the stop selling order activation
- Stop-loss and target initialization
- Emergency stop of a trading system
- The QUIT instruction
- Warning on the QUIT instruction
- Example of a QUIT instruction
- When to stop a trading system?
- Stop due to excessive volatility
- Stop due to breakout of support
- Stop due to excessive losses
- The QUIT instruction
IV. Analysis of the backtests
- Launch a backtest on Prorealtime
- Reading of a backtest result
- The analysis metrics of a backtest
- Gains and losses
- Distribution of the trades
- Times
- Advanced widgets
- The analysis metrics of a backtest
- Measure the efficiency of a trading system
- Identify the common denominator
- Is your trading system over-optimized?
- The two main risks of over-optimization
- Example of over-optimization by an excessive precision
- Example of over-optimization by generalization error
- Global standard-deviation of your strategy
- Too large standard deviation
- Acceptable standard deviation
- Earnings distribution
- Too concentrated earnings distribution
- Dispersed earnings distribution
- The measure of Tracking Error
- Tracking error of a strategy
- How to interpret the tracking error?
- The profit/loss ratio
- Too low profit/loss ratio
- Consequences of a too low profit/loss ratio
- Profit securing
- Time in the market
- The standard deviation of time in the market
- The time in the market increasing
- Duration of latent loss
- The first visual controls summary
- The two main risks of over-optimization
- The stress-tests
- Spread increase
- How to conduct this stress test?
- Simulation of spread increasing
- Simulation running with Python
- Simulation of spread increasing on Probacktest
- Over-fitted strategy behavior
- Under-fitted strategy behavior
- Summary of spread increasing simulations and tests
- Trigger stop loss by a single point
- Why do this test?
- Method of the test
- Generalization of this methodology
- Trigger stop-loss summary
- Simulate the back to heads or tails
- Asymmetrical strategy example
- Back to heads or tails of an asymmetrical strategy
- The example of the symmetrical strategy
- Back to heads or tails of a symmetrical strategy
- Make your simulations thanks to Python
- Conclusion about back to heads or tails test
- Series of losses and worst possible case
- Estimate the series of losses cost
- Worst possible case simulation
- Flash crack simulation
- EUR/CHF Flash crack of 2015/01/15
- Stress-tests summary
- Spread increase
- Optimization of the variables
- Optimizer of the variable functioning
- Launch the optimizer of the variables
- Open the window of the optimizer
- Optimizer window
- Optimize a variable
- Add a variable to the optimizer
- Configure the interval and the step
- Run the optimizer
- Reading the result of the optimizer
- Optimization of the variables and tick-by-tick mode
- Sort the result of the optimizer
- Deeping the interval of values
- The orphan values
- How to know if a value is an orphan?
- Orphan values conclusion
- The Gradient Descent algorithm
- Concepts and definitions
- Definition of the Gradient-Descent algorithm
- Convex and non-convex functions
- Mean Squared Error
- Cost function
- The Cost of error
- Local and global minimum
- Local and global maximum
- Why use the Gradient-Descent algorithm?
- How to use the Gradient Descent algorithm?
- Gains evolution
- The gain curve
- Concave adjustment of the result using Excel
- Create a chart thanks to Excel
- Localize the global maximum
- Choose a value
- The limits of the Gradient Descent algorithm
- The displacement of the minimums and the maximums
- Gradient Descent Summary
- Concepts and definitions
- Walk-Forward Optimization
- Concepts and definitions
- What about the Walk-Forward Optimization?
- Temporal series
- Training set
- Validation set
- Walk-Forward Efficiency
- Run a Walk-Forward Optimization
- Activate the Walk-Forward
- First Walk-Forward optimization result
- First interpretation of the result
- Second Walk-Forward optimization
- Second Walk-Forward optimization result
- Second interpretation of the result
- Unique event cancellation
- Third interpretation of the result
- Interpretation of the Walk-Forward optimization result
- The limits of the Walk-Forward optimization
- Walk-Forward optimization Summary
- Concepts and definitions
- Stochastic modeling
- Concepts and definitions
- Definition of the stochastic test
- Purpose of the stochastic test
- Application of the test on Prorealtime
- How to process stochastic modeling on Prorealtime?
- Validation requirements of the test
- What are we trying to find?
- Unitary test of stochastic modeling
- Initial problematic
- Mini trend-following strategy example
- The unitary stochastic modeling goal
- Unitary test running
- Interpretation of the result
- Global Stochastic modeling test
- Global Stochastic modeling test goal
- Global test running
- Result interpretation
- Result of the global stochastic modeling test
- Generalization of the stochastic modeling
- The limitations of the stochastic modeling
- Conclusion about the stochastic modeling
- Concepts and definitions
- GD-SM Optimization model
- Presentation of the GD-SM model
- Definition of the GD-SM optimization
- Why use the GD-SM optimization?
- Application of the classical model to the financial market
- Functioning of the GD-SM modeling
- Selection of the possible values
- Validation of possible values
- The limits of the GD-SM
- Summary of the GD-SM optimization
- Presentation of the GD-SM model
- Voluntary under-optimization model
- Example of an automated trading strategy
- Description of the trading strategy
- Source code of the entry openings
- Optimization sequence
- Test period division
- Stop-loss and target optimization
- Optimization of the stop-loss
- Result of the stop-loss optimization
- Optimization of the target
- Target optimization preparation
- Result of the target optimization
- Overfitted configuration of the strategy
- Result of the overfitted backtest
- Backtest and reality comparison
- Find the fair optimization of a trading system?
- Deteriorate the equity curve of the backtest
- Under-optimize the stop-loss and the target
- Result of the under-optimized backtest
- Validation of the optimization in the future
- The limitations of the under-optimization model
- Risk management accordance
- Definition of an “under-optimized” value
- What parameters need to be under-optimized?
- Voluntary under-optimization summary
- Example of an automated trading strategy
- Over-optimized strategy arbitrage
- What is an over-optimized strategy arbitrage?
- How to over-optimize a strategy?
- Arbitrage result
- Interpretation of the result
- Model of over-optimized strategy arbitrage
- Entry opening after the entry point
- Entry opening delayed
- Add a delay before the opening
- Add a time condition
- Example of strategy with delayed entries
- Source code of a delayed trend following strategy
- Optimizer of the variable running
- Interpretation of the result
- Entry opening delayed
- Build a position in the market
- Why build a position?
- Risk smoothing
- Countering the stoploss hunt
- How to build a position?
- Why separate your systems to build a position?
- The rules to build a position
- Choose an appropriate strategy
- Define an opening range
- Recheck the market conditions
- Source code to build a position
- Example of position building
- Example of a built position
- Why build a position?
- Efficiency environment
- Concept and definition
- Limit the risk of uncertainty
- The equation of the efficient environment
- The voluntary under-optimization of the system
- Management of trading systems
- The limitation to the known market
- Normal functioning of the market
- Normal working condition
- The unprecedented events
- Closed or broken markets
- Quotation problems
- Null or very few volumes
- Detect the without body candles
- Is my trading strategy becoming obsolete?
- The cycle of a trading strategy
- Automated strategy lifetime
- Relationship between the timeframe and the lifetime
- The obsolescence signs
- The increase in the time in the market
- The increase of the time in latent loss
- The increase in the variance of the return
- The spread increase retest
- The stop-loss is too near to a support
- The market dangerously comes near your stop-loss
- Backtest summary
- The more probable behavior of a trading system
V. Management of the automated trading systems
- Acceptance tests of the automated trading systems
- The acceptance recipe
- Example of an acceptance recipe
- Acceptance recipe of the overfitting risk management
- The production launching steps
- The validation of the prerequisites
- Validation of the acceptation
- Automated trading preferences
- Details of the trading system
- Risk management
- The putting in production
- Relaunch a backtest
- Send the trading system to ProOrder
- Start the robot
- Confirm the launch
- Activation and verification after production launching
- The validation of the prerequisites
- Opened entry monitoring
- Create a specific interface dedicated to the monitoring
- The ProOrder AutoTrading window
- Opened entries window
- Price charts
- My dedicated interface to the system management interface
- Manually regain an entry
- Why manually regain an entry?
- How to manually regain an opened entry?
- Crash of an automated trading system
- Create a specific interface dedicated to the monitoring
- Manage the technical incidents
- The different types of incidents
- What to do in case of quotation failure?
- Prepare your action plan
- Quotation failure from a marketplace
- Quotation failure of derivatives
- What to do in case of trading safeguards activation?
- Exploding of the spread
- What to do in case of network failure?
- Have a second network connection
- Contact the customer service
- What to do in case of an automated trading system crash?
- Infrastructure monitoring
- IG trading platform status
- Marketplace status
- The continual checking of the trading system efficiency
- The continued test running
- Analysis of opened entries
- Know the not managed and not tested events
- Strategy management using z-score
- Management methods of trading systems
- The series of losses risk
- Description of the decision model
- Calculation and measure of the z-score
- Calculation of the z-score in Excel
- Z-score management rules
- Remind about the z-score interpretation
- Decision threshold to stop a strategy
- Management rules to stop a strategy
- Management rule to stop a strategy
- Management rule to start a new strategy
- Example of the z-score using on a real account
- The limits of the z-score using
Overall conclusions
References and Bibliography
Annex
- Source code to find a trading strategy
- Source code to four technical indicators
- Source code to five technical indicators
- Five moving averages crossings
- Chartist indicator
- Euclidian recognition of the green hammer
- Complete source code of an automated strategy


dag.berggren (Verifizierter Besitzer) –
Egal, ob Sie Anfänger sind oder sich schon seit einigen Jahren mit dem automatisierten Handel beschäftigen, dieses Buch vermittelt ein umfassendes Verständnis für die Bedeutung des Backtestings. Das Buch vermittelte mir ein viel besseres Verständnis für alle Schritte, die in das Backtesting einbezogen werden sollten, um die Genauigkeit der Algorithmen zu verbessern. Ein Teil des Buches ist recht fortgeschritten, aber das meiste davon kann man direkt auf den eigenen Handel anwenden, selbst als Anfänger. Für mich, der ich seit über zwei Jahren automatisches Trading betreibe und mich immer noch als Anfänger betrachte, war es absolut perfekt und ich kann es wirklich empfehlen. Dag Berggren
Michel Lempereur (Verifizierter Besitzer) –
Ein spannendes, umfassendes, sehr klares, didaktisches Buch auf sehr hohem Niveau, das einen sehr guten Überblick über den automatisierten Handel und seine unverzichtbaren Konzepte gibt, die es zu verinnerlichen gilt, kurzum ein Buch, das in der Bibliothek eines jeden Traders nicht fehlen darf.
Peter Dazeley (Verifizierter Besitzer) –
Das Prorealtime-Programmierhandbuch erklärt nicht im Detail, wie der Code funktioniert. Dieses Buch füllt einige Lücken und enthält eine ganze Reihe von Beispielen und Ideen. Es hat sich schnell bezahlt gemacht, allein durch die Verwendung der ‘QUIT’-Anweisung. Ich finde es sehr hilfreich.