

All Main Supports & Resistances
This indicator will allow you to visualize instantly all possible trading areas which are :
- Main horizontal supports and resistances
- Trend Channel
- Open Gaps
- Moving Average 200 periods
- Fibonacci levels
- Monthly Pivots Points & Previous Month High/Low
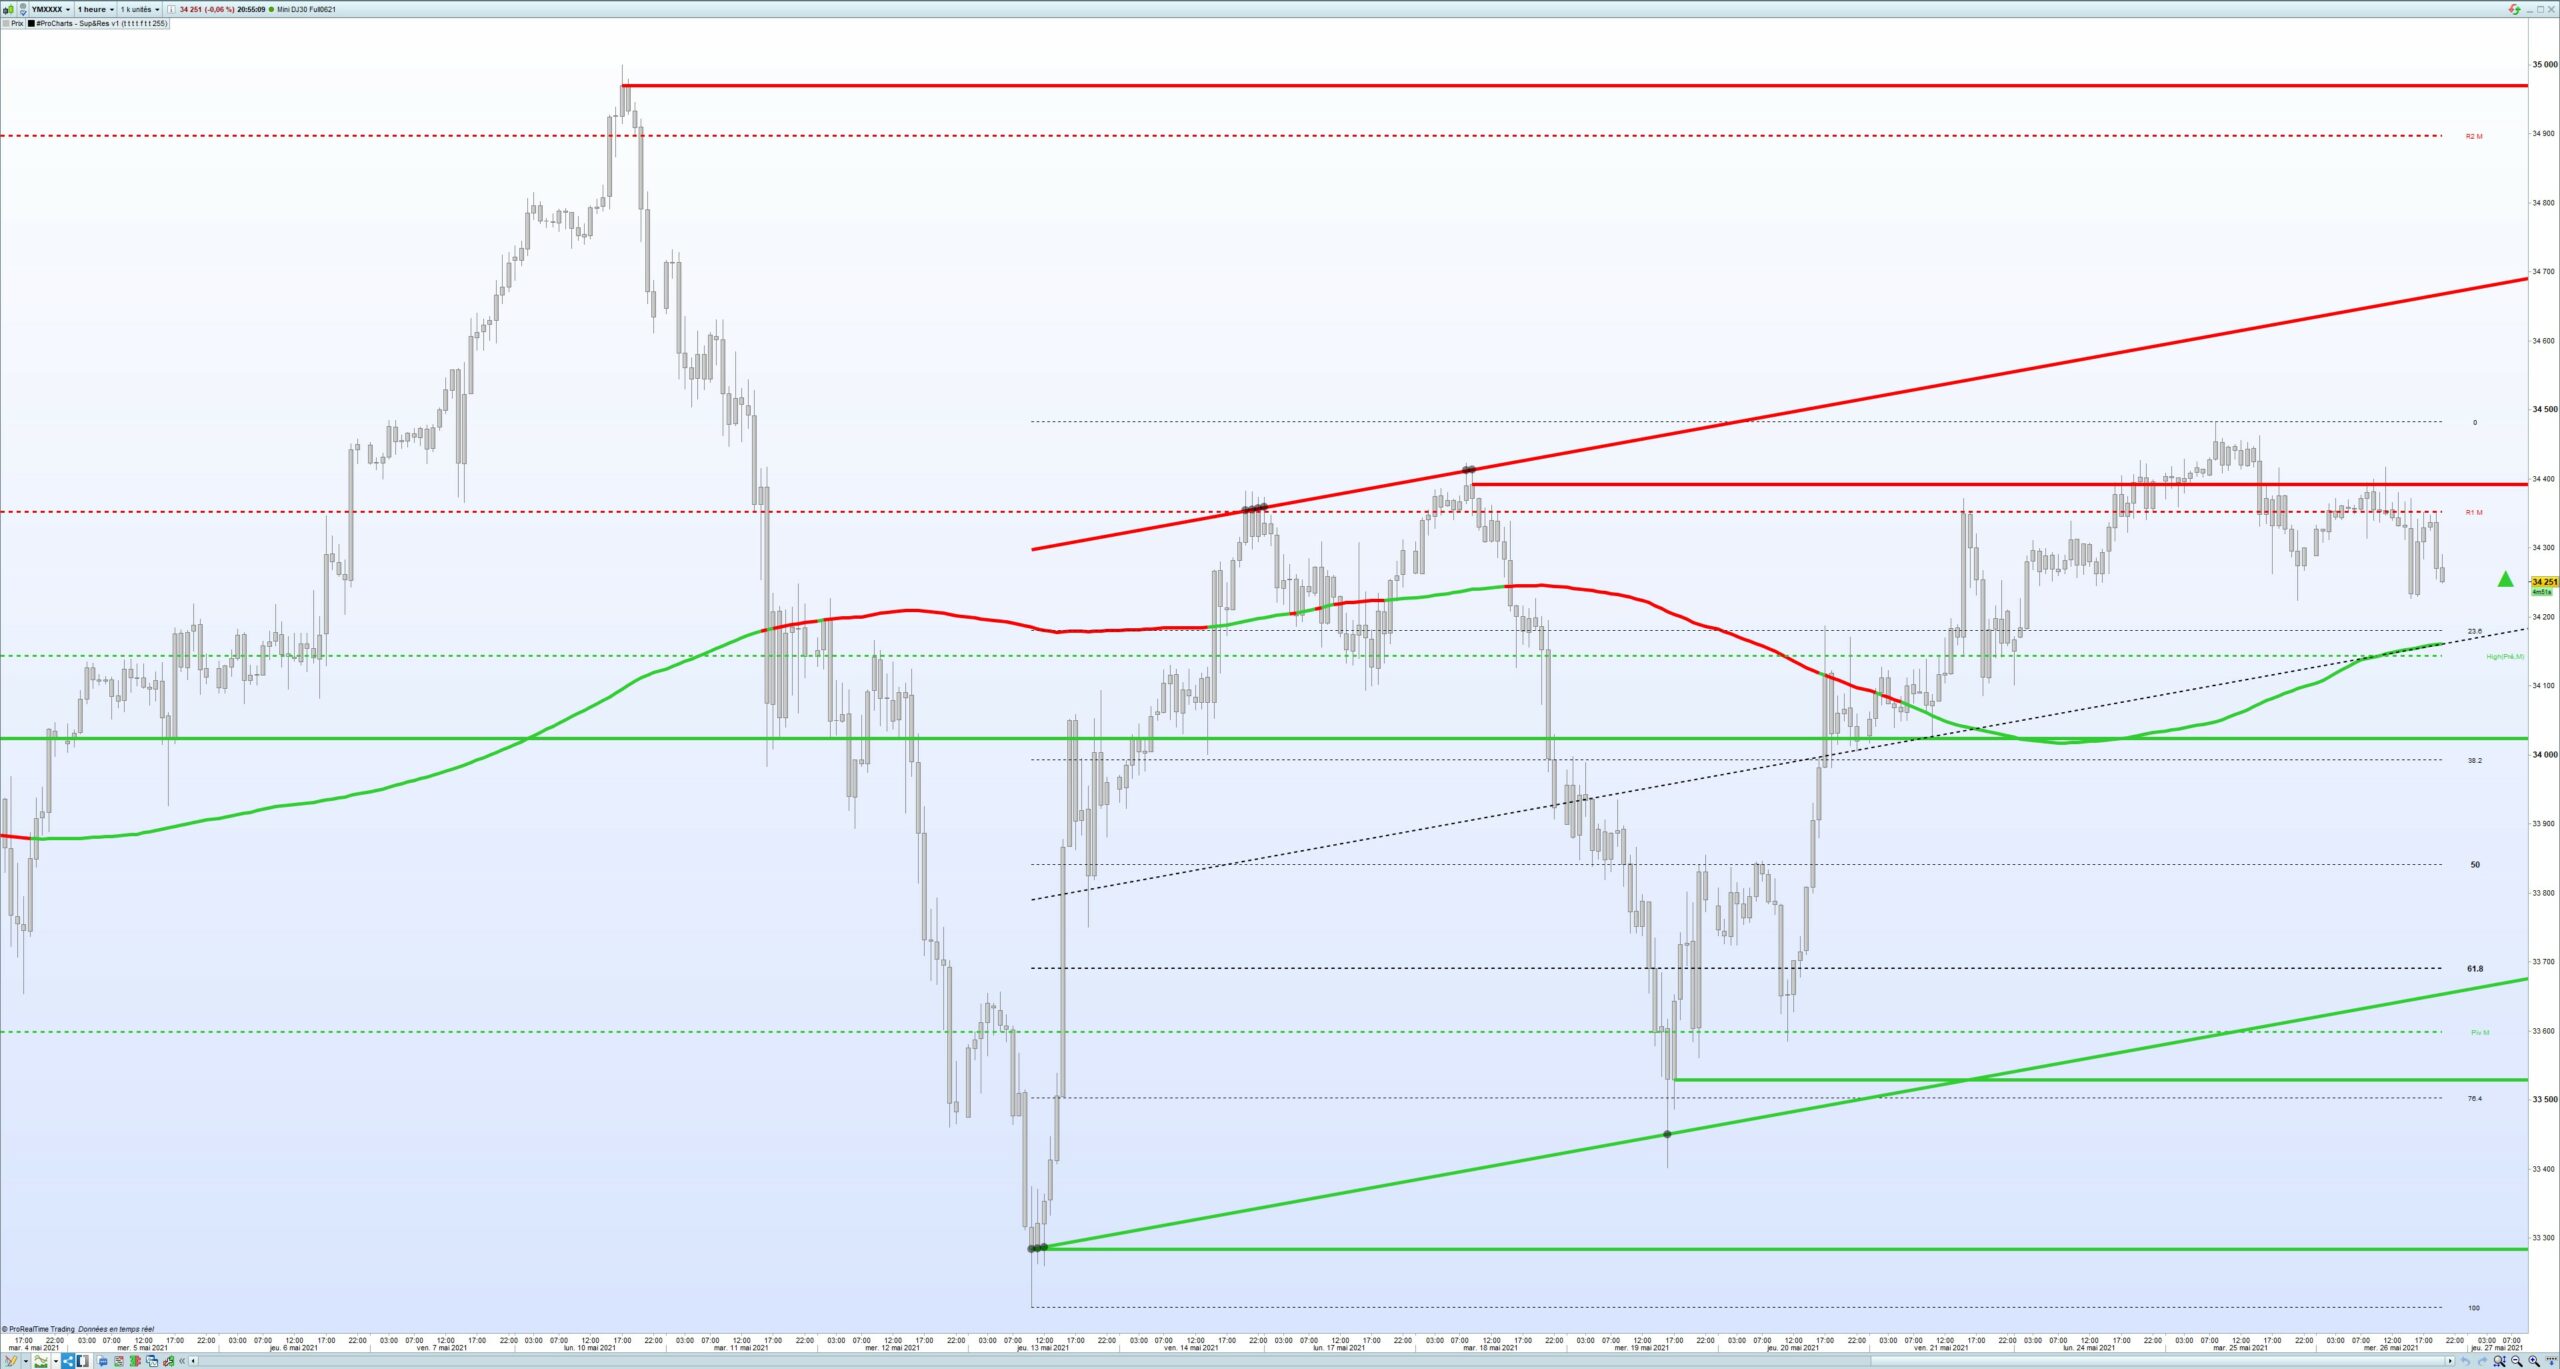
This is what will appear on your screen:
Here are all the supports and resistance I have coded into this indicator and that I use in my daily trading activities :
1. Horizontal Supports & Resistances
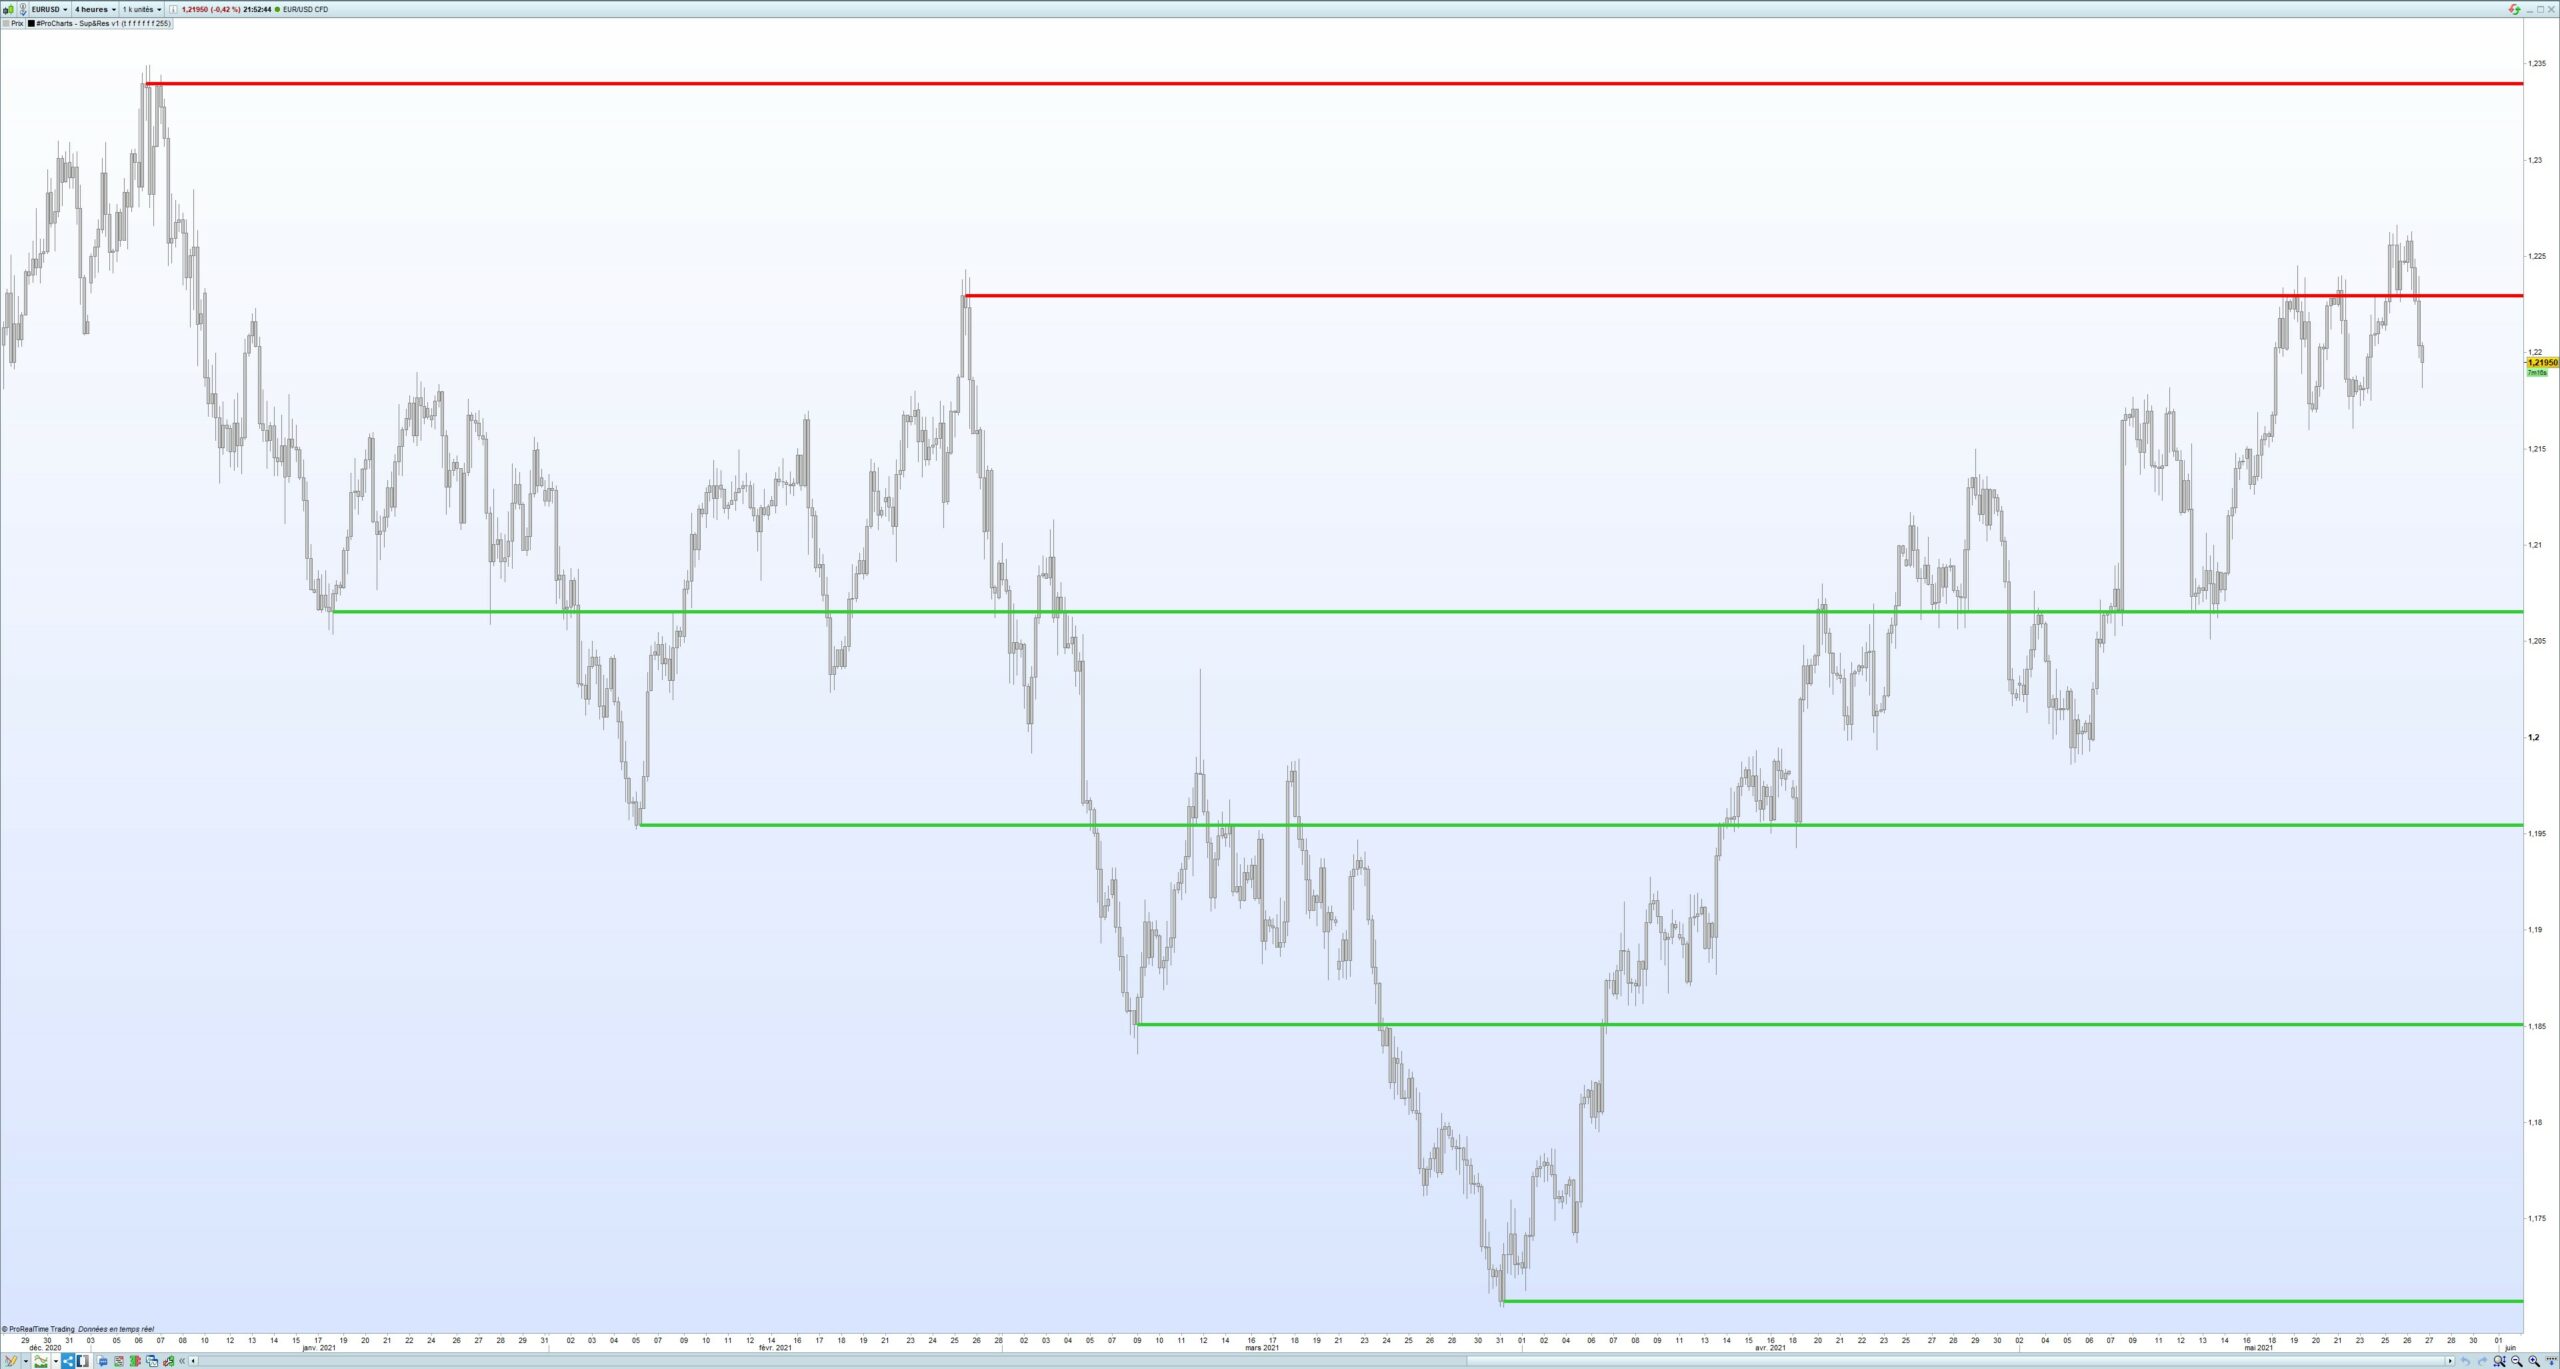
This is the most efficient item of my indicator. I ask the program to look in all the history and detect all areas where the price had a reversal reaction. Then, in order not to have a display full of lines, I apply a complex filter that will remove all lines if there a close and more recent Support & Resistance. This script can repaint, because this is what I ask him to do ! If a more recent polarity zone is detected, then it will forget the previous one and only display the last one. The color line will automatically change (green/red) in case a support becomes resistance or the opposite.
2. Trend Channel
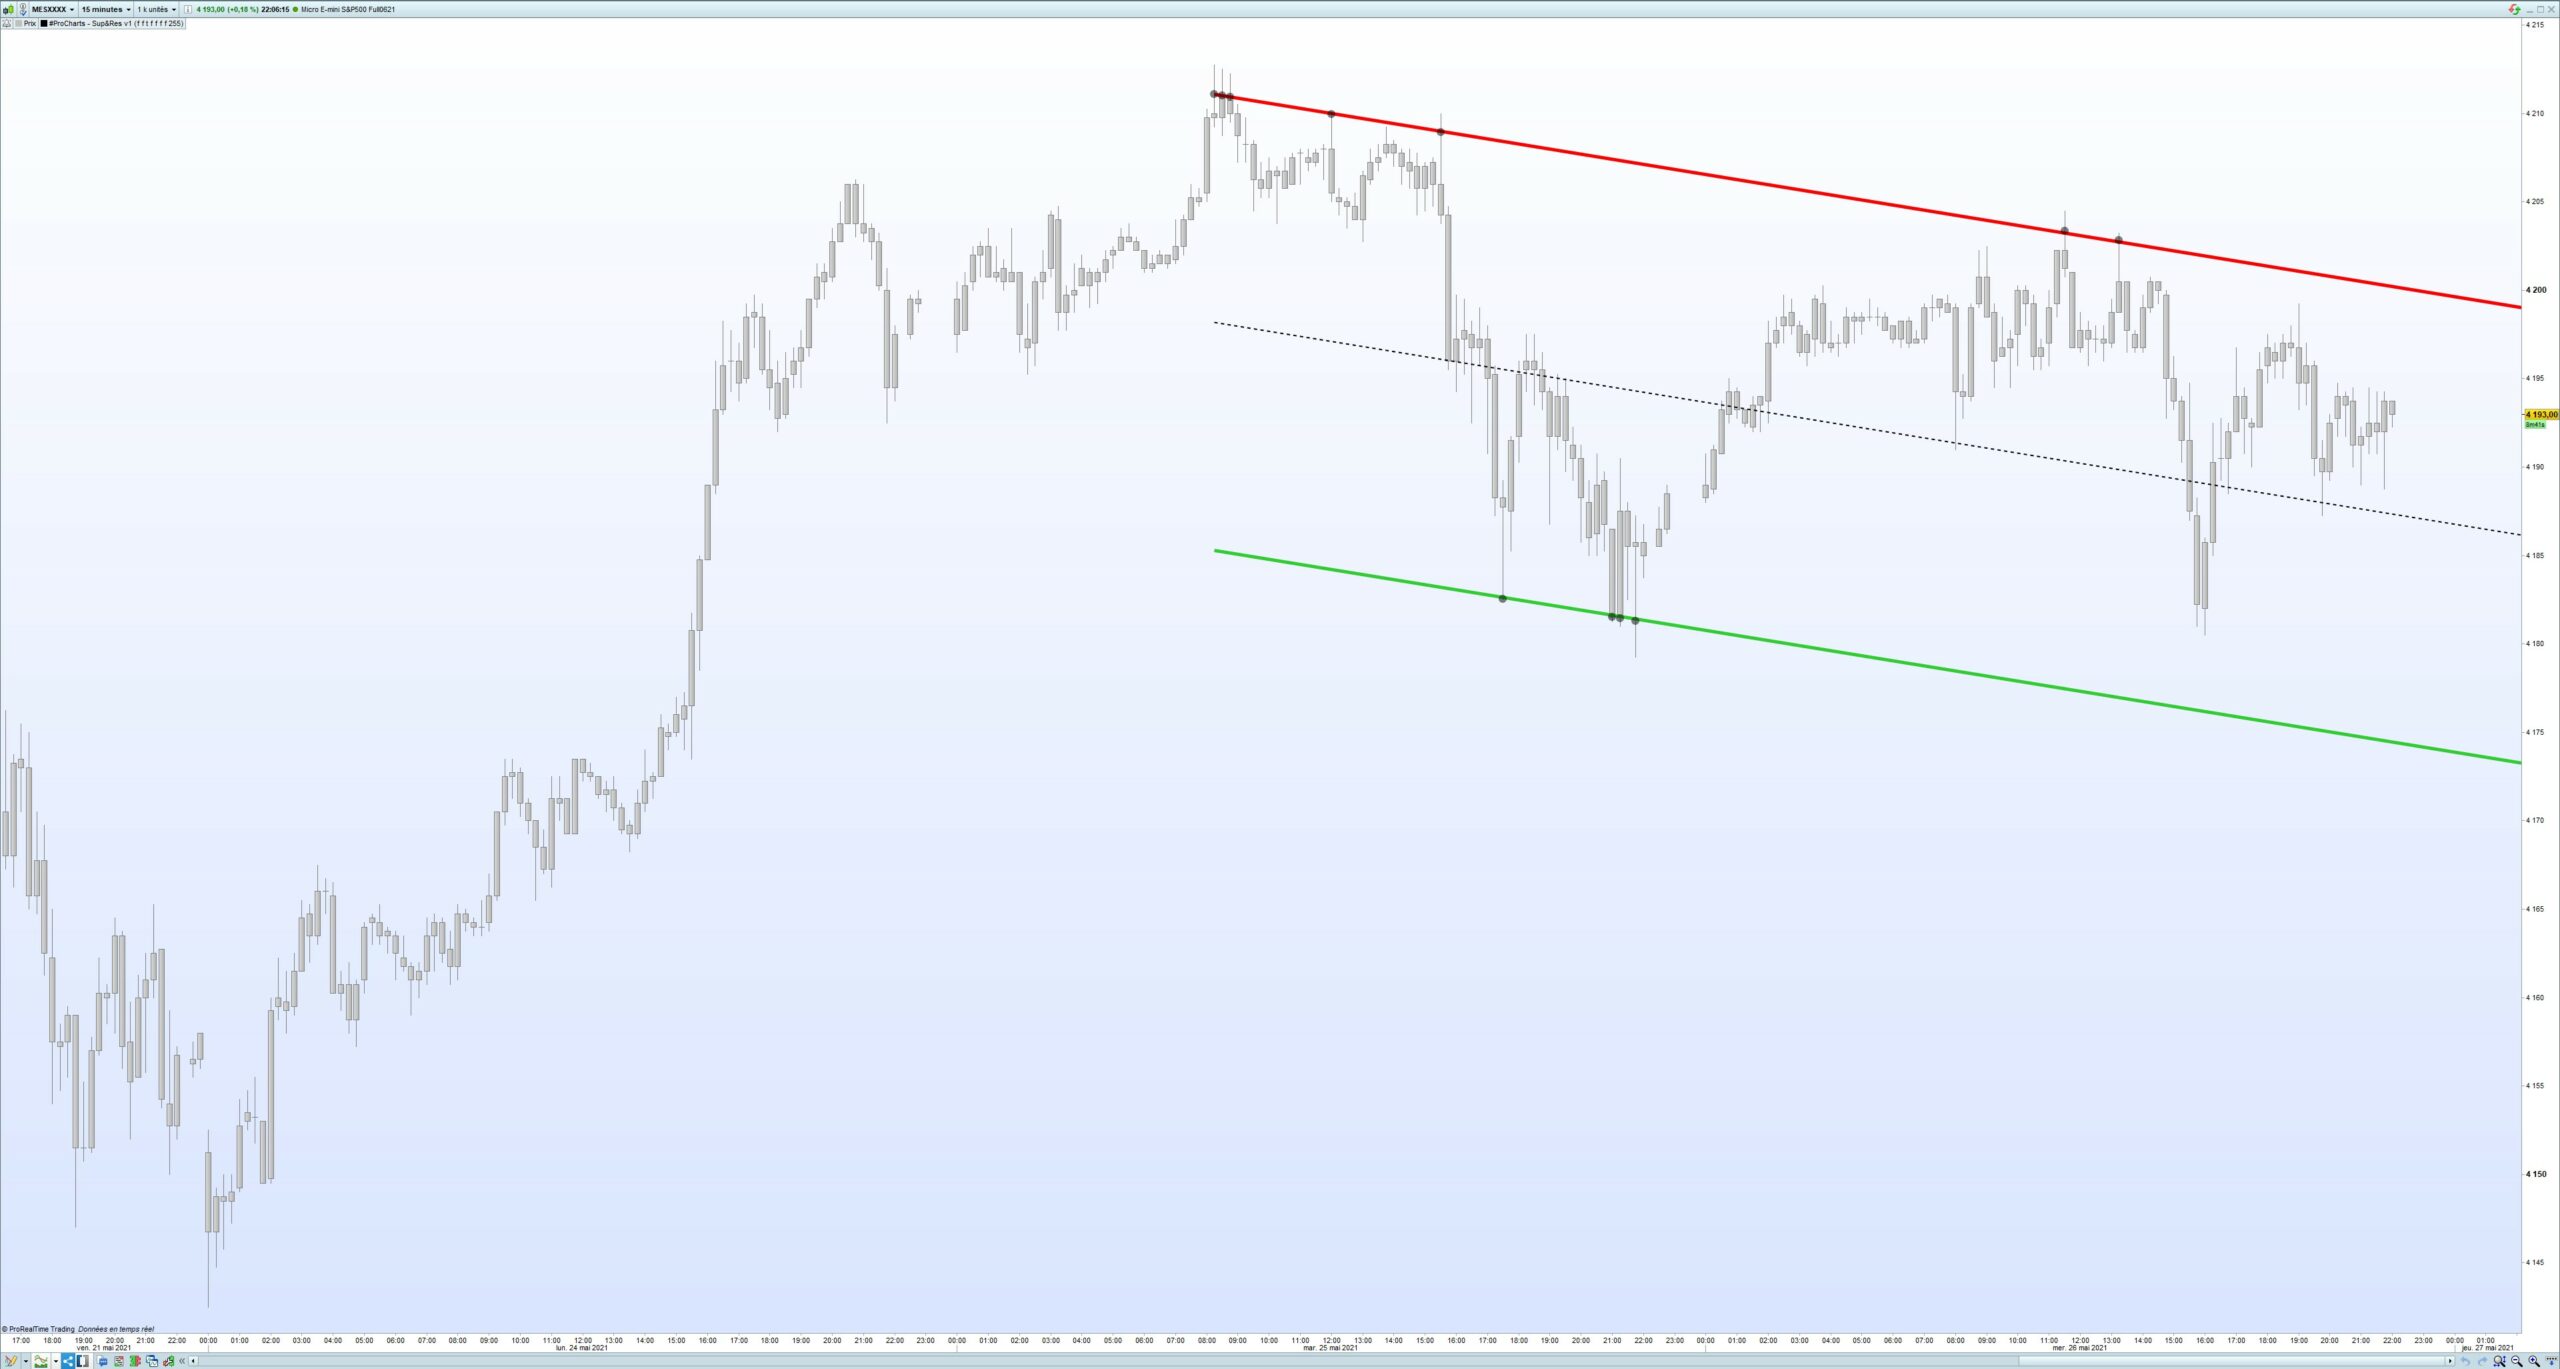
I coded an automatic display of a trend channel. I got the inspiration from the Raff channel, but I modified completely the script in order to make in more accurate. This channel shows clearly the last trend, and will display with a black dot if the price had a reaction in the past to its contact. The more black dots you see, the more accurate the channel is ! (consider at least 3 price reaction areas for an accurate channel).
3. Open Gaps
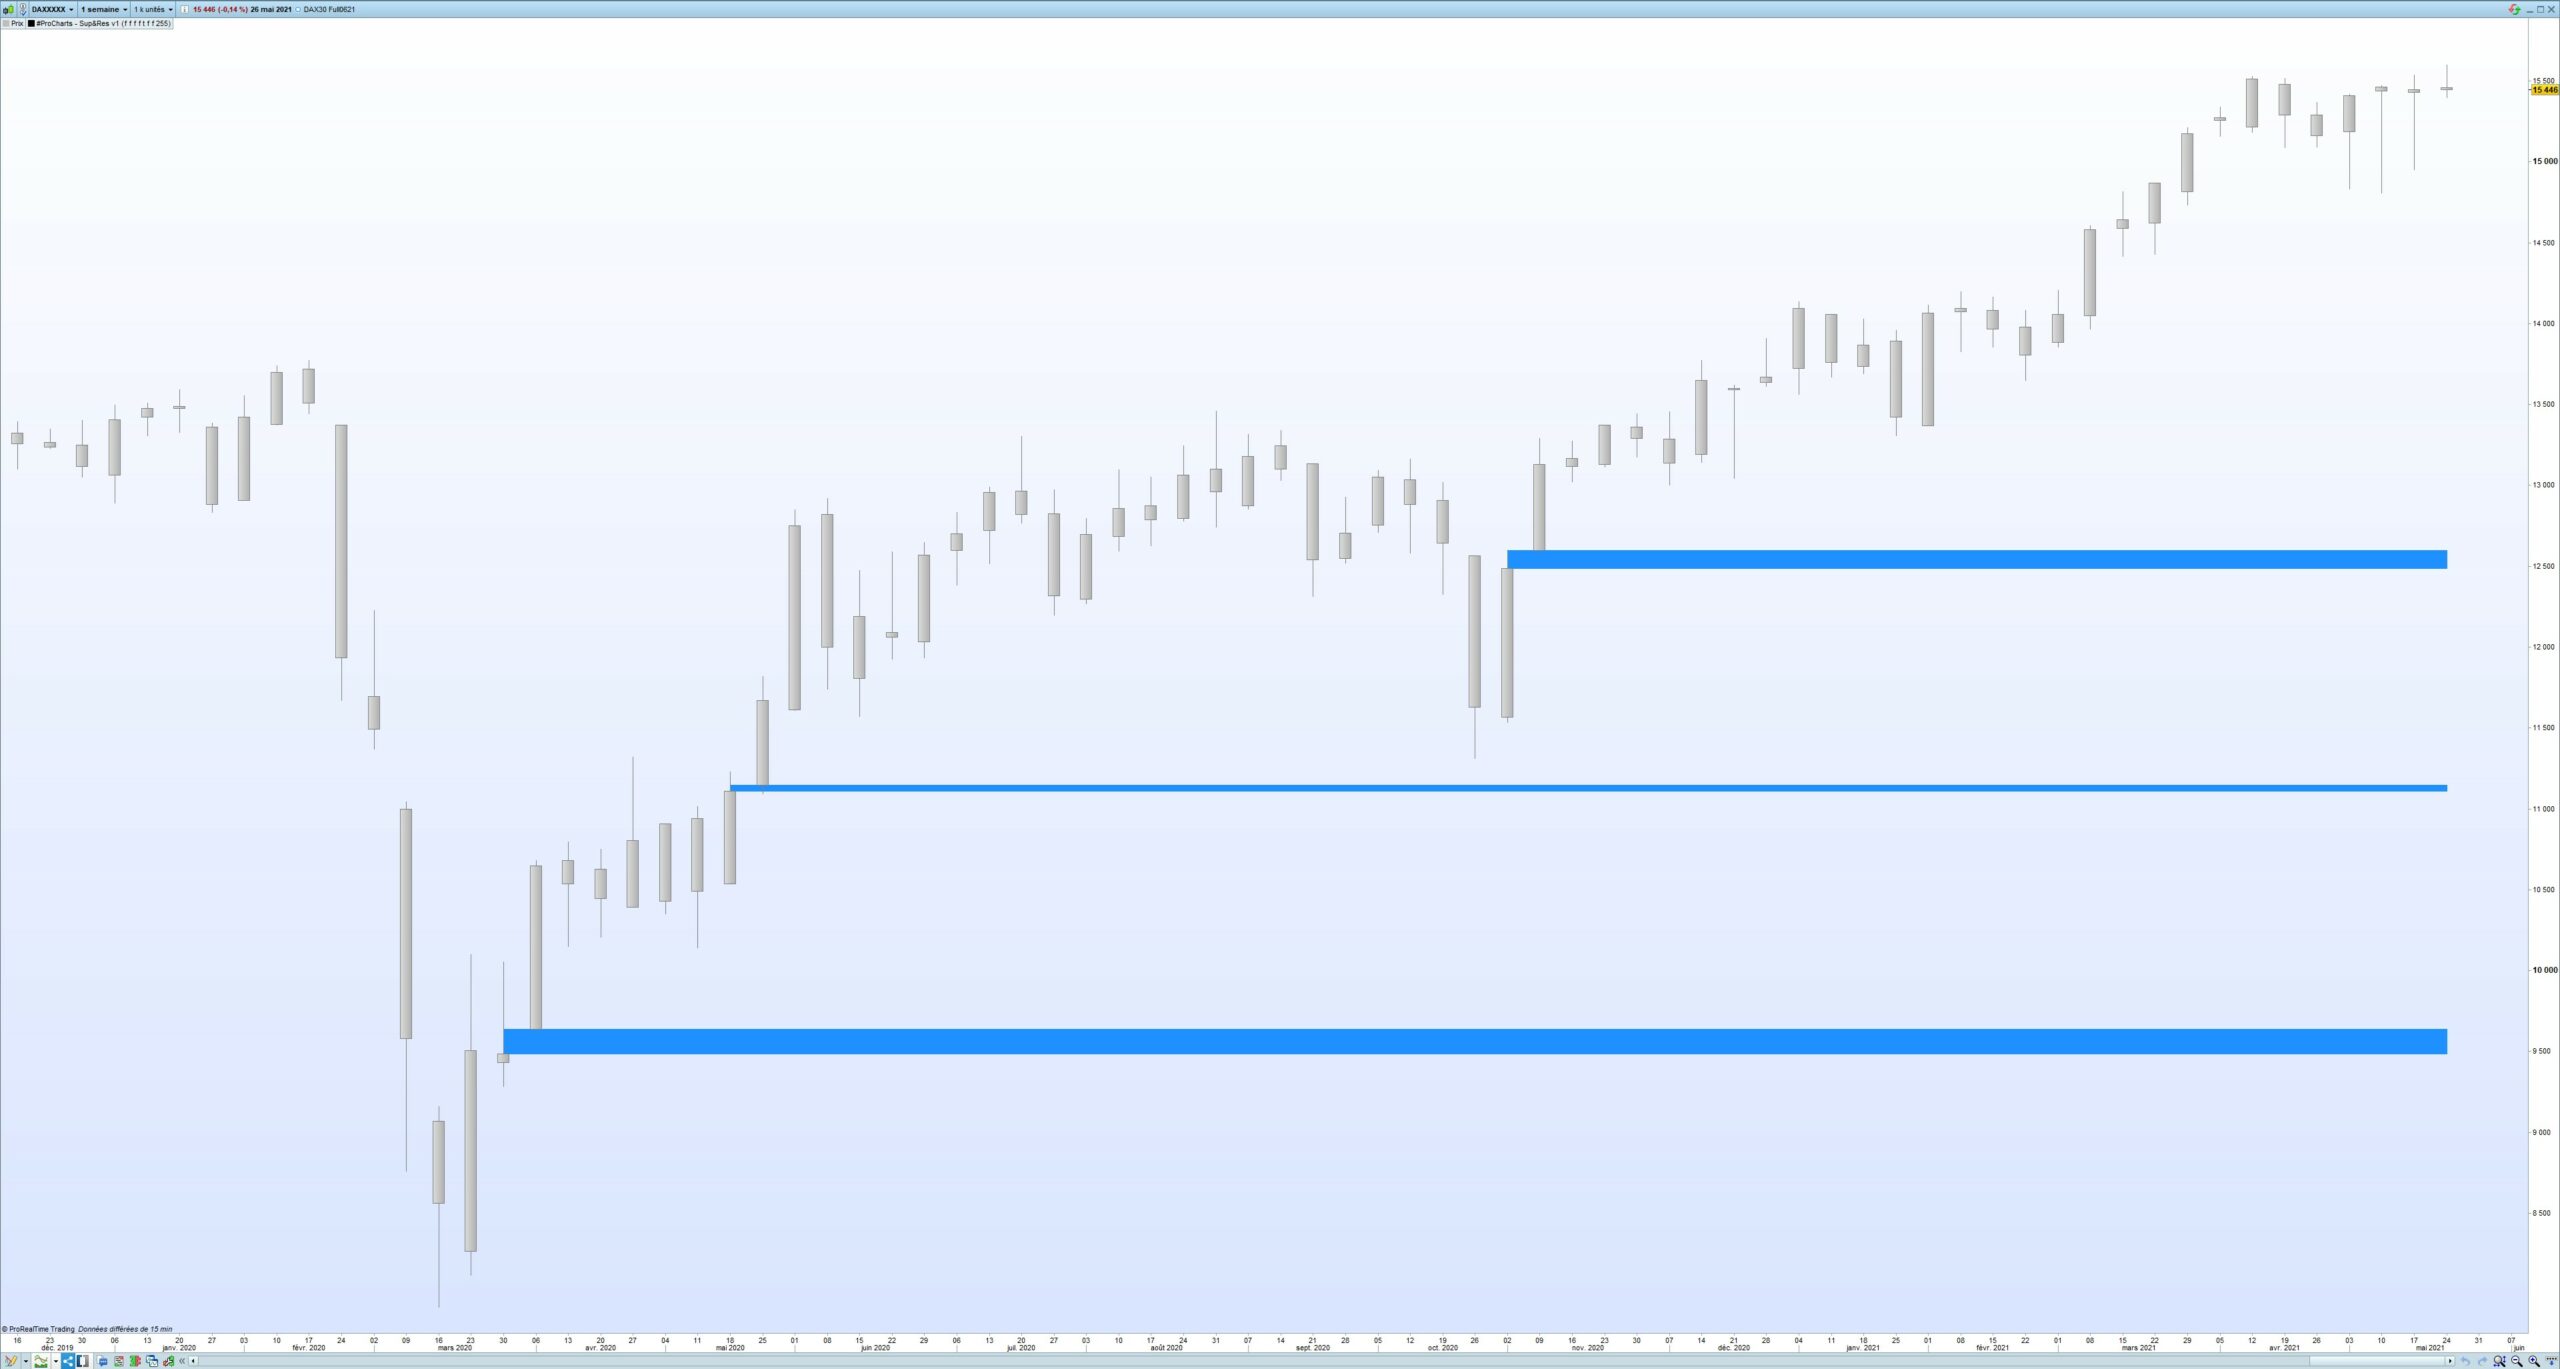
The indicator will look in the past and see if an open gap is still open. As we all know open gaps have a very strong price attraction power ! Once a gap is closed, it will not be displayed anymore in order not to overcrowd the chart.
4. Moving Average 200 periods
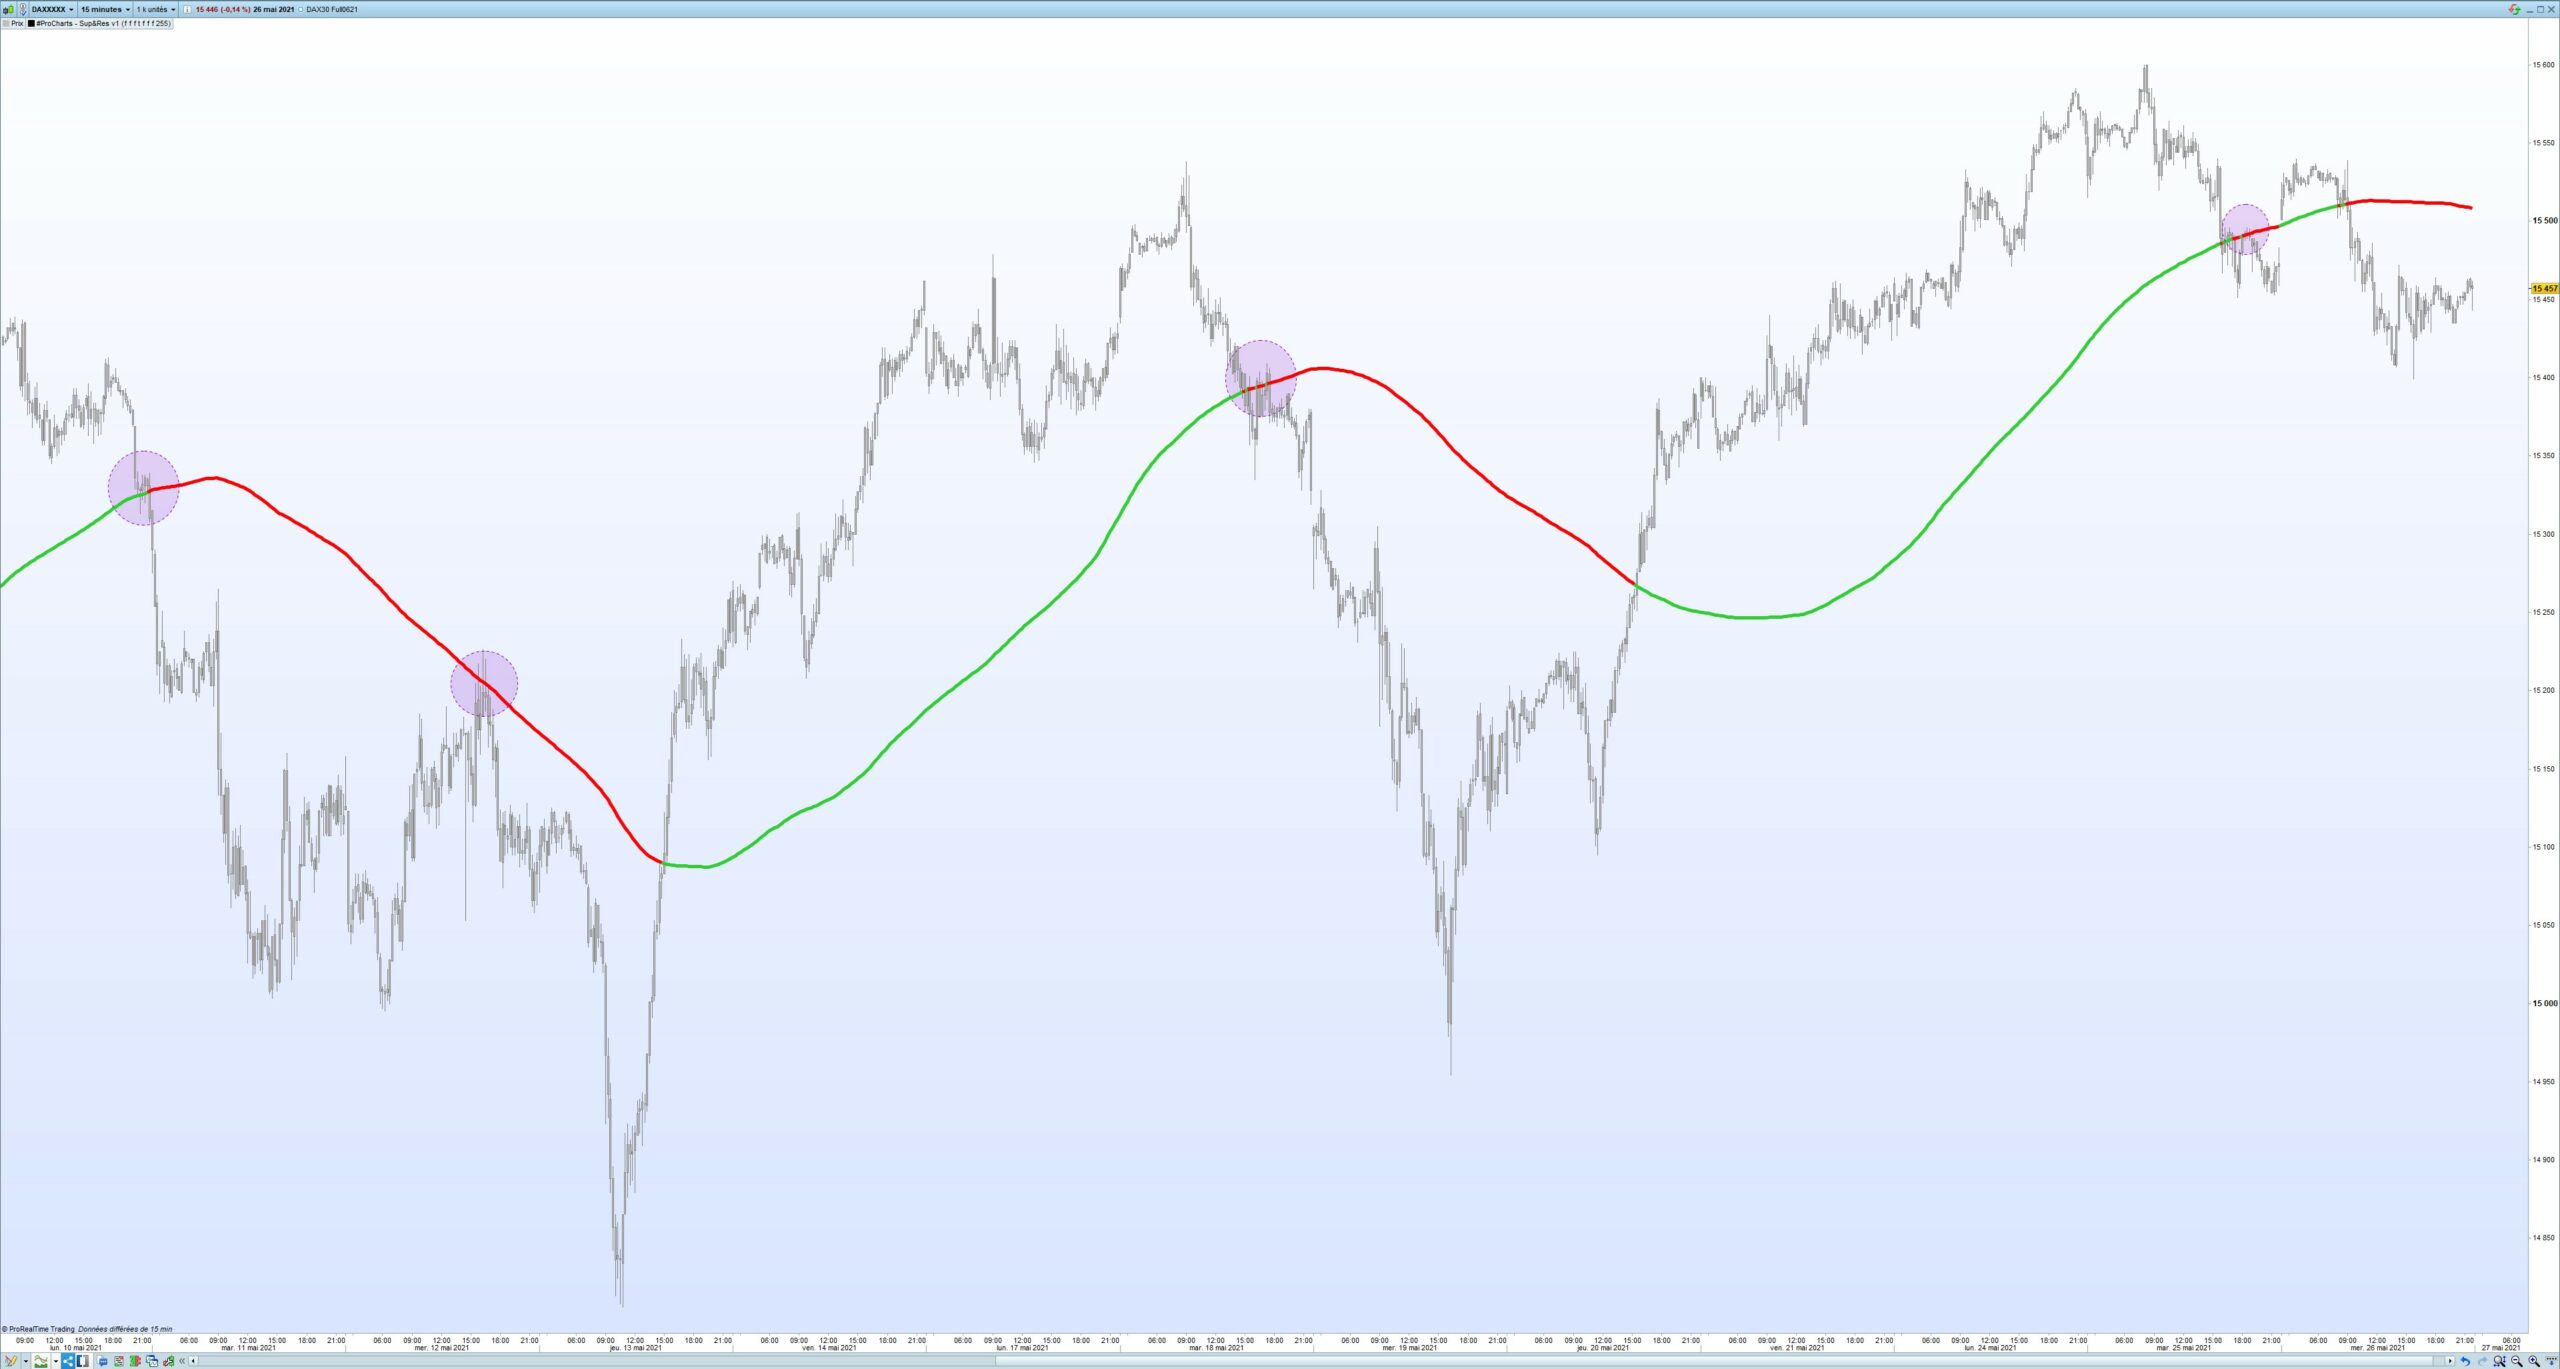
This is a very simple indicator, simple to apply in PRT, but the SMA200 very often produces a price reaction as you may see on the picture above. So I implemented it into my script with a color change when the line changes from support to resistance.
5. Monthly Pivot Points & High/Low of Previous Month
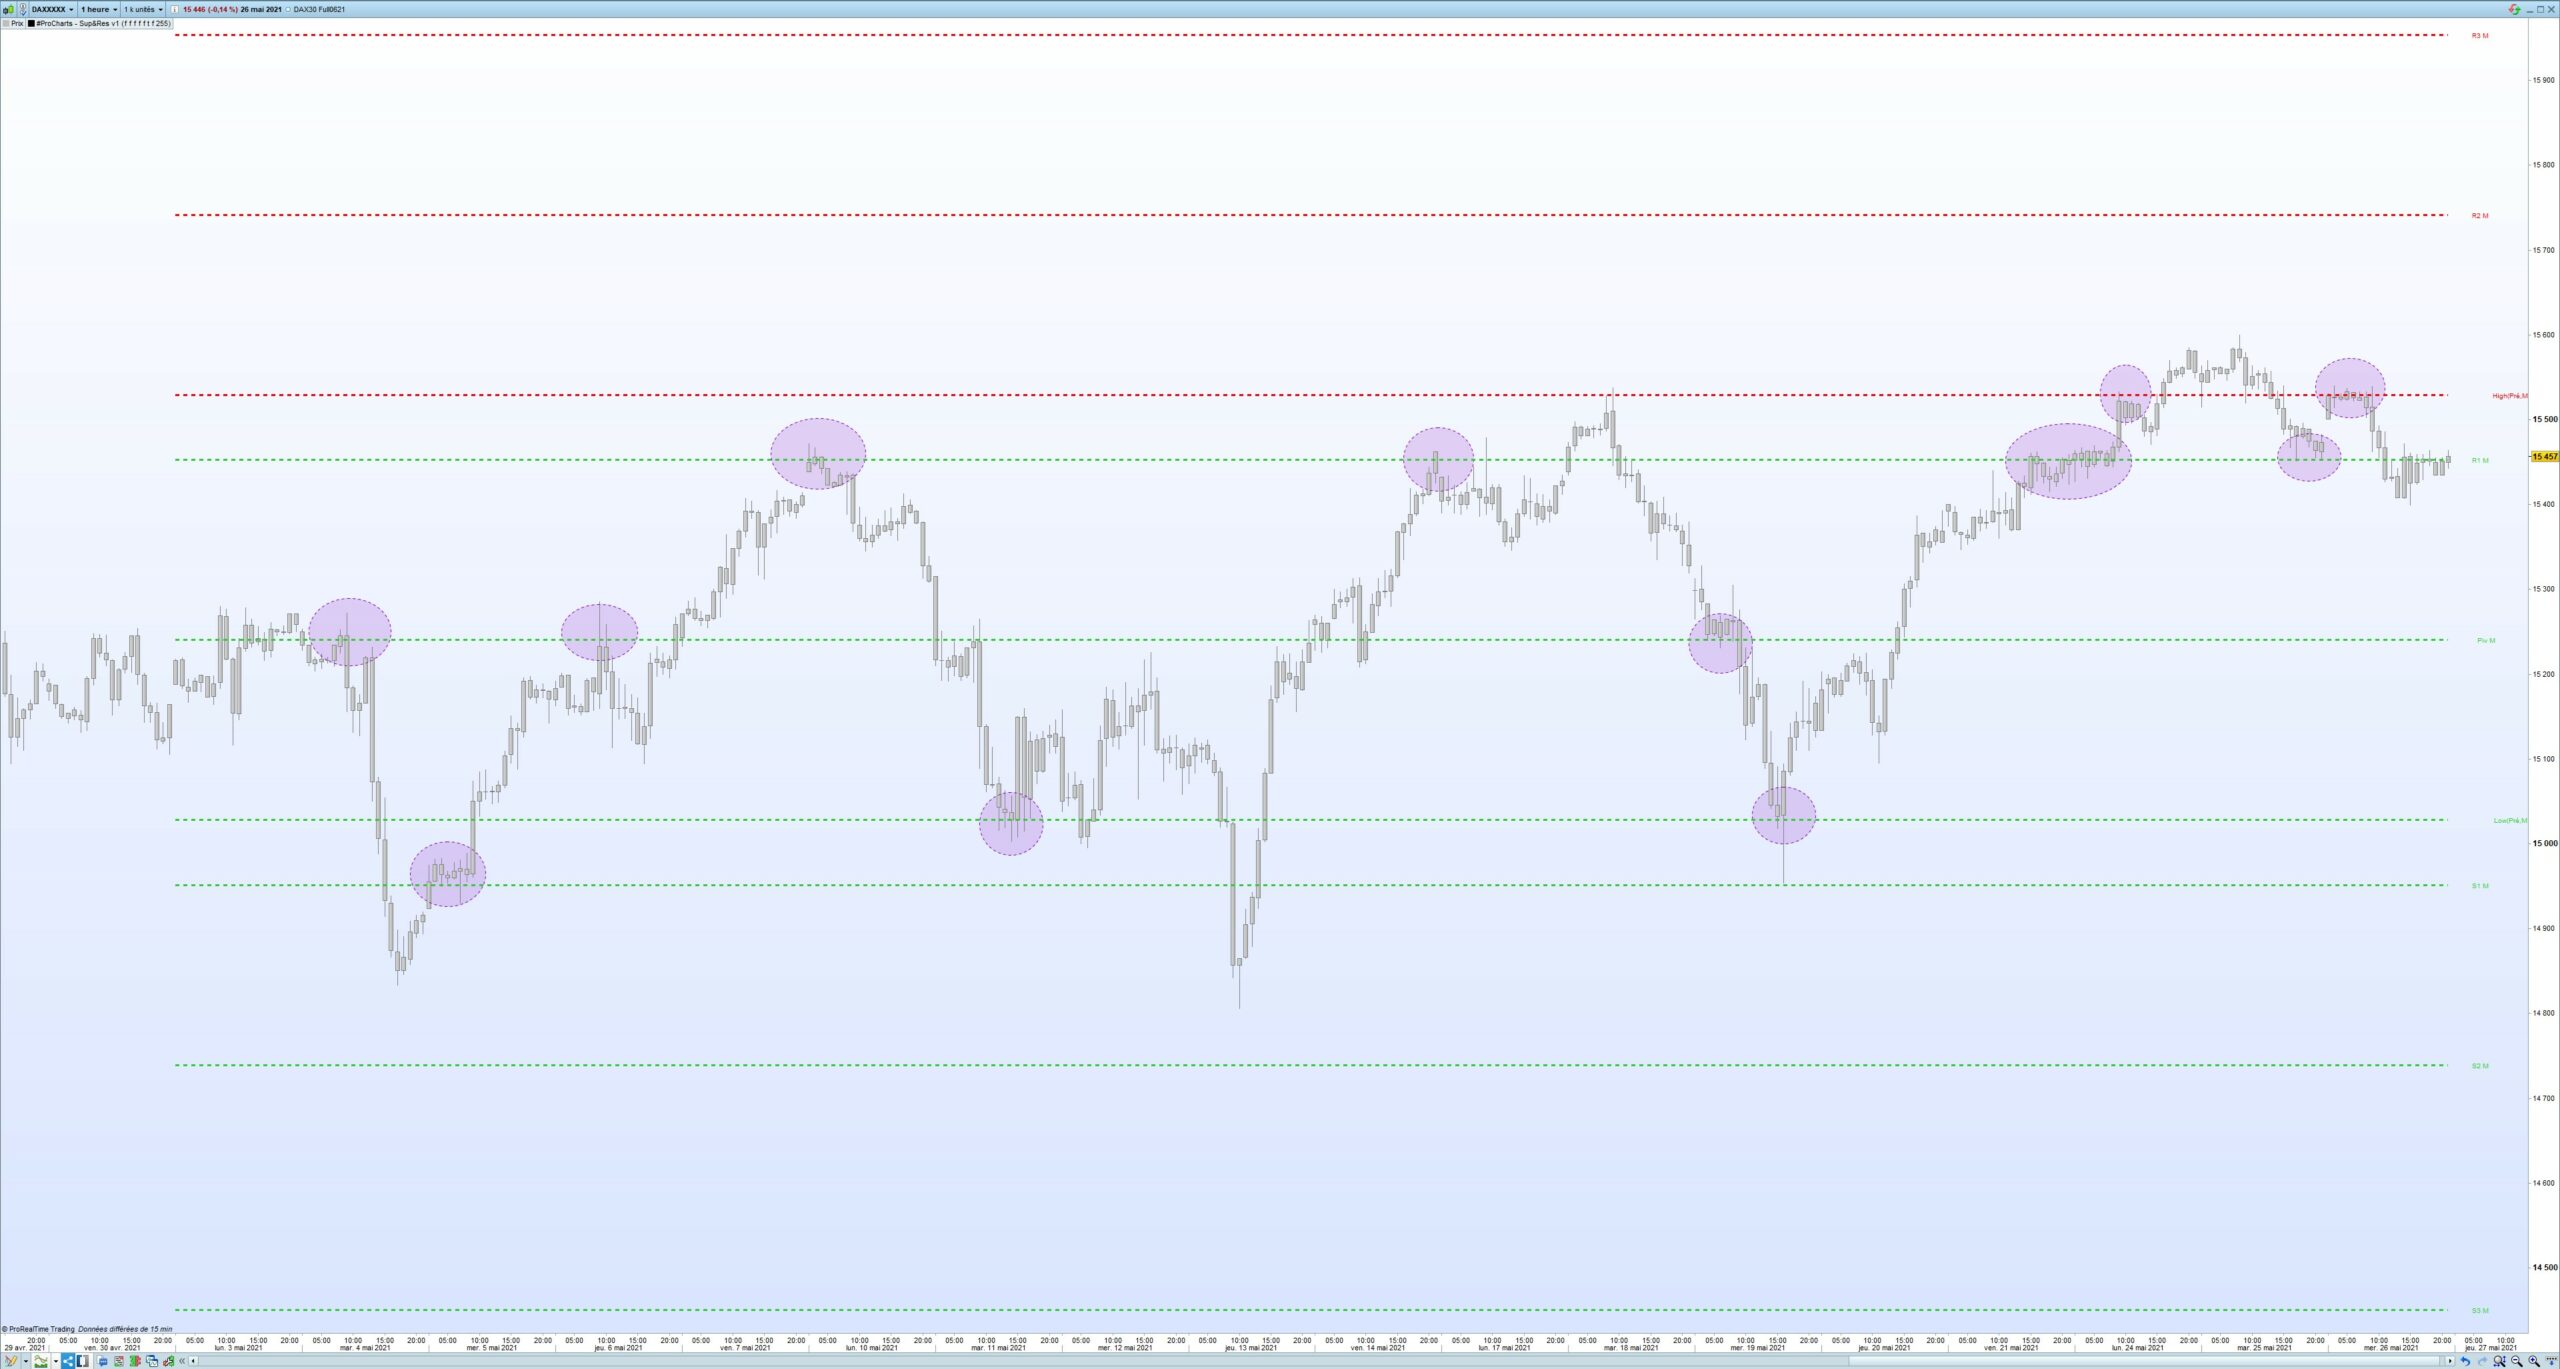
I like to trade when the price get close to monthly pivot points or the previous month high and low. Reason why I implemented the plot of those lines into my indicator, again with an automatic color change if the line is support or resistance. ATTENTION: be sure to have all last month candles on your chart in order to allow the calculation of the lines, otherwise the indicator will not be able to display it.
6. Fibonacci Retracement Levels
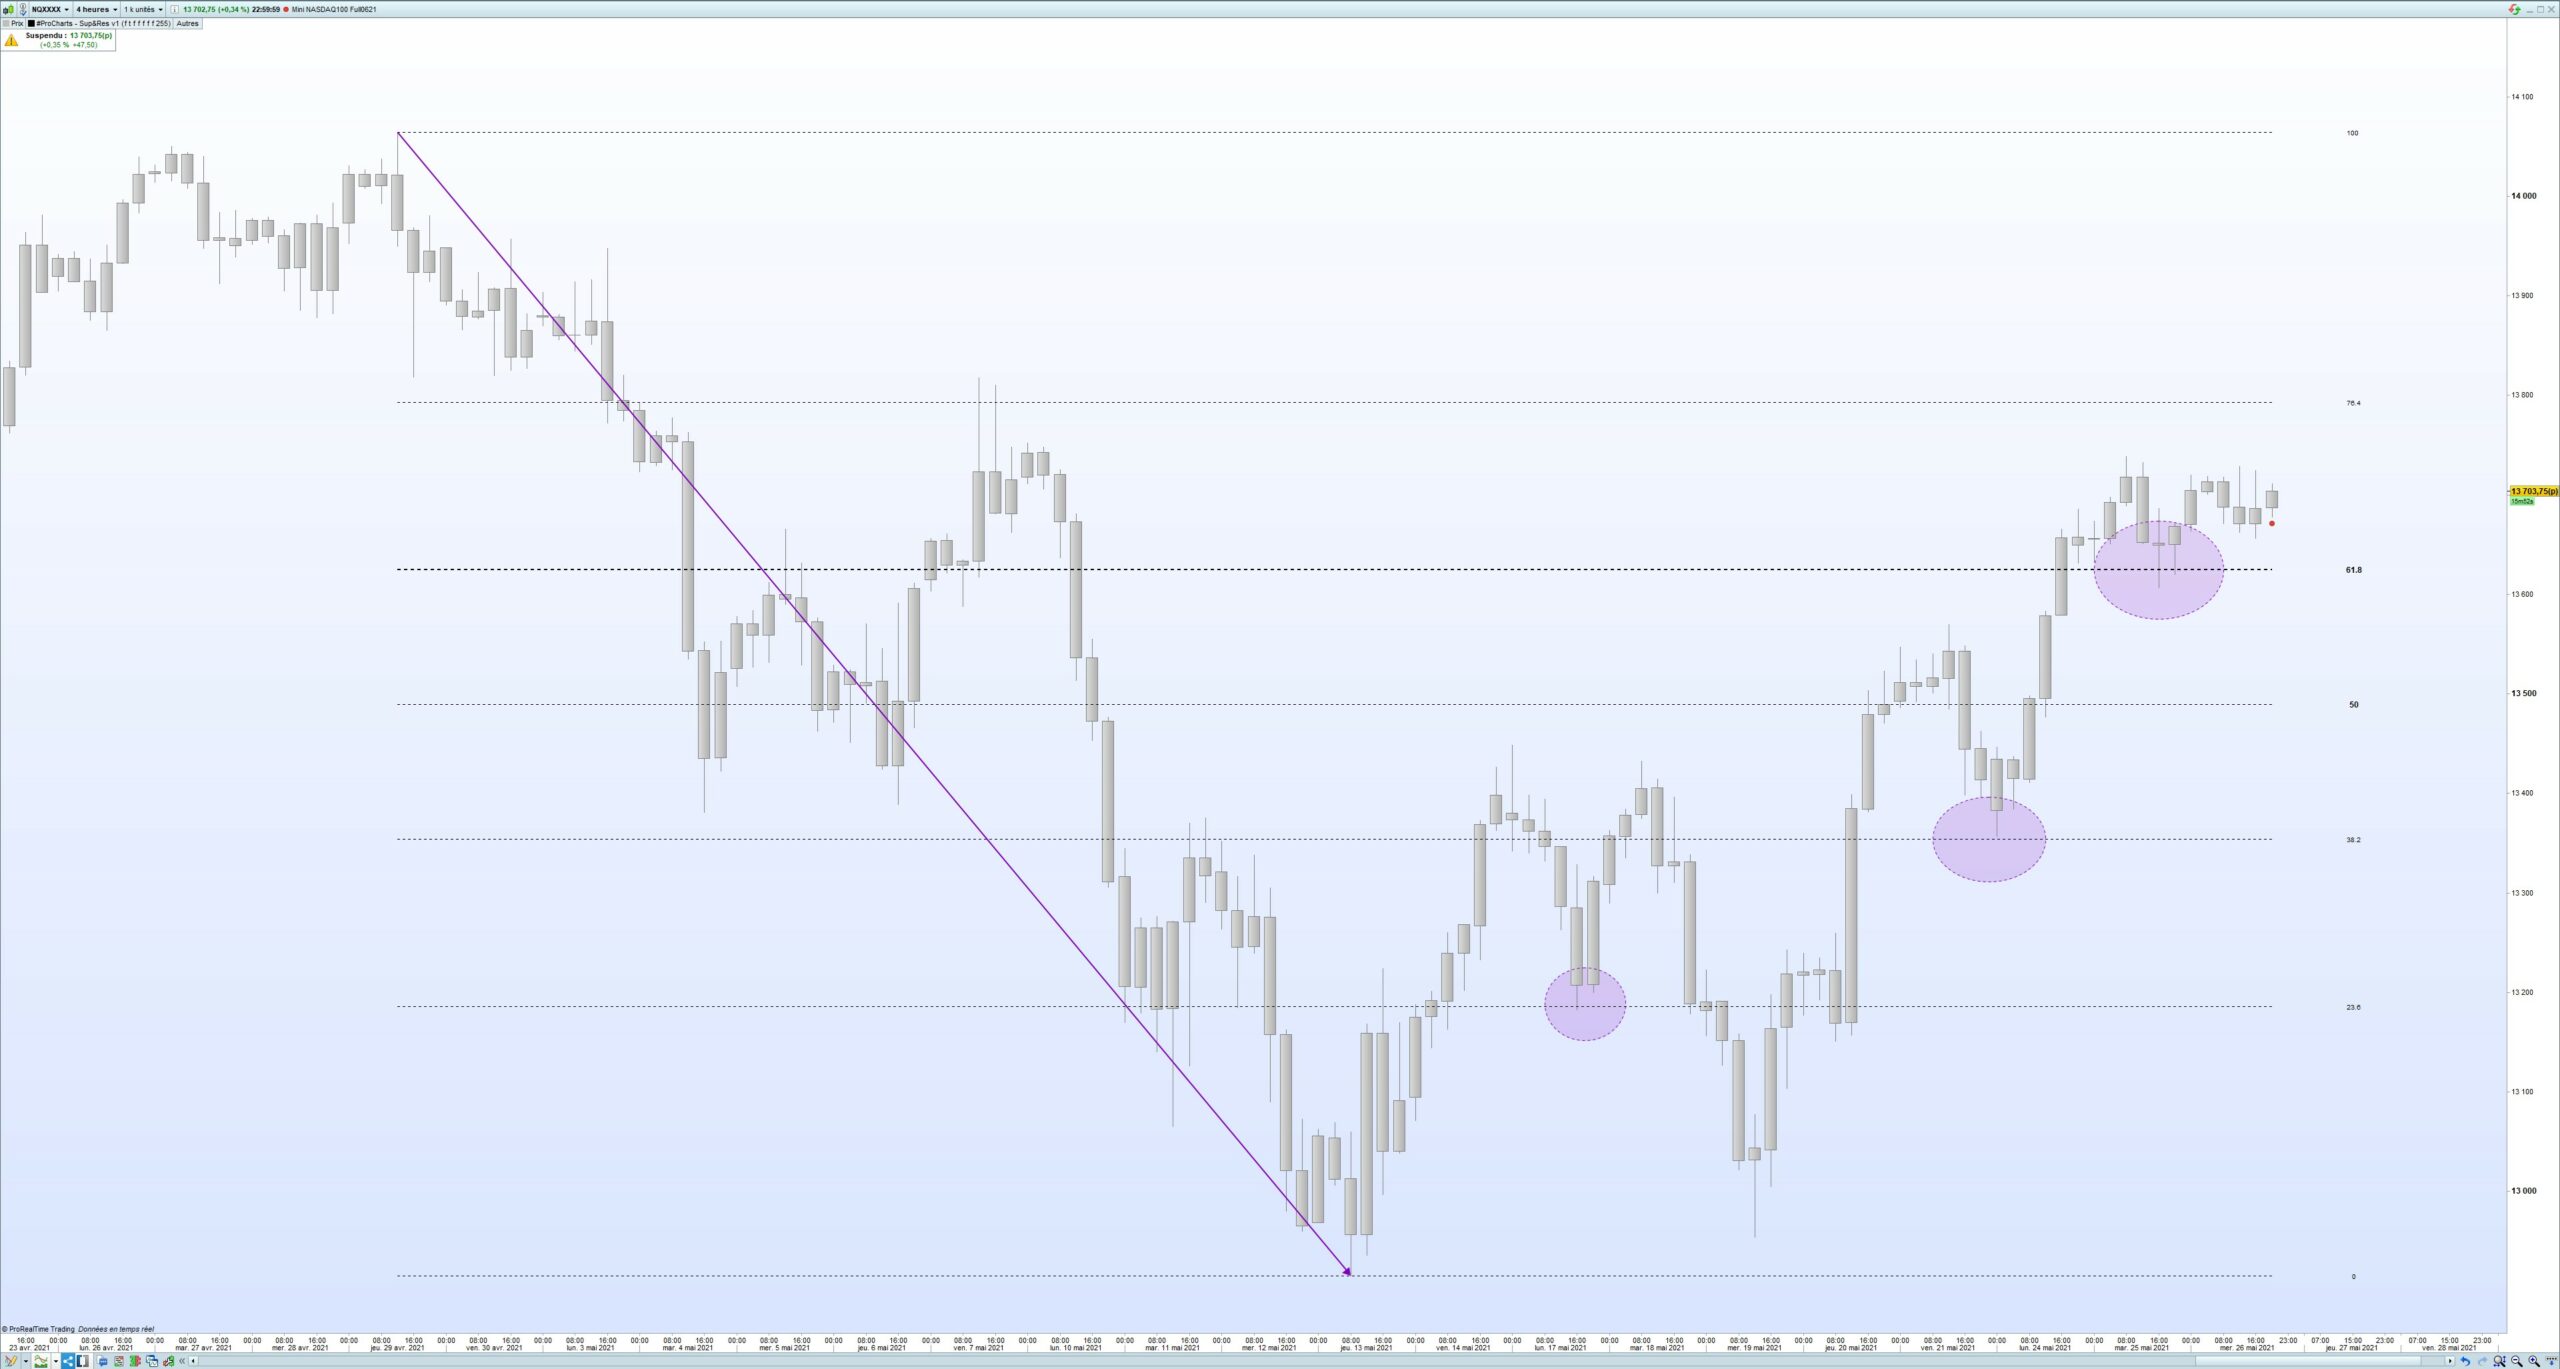
I implemented into my script an automatic detection of the last wave. Based on that knowledge, the indicator is able to plot Fibonacci retracement lines, where a price reaction may occur.
Indicator Menu:
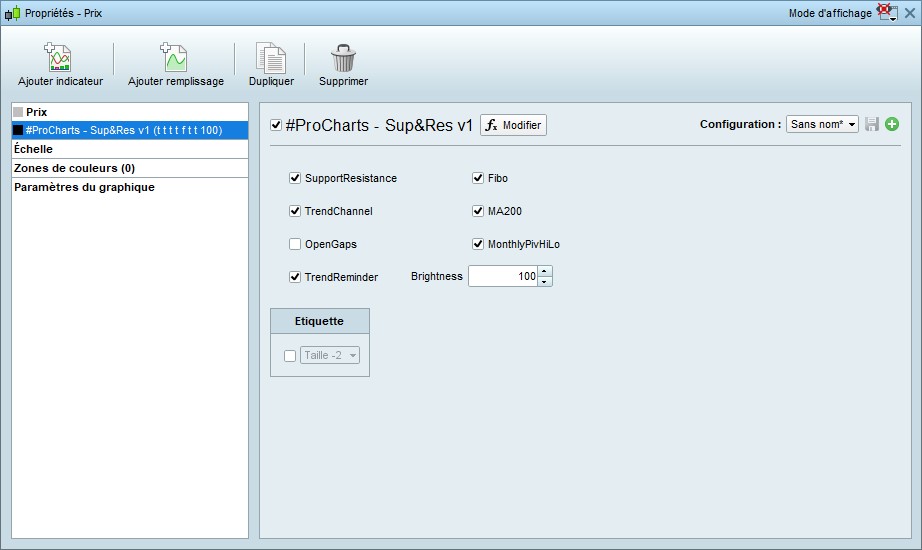
As you can see, you can select which items you want to be displayed.
You will not have any complex setting to adjust, everything is done automatically !
Purchase Details:
– This indicator is for rent for 1€/day for a Monthly subscription (subscription can be cancelled anytime, so feel free to try it and see if it suits your trading style as it does for me)
– Support can be provided in English or French

Reviews
There are no reviews yet.