Overview
Advanced Pivot Levels (Yearly) is a cutting-edge tool tailored for position traders and investors seeking precise market insights. This indicator calculates yearly pivot levels based on the previous year’s high, low, and close, offering actionable support and resistance zones in real time. Designed for accuracy and adaptability, it empowers traders to navigate volatile intraday markets with confidence.
Example
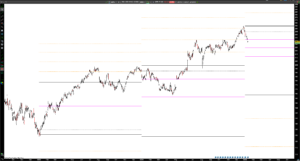
Indicator plot on daily timeframe
Plot
Suitable for investing and position trading purposes, I personally suggest to plot the indicator on the daily or weekly timeframe.
Key features
- Precision entry points: Focused on yearly pivot levels for long-term trading.
- Real-time adaptation: Adjusts dynamically to market movements and volatility.
- Zero lag: Provides actionable data instantly, without delays.
- Versatility: Suitable for all instruments, including stocks, forex, and futures.
Benefits for traders
- Identify critical yearly support and resistance levels with accuracy.
- Anticipate potential breakout or reversal zones during position trading and investing.
- Enhance trade timing with reliable pivot-based signals.
- Analyze medium-term market trends and structure for strategic decision-making.
How it works
This indicator calculates a set of yearly pivot levels derived from the previous year’s high, low, and close. The levels include:
- Core Pivot levels: Central Pivot (PP), Top Pivot (TP), and Bottom Pivot (BP), which combined form the Central Pivot Range (CPR)
- Resistance levels: R25, R50, R75, R100, as the previous year’s range bullish extensions
- Support levels: S25, S50, S75, S100, as the previous year’s range bearish extensions
These levels act as critical decision-making zones for position traders and investors, highlighting areas where market participants are likely to react.
HLC: Plot the high, low and close of the previous year
CPR: Plot the Central Pivot Range based on high, low and close of the previous year
EXTENSIONS: Plot the previous year’s range extensions
LABELS: Plot the labels of the levels above
NEXTCPR: Plot the developing Central Pivot Range for the next year
NEXTEXTENSIONS: Plot the developing Range Extensions for the next year
Who can use it?
- Position traders and investors looking for precise levels to plan medium and long term trades.
- Position traders and investors analyzing yearly pivots in conjunction with larger trends.
Reference
The methodology behind these pivot calculations is inspired by the work of Frank Ochoa, whose teachings provide a foundation for this tool. This indicator is independently developed and optimized for ProRealTime.


Bewertungen
Es gibt noch keine Bewertungen.