

Overview
The Advanced ADR indicator is a versatile tool designed to analyze and visualize market volatility across multiple timeframes. Despite its name suggesting a daily application, the indicator is effective on any timeframe, including weekly, monthly, and user-defined periods. By plotting the price excursions of each session and calculating the Average Daily Range (ADR), this tool provides traders with a reliable framework for understanding market dynamics and planning trades.
How it works
The Advanced ADR indicator is built on two primary metrics:
- Daily Range: The difference between the high and low of the current period (H-L). This period can vary depending on the timeframe chosen, such as daily, weekly, or monthly.
- Average Daily Range (ADR): The average of the daily range over a defined number of periods, offering a comprehensive view of price volatility trends.
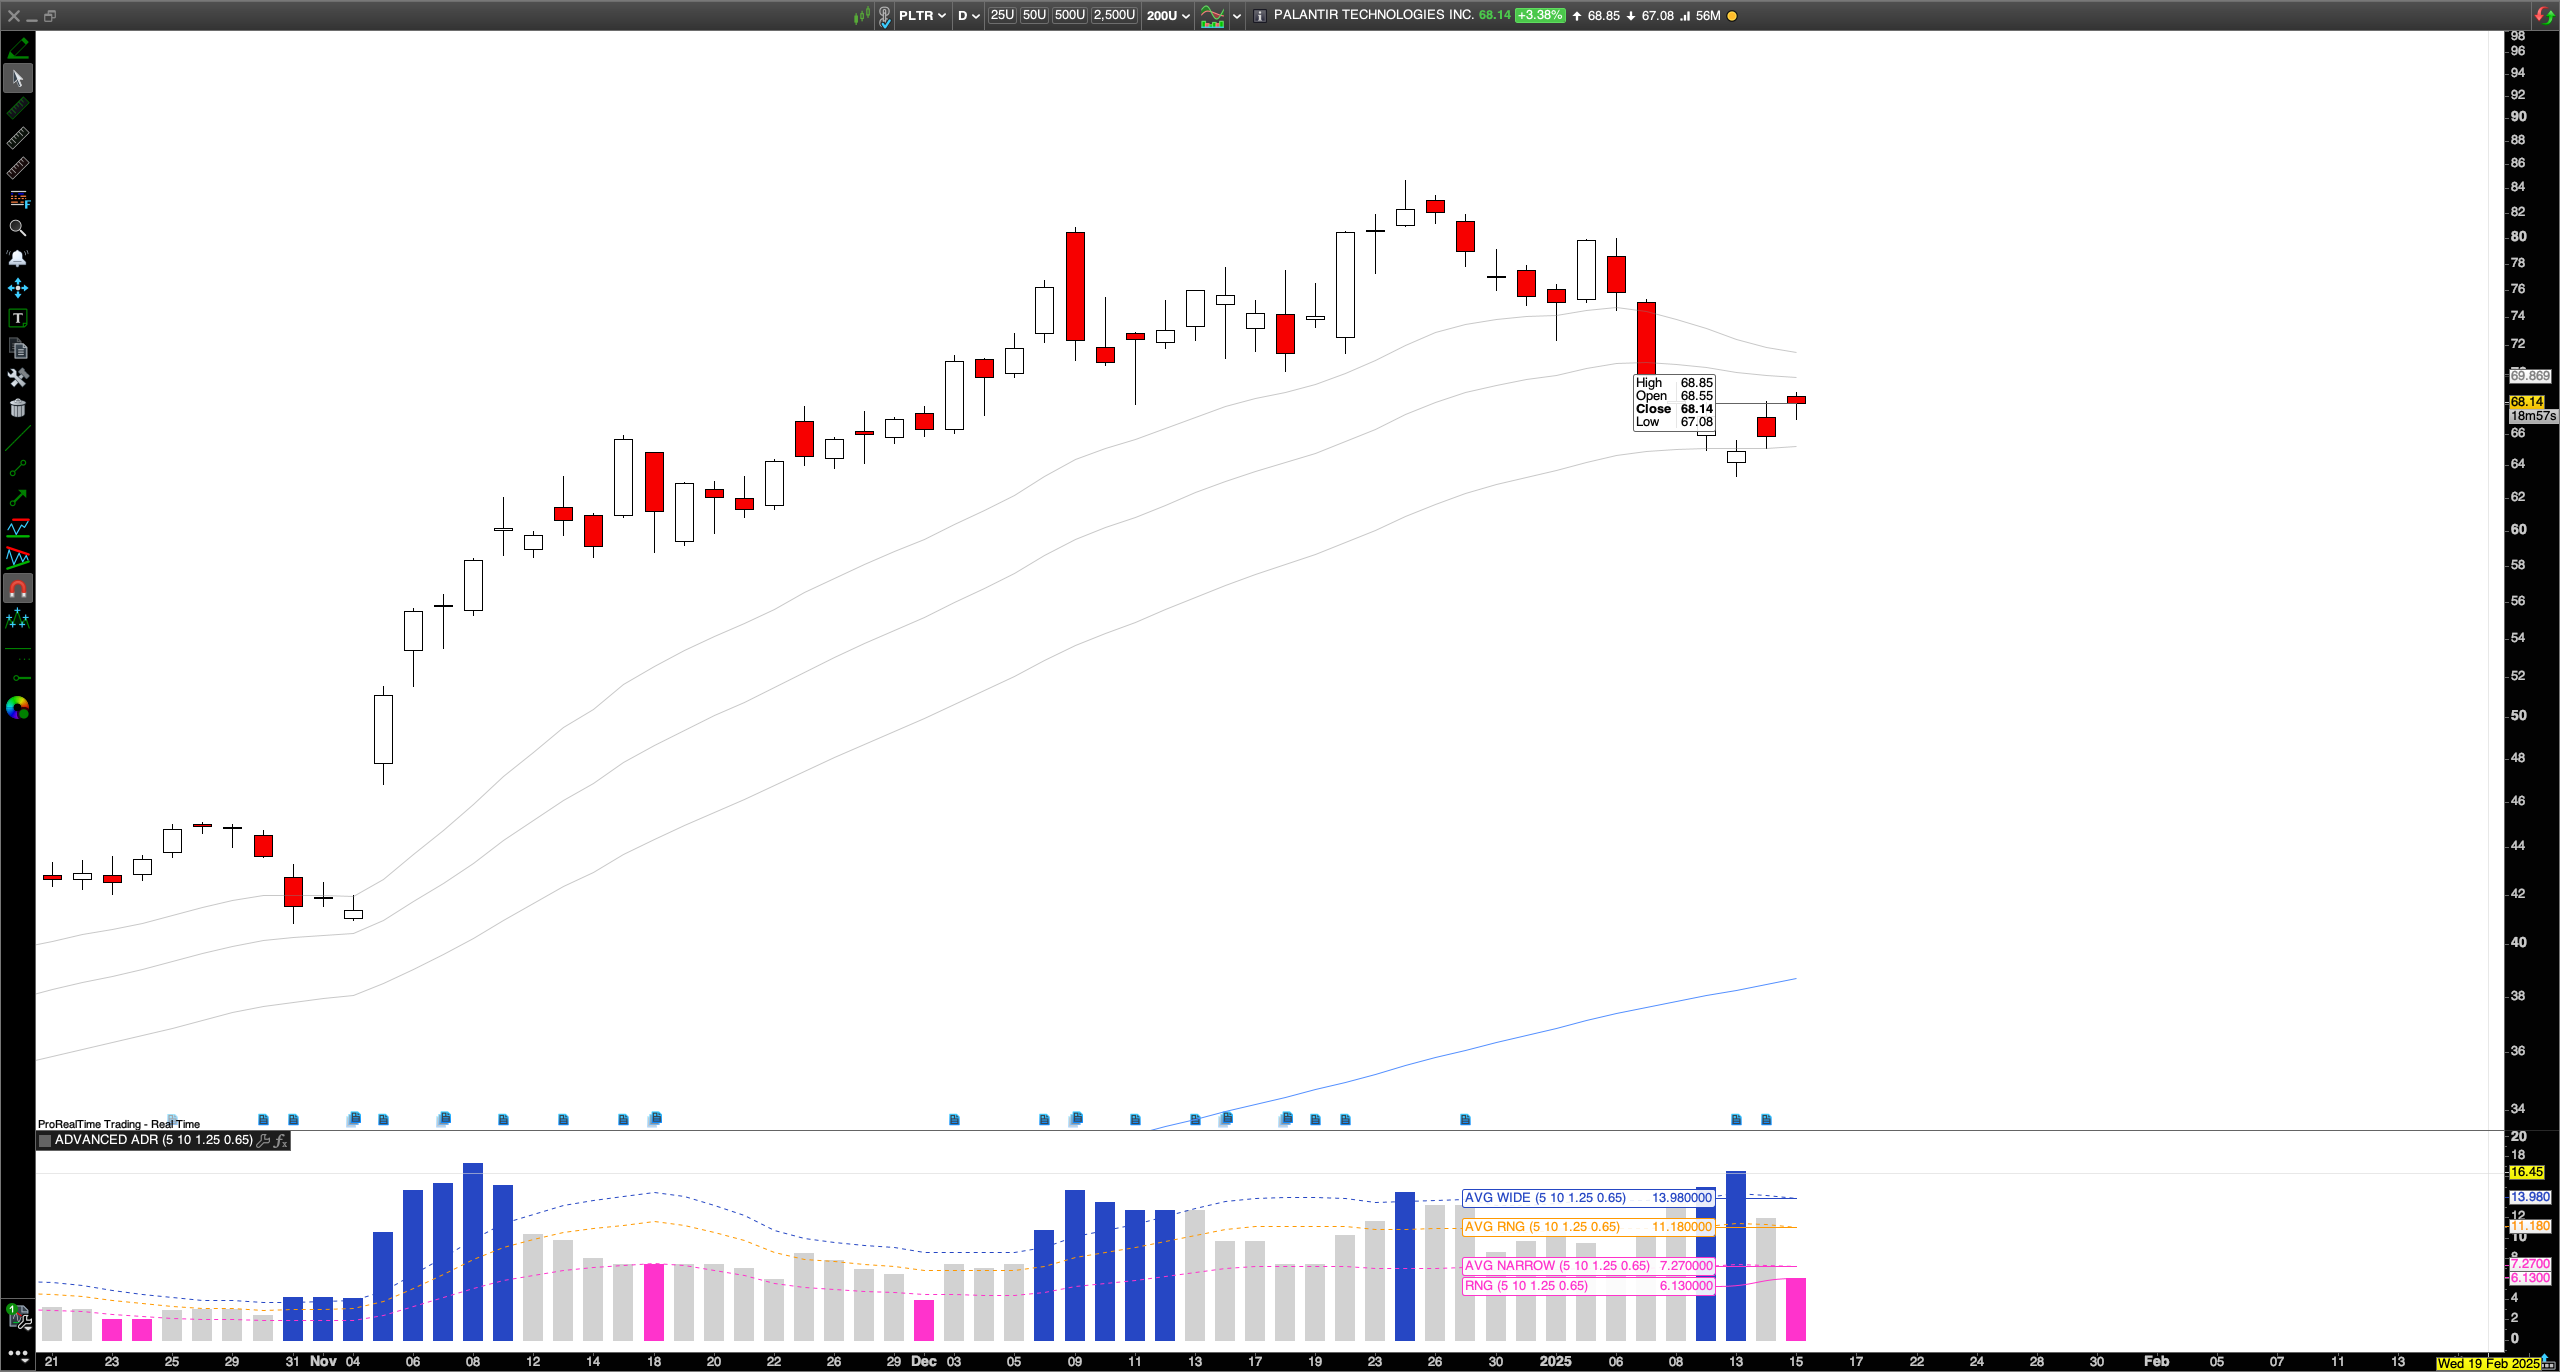
Once plotted, the indicator uses histograms and lines to visually represent volatility states:
- Grey bars: The current period’s range is within the average of the last defined periods (standard range)
- Blue bars: The period’s range exceeds the average by at least 25% (wide range)
- Pink bars: The period’s range is below the average by at least 35% (narrow range)
In addition to the histograms, the ADR indicator provides the following lines:
- AVG Range: The Average range of prices over the last defined periods
- AVG Wide: The extended range calculation as AVG Range * 1.25
- AVG Narrow: The compressed range calculation as AVG Range * 0.65
Example
PLTR shows a 5-day narrow range
Settings
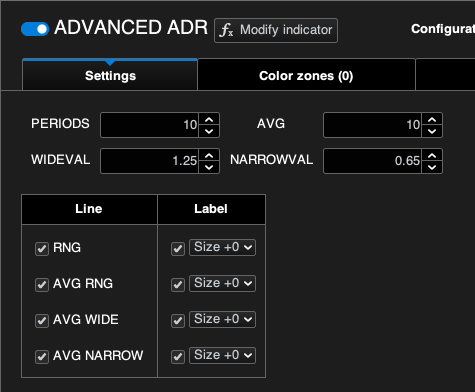
The ADR Indicator is fully customizable to match various tarding styles and analytical needs:
- PERIODS: Define the number of sessions for calculating the daily range. Default is 1 but can be expanded to analyze broader price ranges.
- AVG: Set the number of periods over which the average is calculated. Default is 10 but can be adjusted for finer control.
- WIDEVAL: The % of Average Range that represents expansion (default is 1.25 wich is 125% of Average)
- NARROWVAL: The % of Average Range that represents compression (default is 0.65 wich is 65% of Average)
Benefits for traders
- Understanding volatility states: Quickly identify whether the market is in a low, standard, or high volatility phase
- Predict market behavior: Use narrow ranges to anticipate volatility expansion and wide ranges to prepare for compression
- Adapt across timeframes: Analyze daily, weekly, monthly or customs ranges for diverse market strategies
- Set realistic targets: Leverage ACG Wide and AVG Narrow value to define achievable price targets
Practical use cases
- Compression and expansion analysis: Narrow ranges often precede volatility expansion, while wide ranges suggest an impending reduction in price movement.
- Multiple timeframe application: Combine different settings to analyze overlapping ranges for enhanced forecasting:
- 10-Period AVG on 1-Day Range: Average of 10 single-day ranges
- 10-Period AVG on 3-Day Range: Average of 10 3-day ranges
- 20-Period AVG on 5-Day Range: Average of 20 5-day ranges
- Example: When trading a breakout from a compressed 5-day range, set targets using the AVG Wide line value to anticipate the potential expansion.
The Advanced ADR indicator is an essential tool for traders seeking a structured and data-driven approach to market volatility and price range analysis. Perfect for identifying trade opportunities and setting actionable targets across all instruments and timeframes.
Reference
The concept of Advanced ADR and its application in market analysis is inspired by established ADR methodologies, including insights from Frank Ochoa’s teachings. This indicator has been independently developed and optimized for ProRealTime, offering a practical and efficient tool for traders to leverage these principles in their strategies.


Valoraciones
No hay valoraciones aún.