

 INSTALLAZIONE


The indicator plots the four major actionable events in trading (by Oliver Velez) that should make up the core of all trading activity.
These four events represent the majority of trading opportunities in the market. Here’s a summary:
- Elephant Bar: This represents about 65% of all trades in the market. There are different versions of Elephant Bars, but the majority of trades stem from some version of an Elephant Bar. The speaker emphasizes that traders can make their entire living in the markets just based on Elephant Bars.
- Tail Bar: There are different versions of a Tail Bar as well. The speaker focuses on the main one where you have a green top. A Tail Bar is not just any bar with a wick on it. A Tail Bar is more special. It’s a bar where the tail represents about 85% of the entire bar.
- Bull/Bear 180: This is where you have a Red Elephant Bar immediately reversed by an even bigger, more powerful Green Elephant Bar. This is considered the quintessential Bull 180.
- Red/Green Bar Ignored (RBI): This is when you have one Red Bar that immediately gets ignored. The quintessential RBI is when you have strength to the left that immediately experiences a pause, but the pause is small. The best is when that pause is in the upper portion of the strength to the left of it.
Please refer to the following video to get more insights and knowledge about these events:
https://youtu.be/fXyfhLBFpME?list=LL
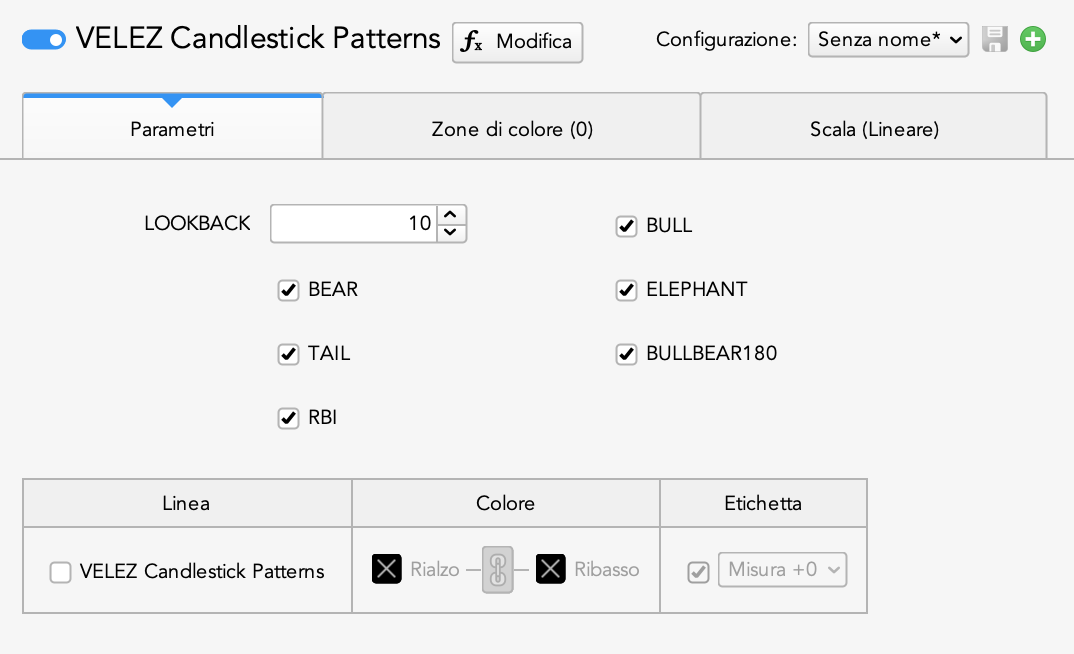
Indicator settings:
- LOOKBACK: the number of candles to calculate the average of pattern ranges (10 by default)
- BULL: flag to plot bullish patterns
- BEAR: flag to plot bearish patterns
- ELEPHANT: flag to plot Elephant Bar
- TAIL: flag to plot Tail Bar
- BULLBEAR180: flag to plot Bull 180
- RBI: flag to plot Red/Green Bar Ignored (RBI)
- POSITION: flag to plot pattern events only at suitable location (near 20MA or 200MA)
Recensioni
Ancora non ci sono recensioni.