

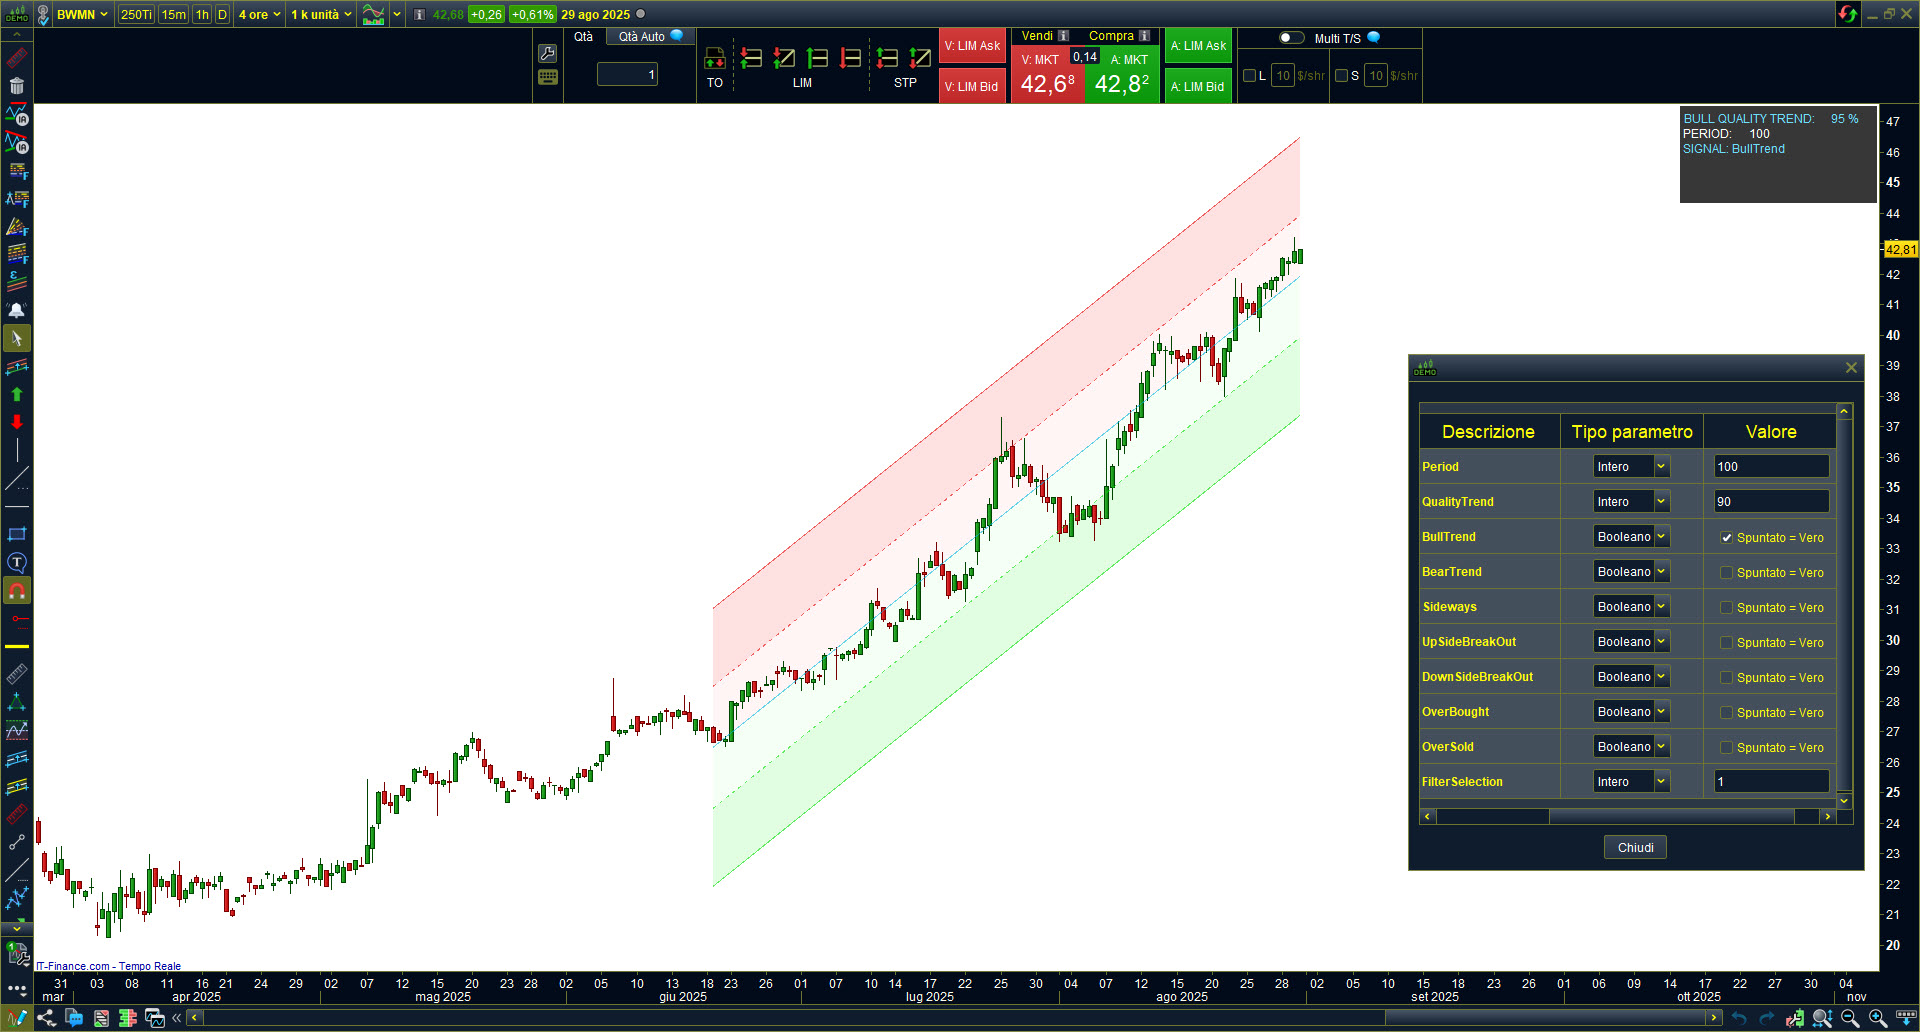
THE INDICATOR WORKS DIRECTLY ON THE INDIVIDUAL MARKET’S CHART, DISPLAYING IN REAL TIME:
- the trend direction (BullTrend, BearTrend, Sideways),
- the calculation period used
- the trend quality
- any active signals
- the 5-line channel
- In addition, the indicator lets you create custom alerts: you can define specific conditions and receive automatic notifications whenever they occur.
INDICATOR DESCRIPTION:
When applied to a chart, the indicator:
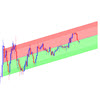
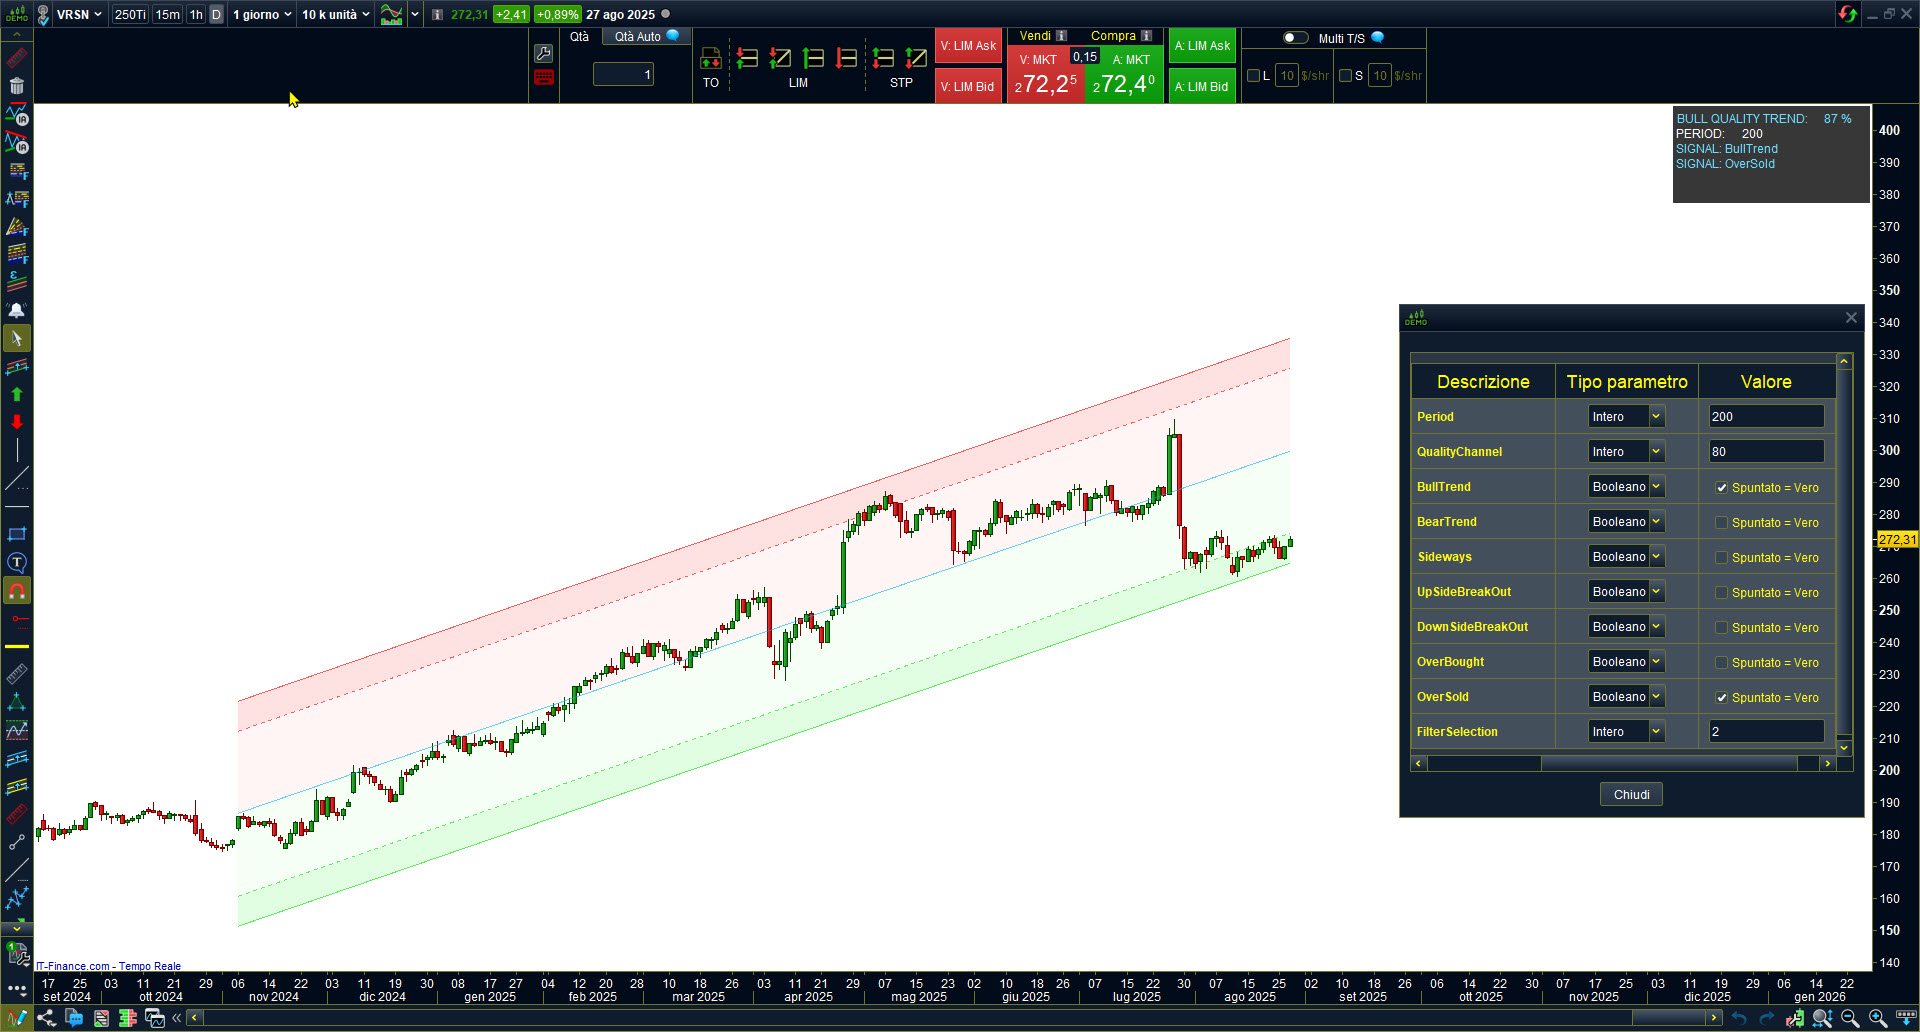
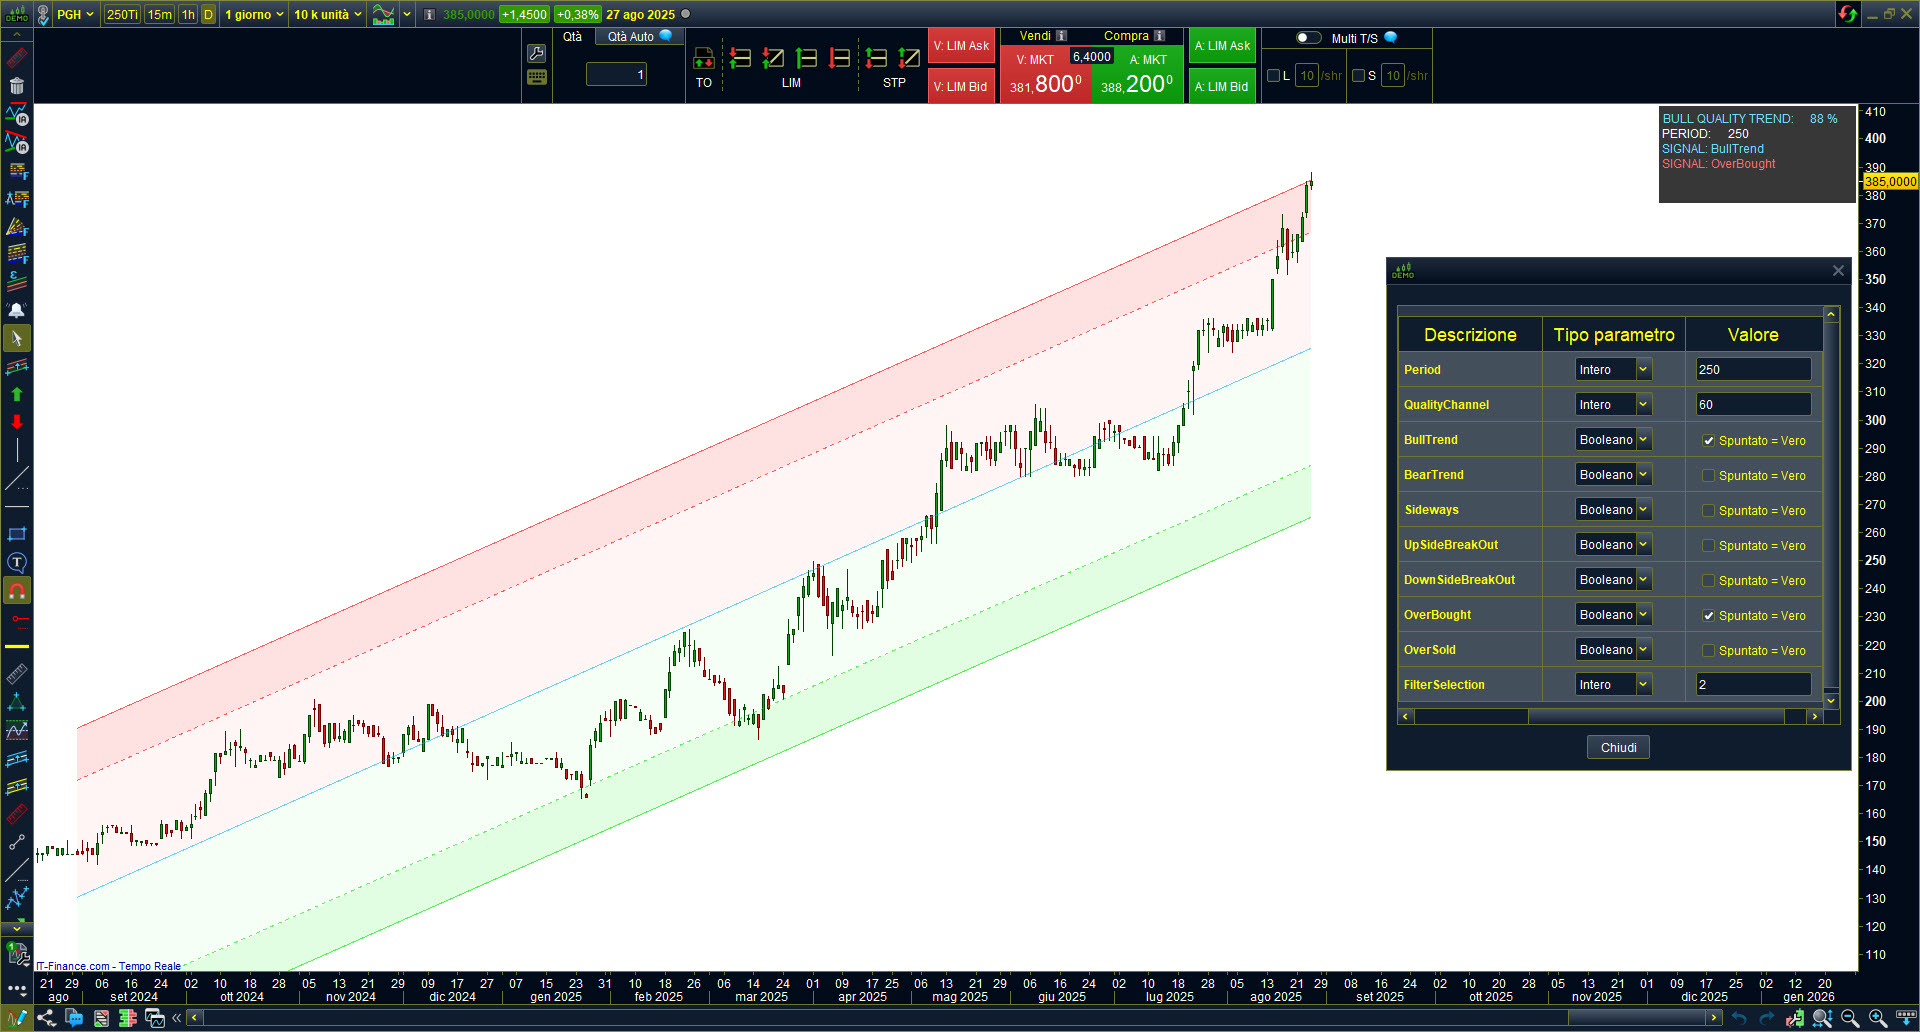
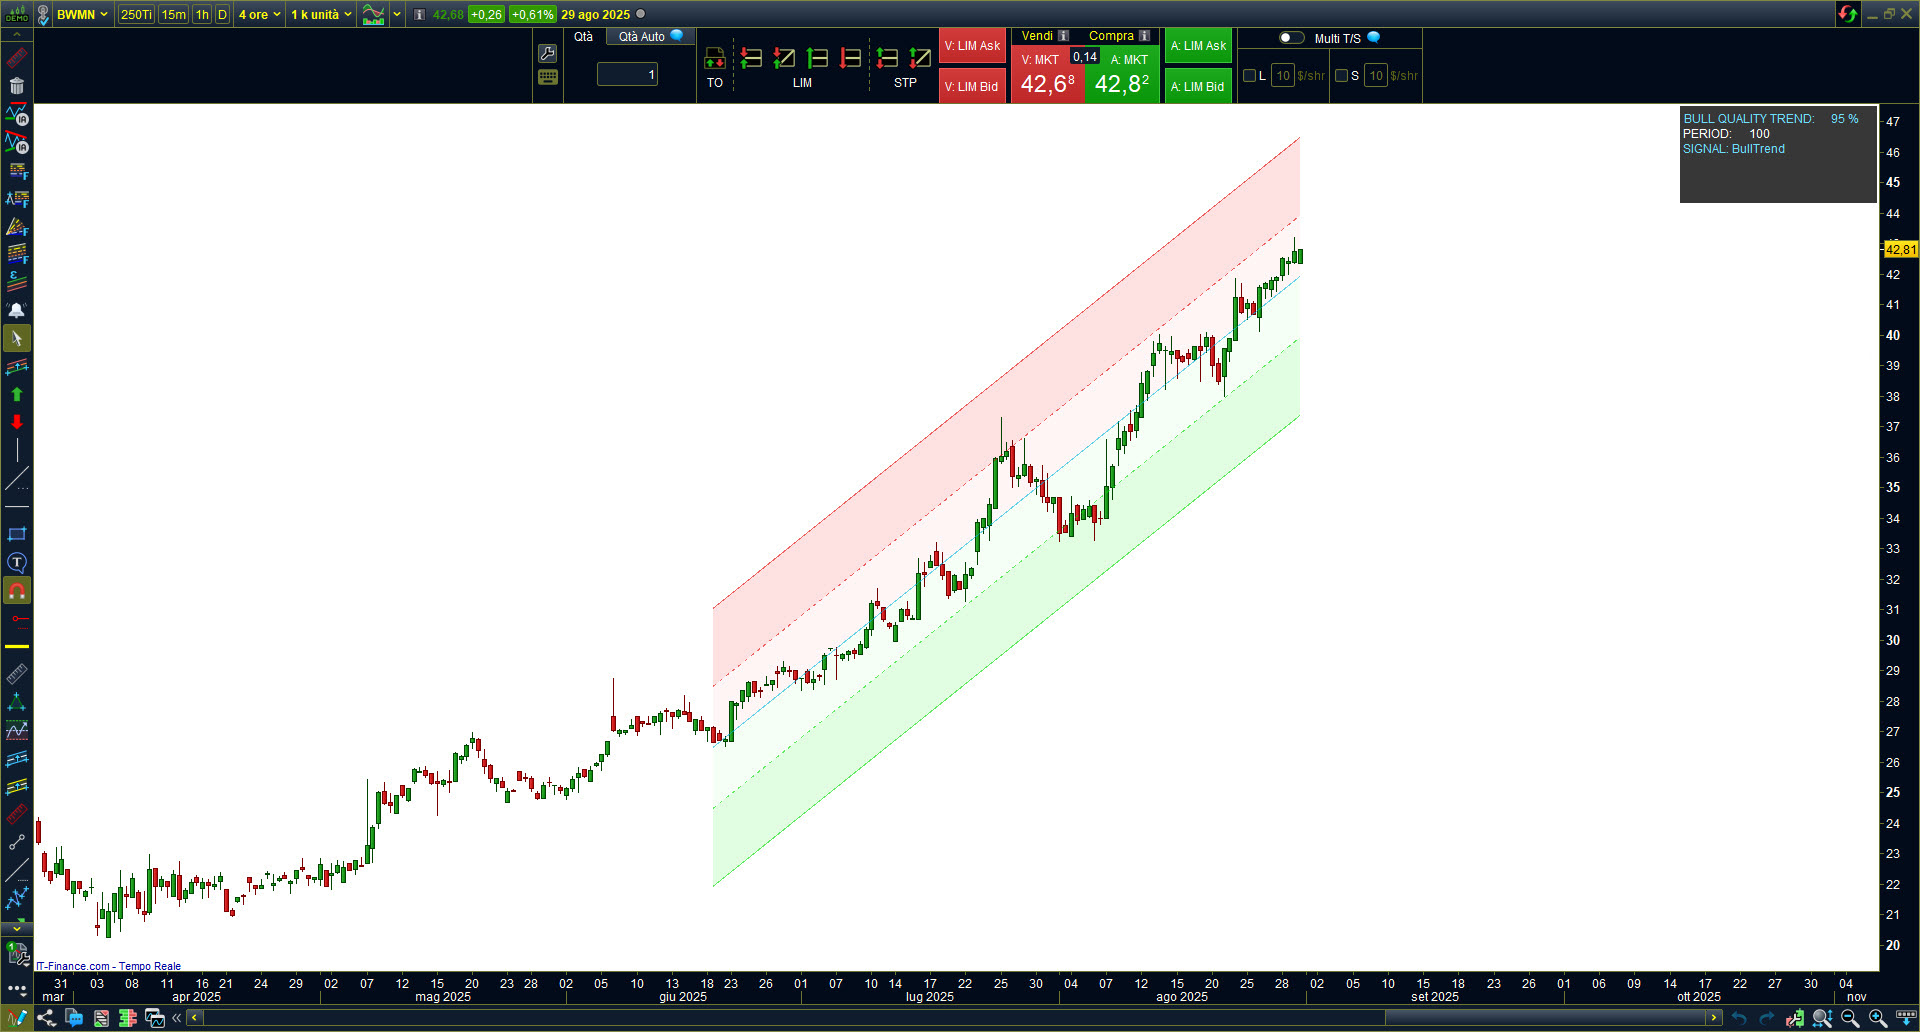
- Draws the 5-line regression channel, useful for spotting trends and extremes.
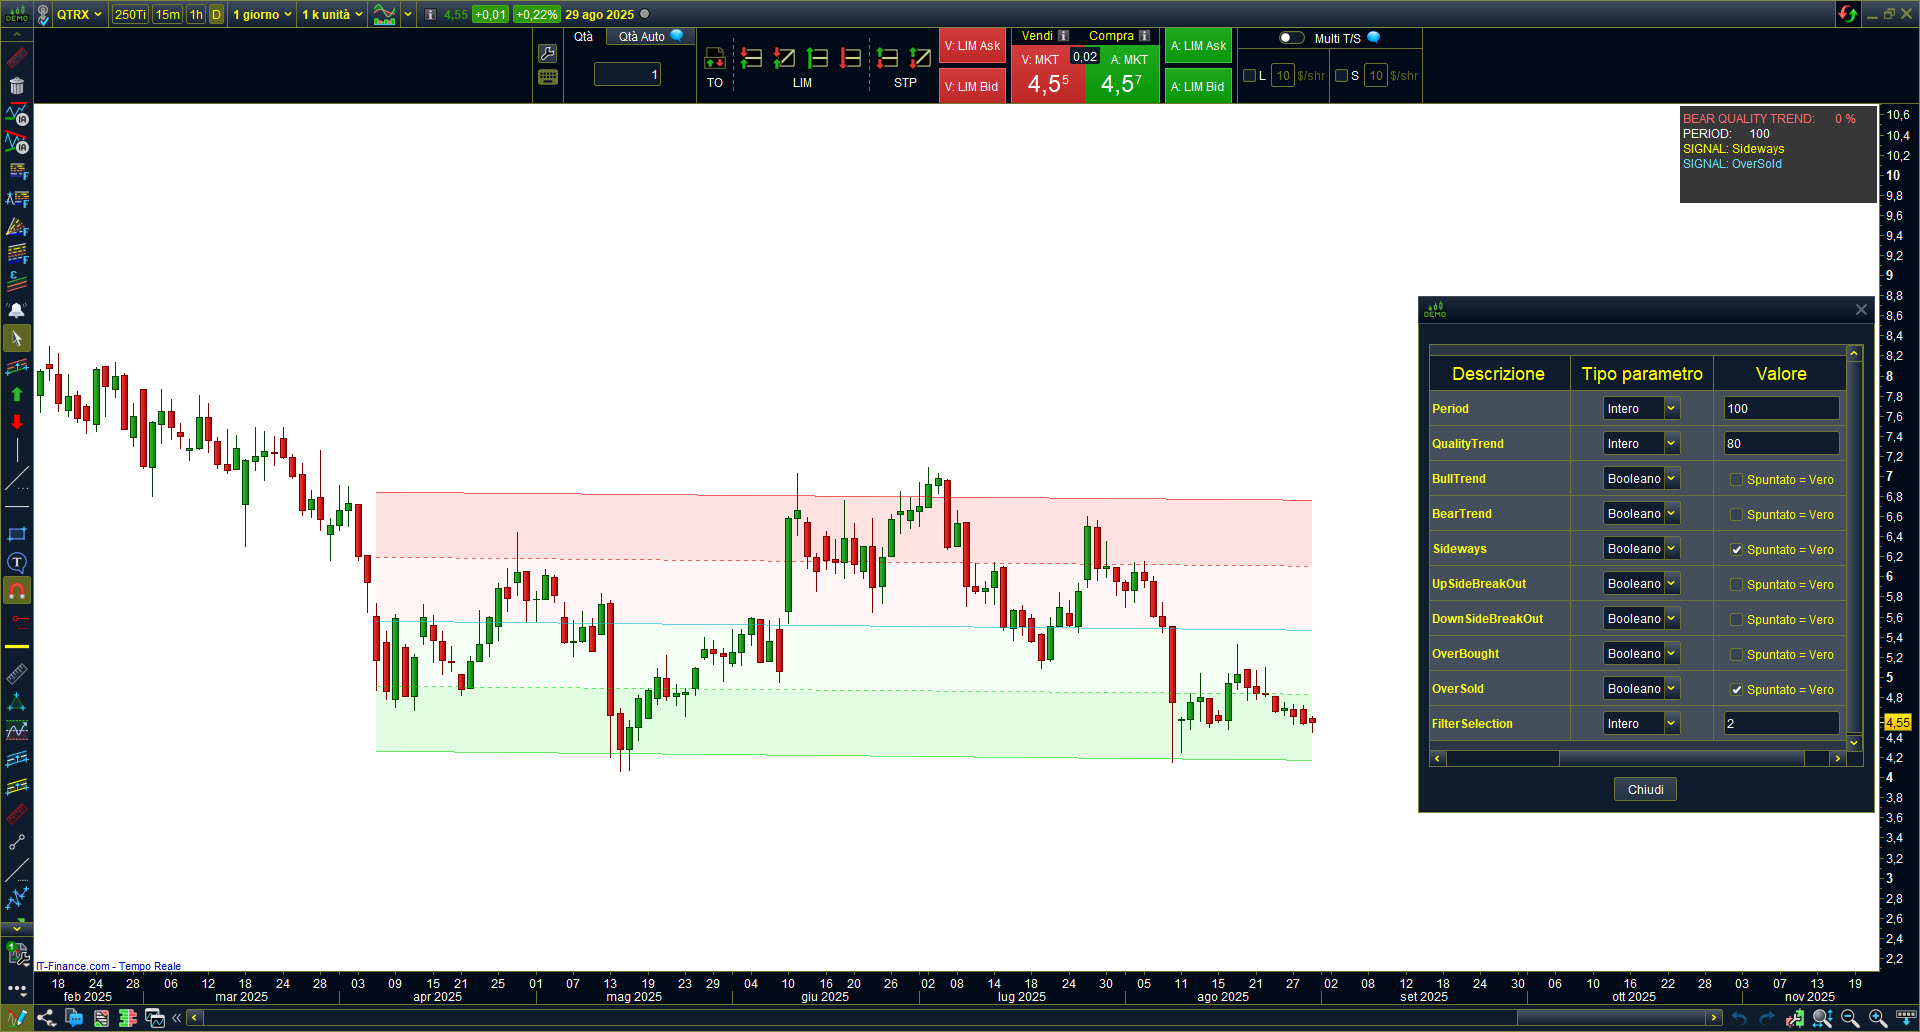
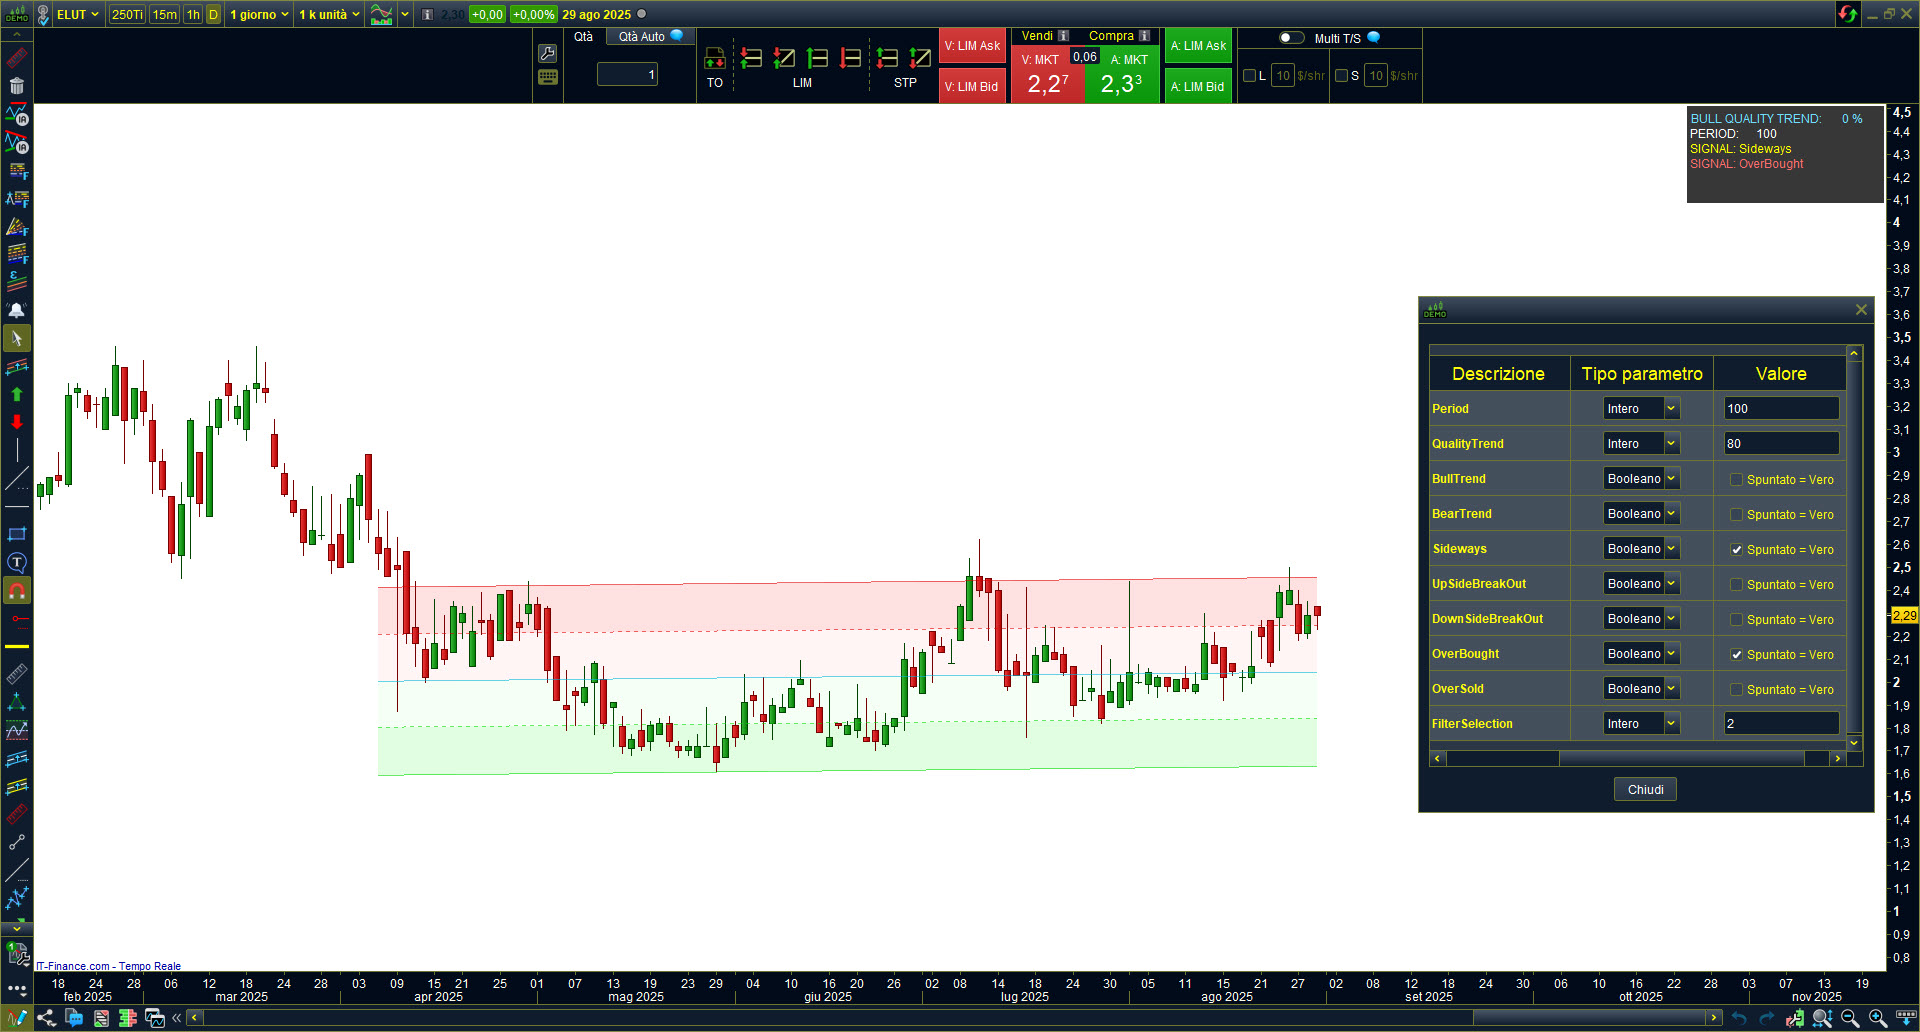
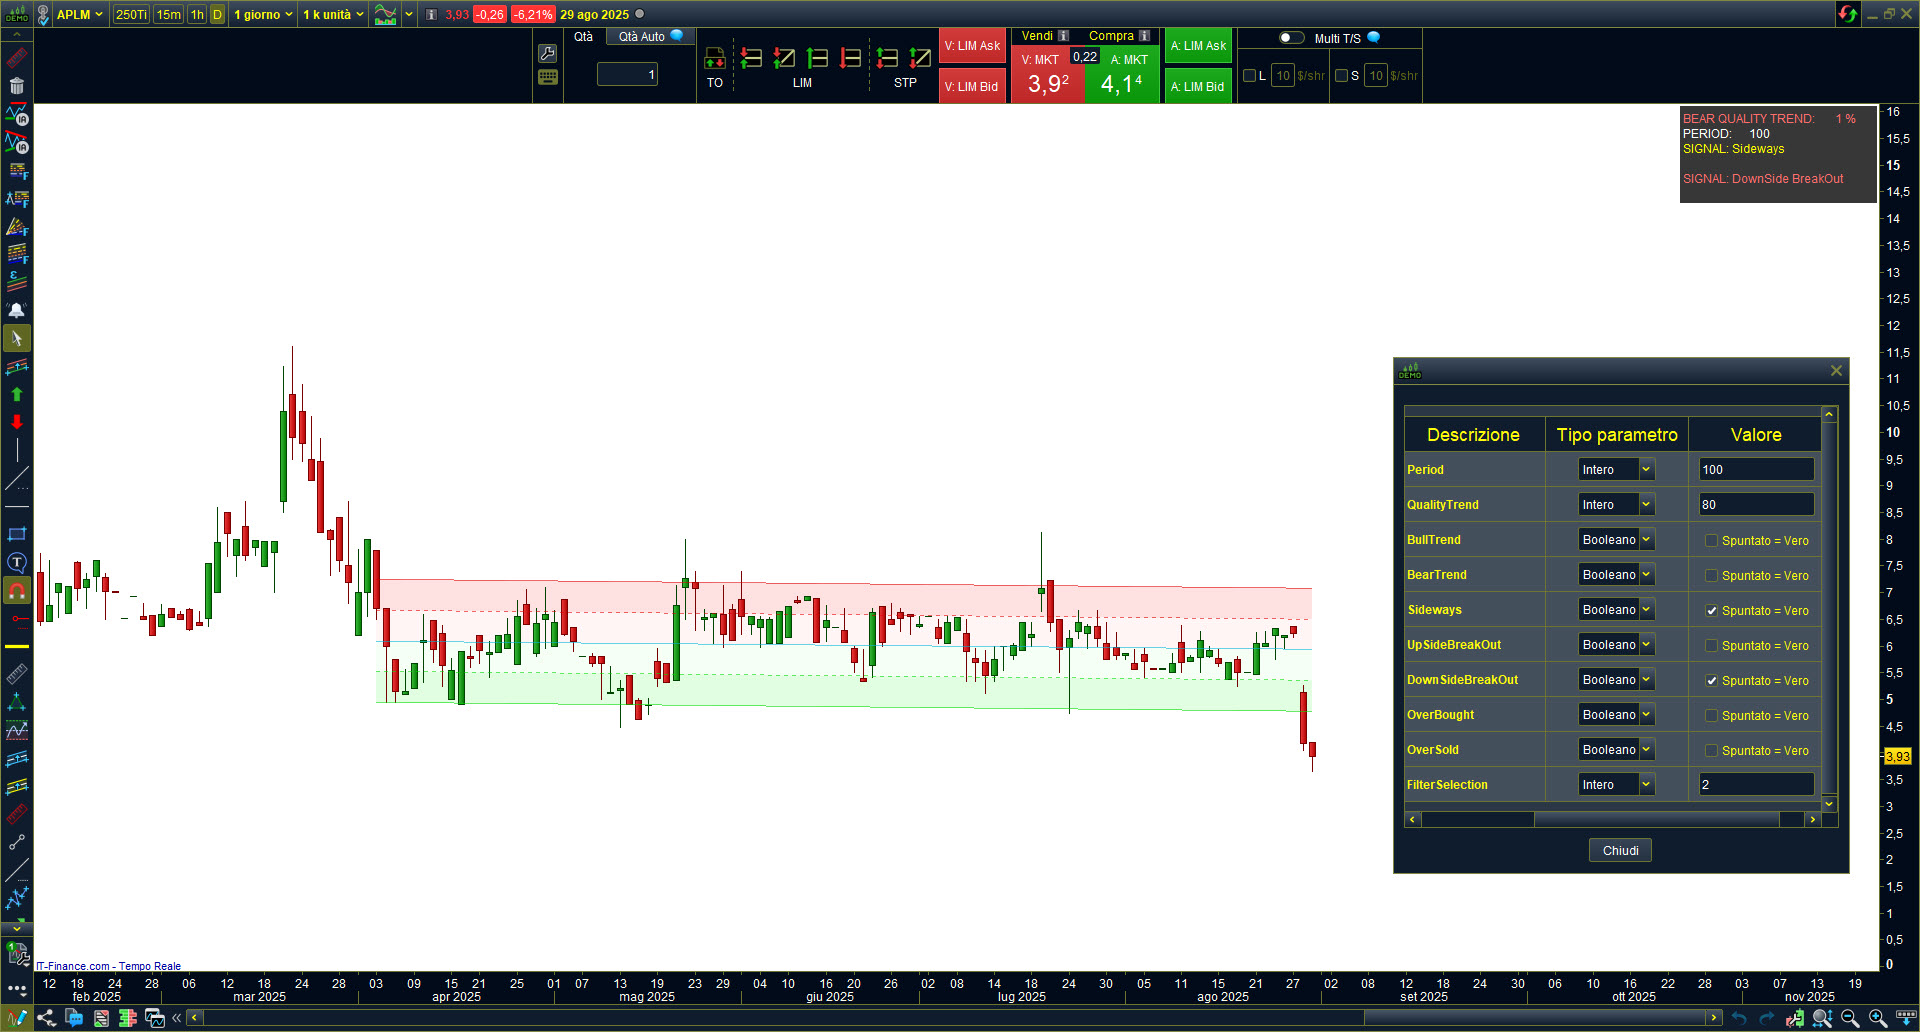
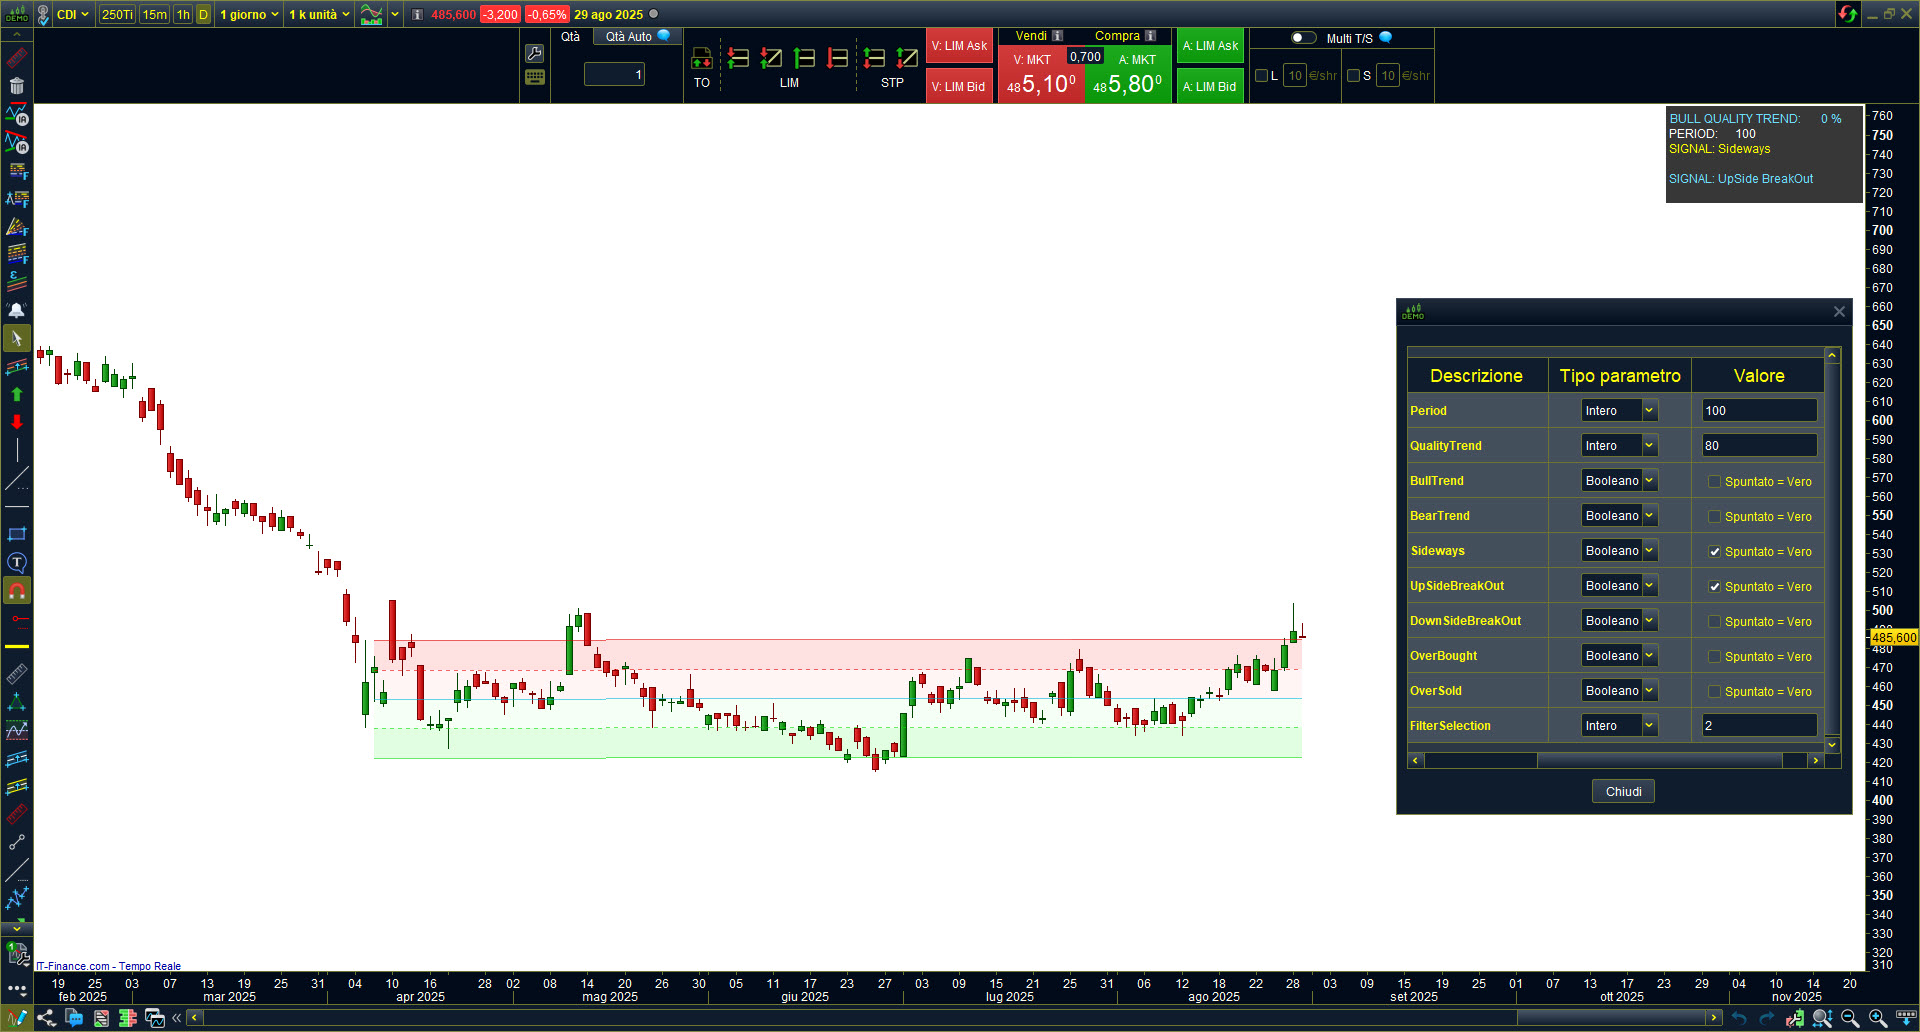
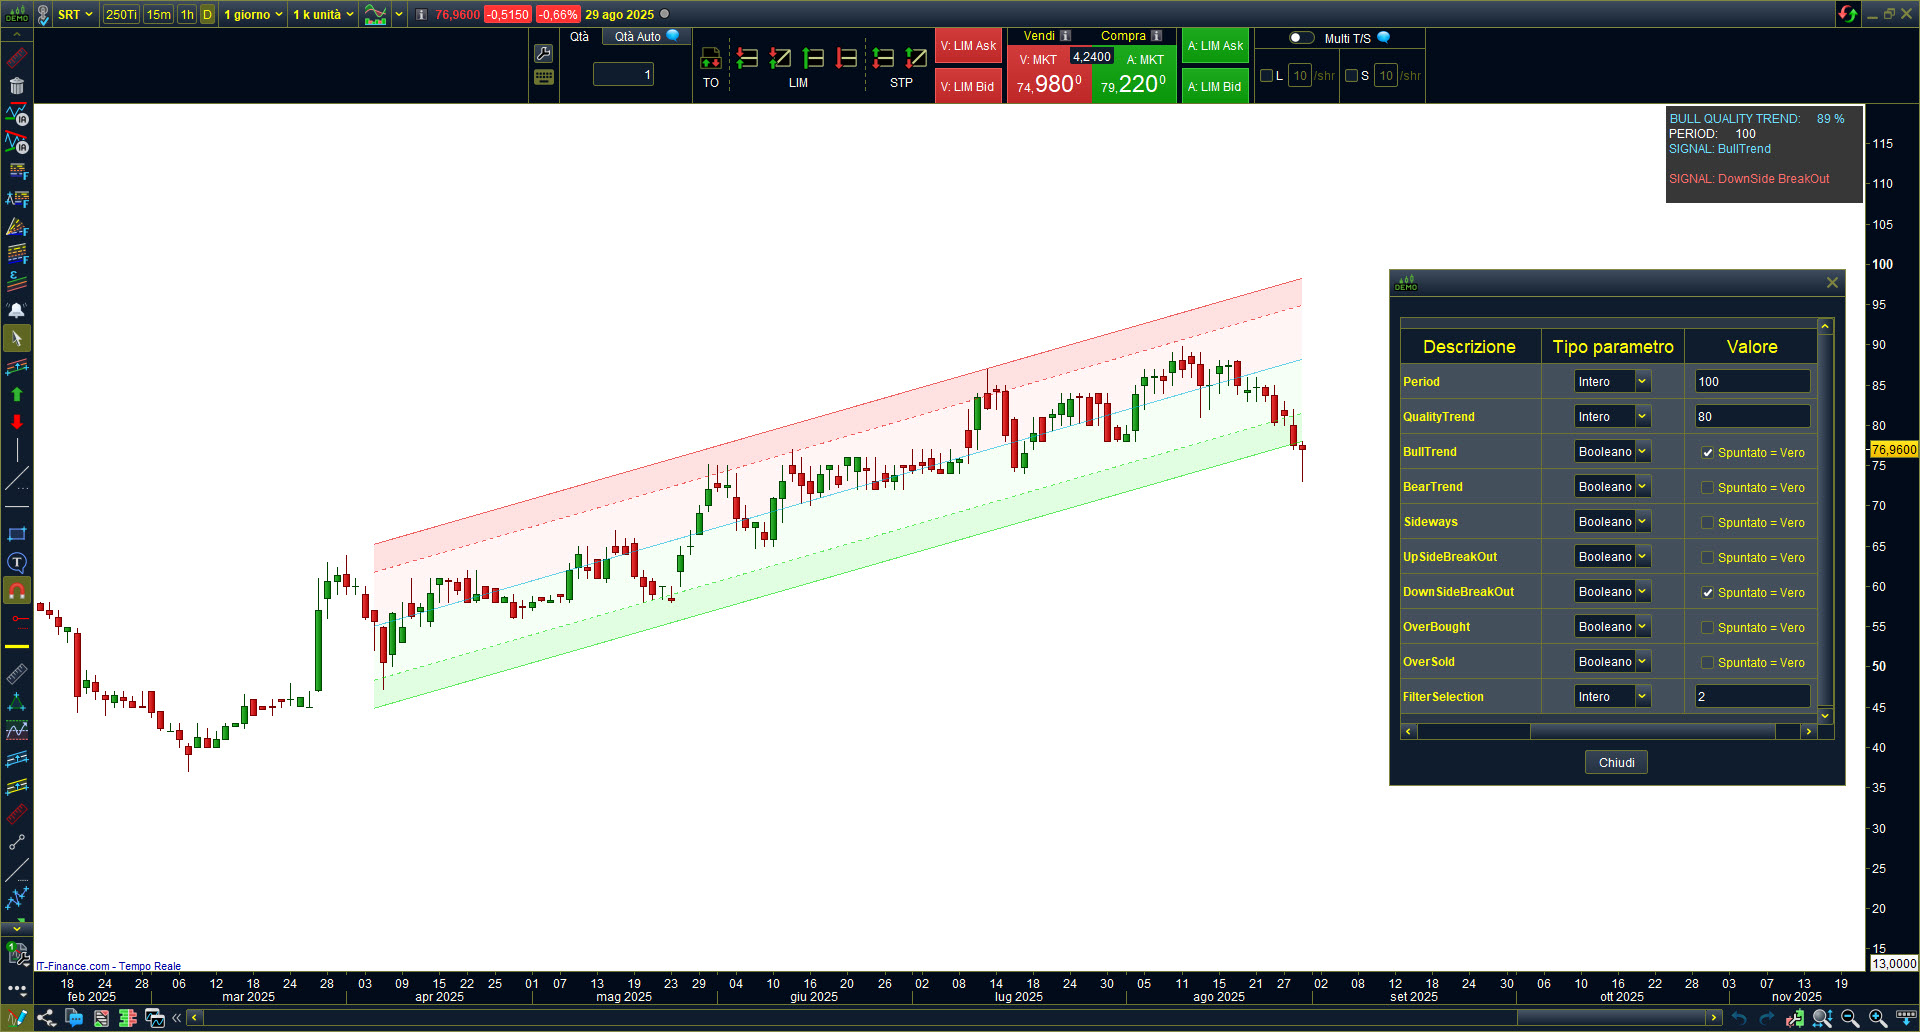
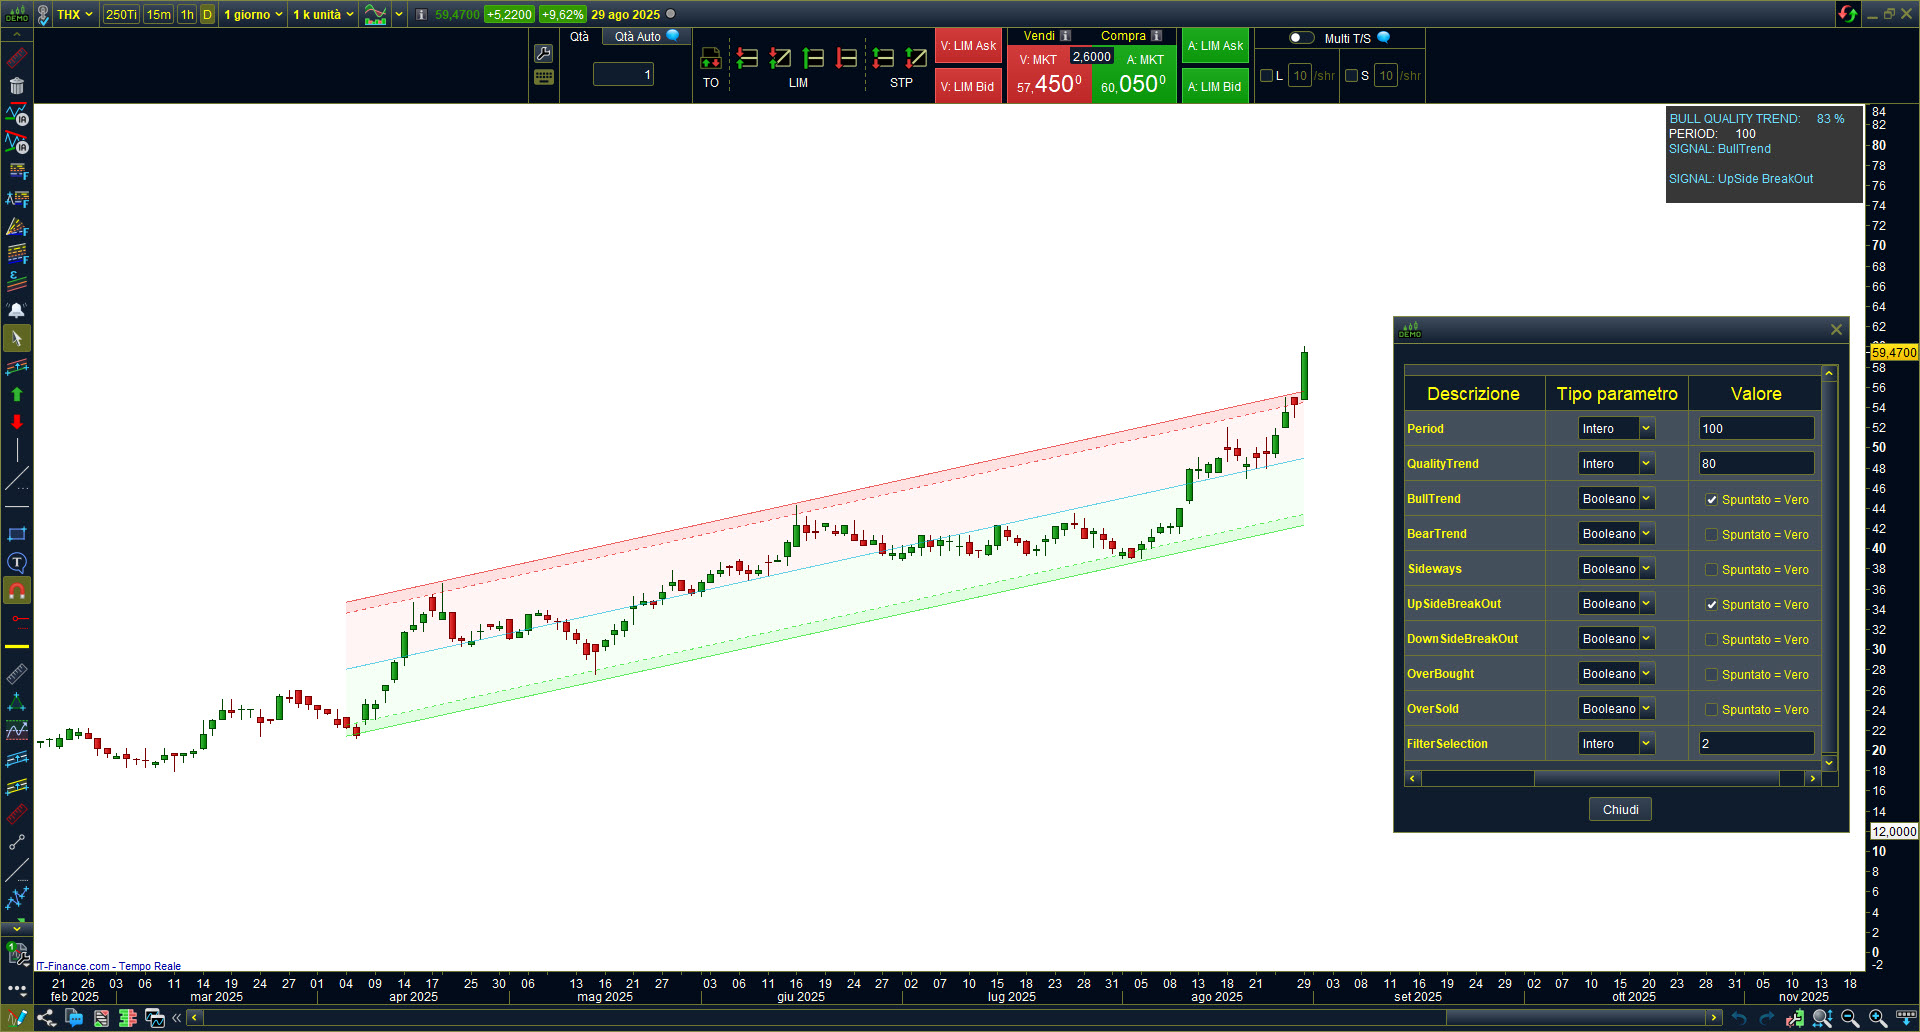
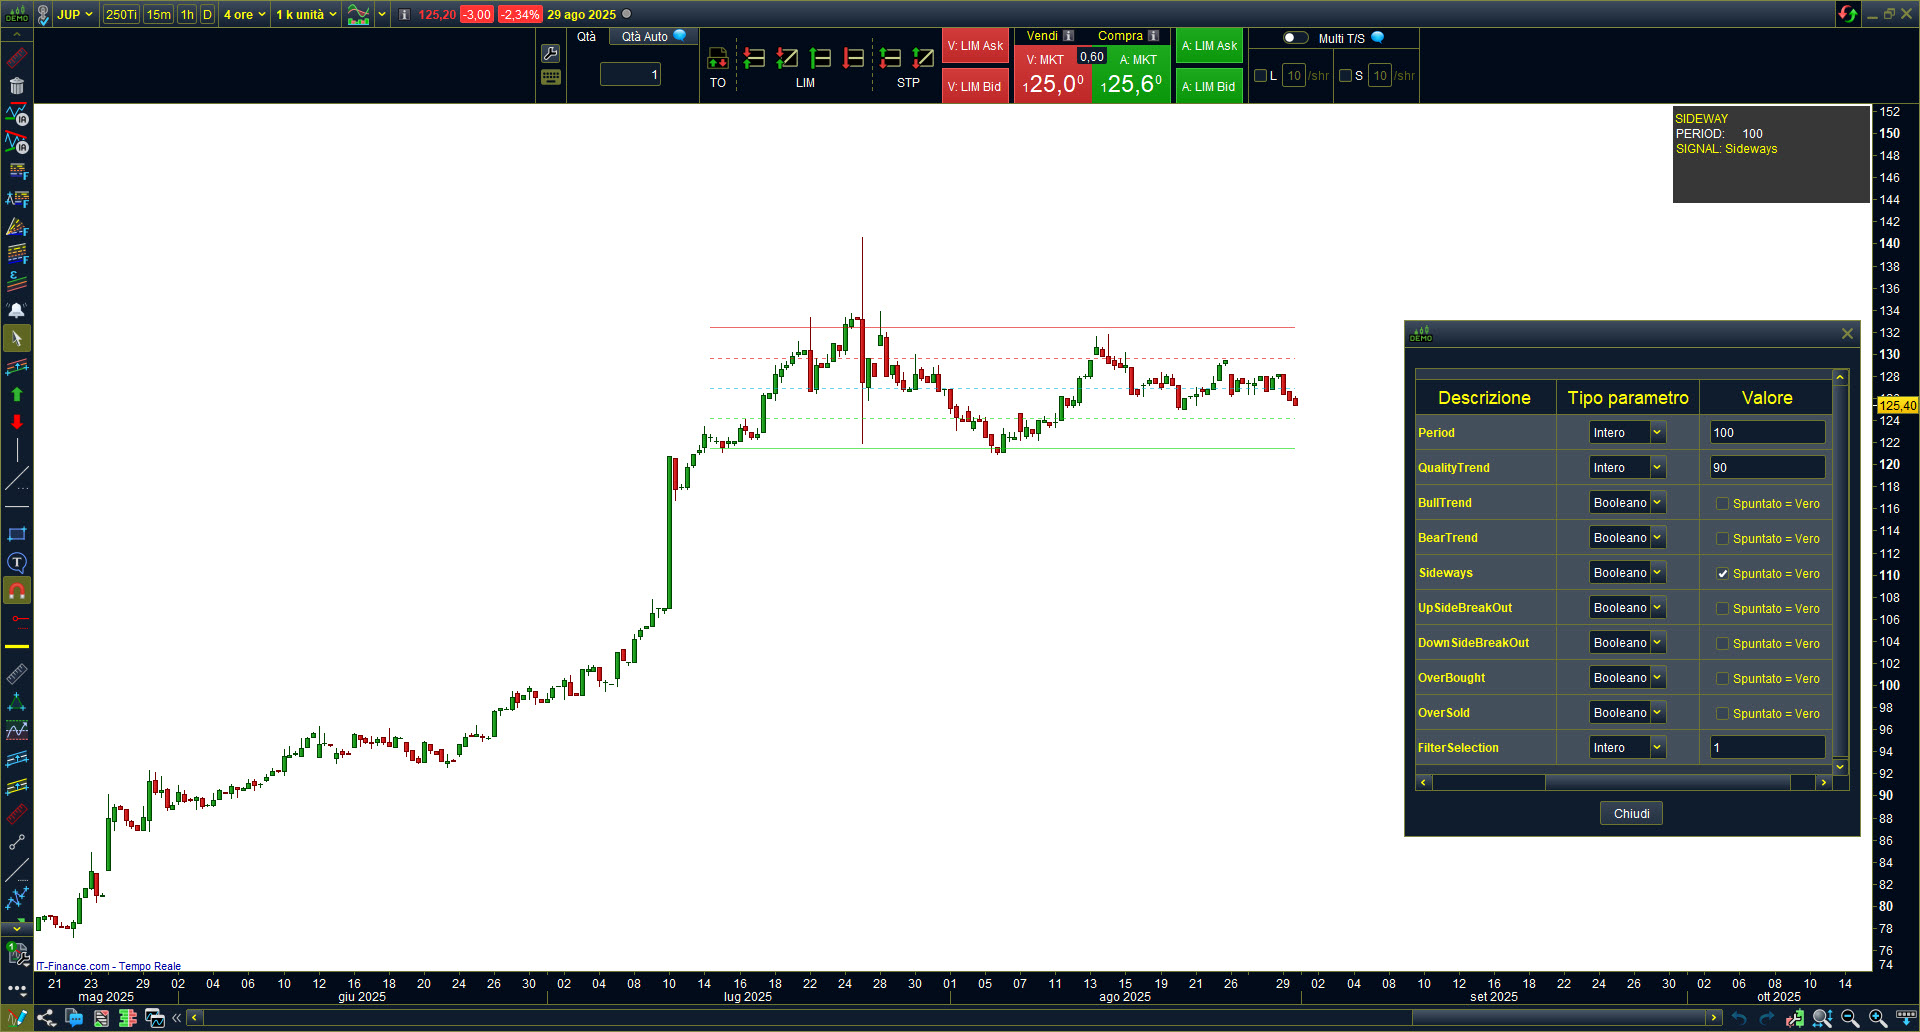
- Shows an on-chart information panel that indicates the current state of the market (BullTrend, BearTrend, Sideways, etc.), the trend quality, and the period, highlighting any active signals at that moment (BreakOut, OverBought, OverSold).
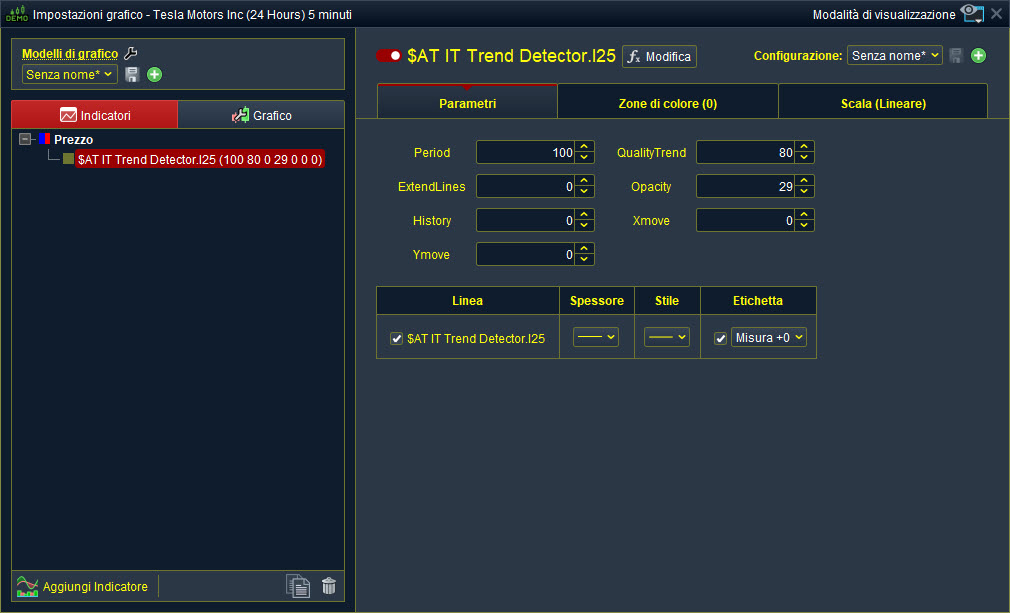
AVAILABLE VARIABLES IN THE INDICATOR:
- PERIOD: Sets the number of bars used to compute the channel (short-, medium-, or long-term trend).
- QUALITYTREND: Threshold value that governs the generation of BullTrend and BearTrend signals (and their combinations). Signals appear only if the computed trend quality exceeds the set threshold. It is always displayed in the on-chart panel.
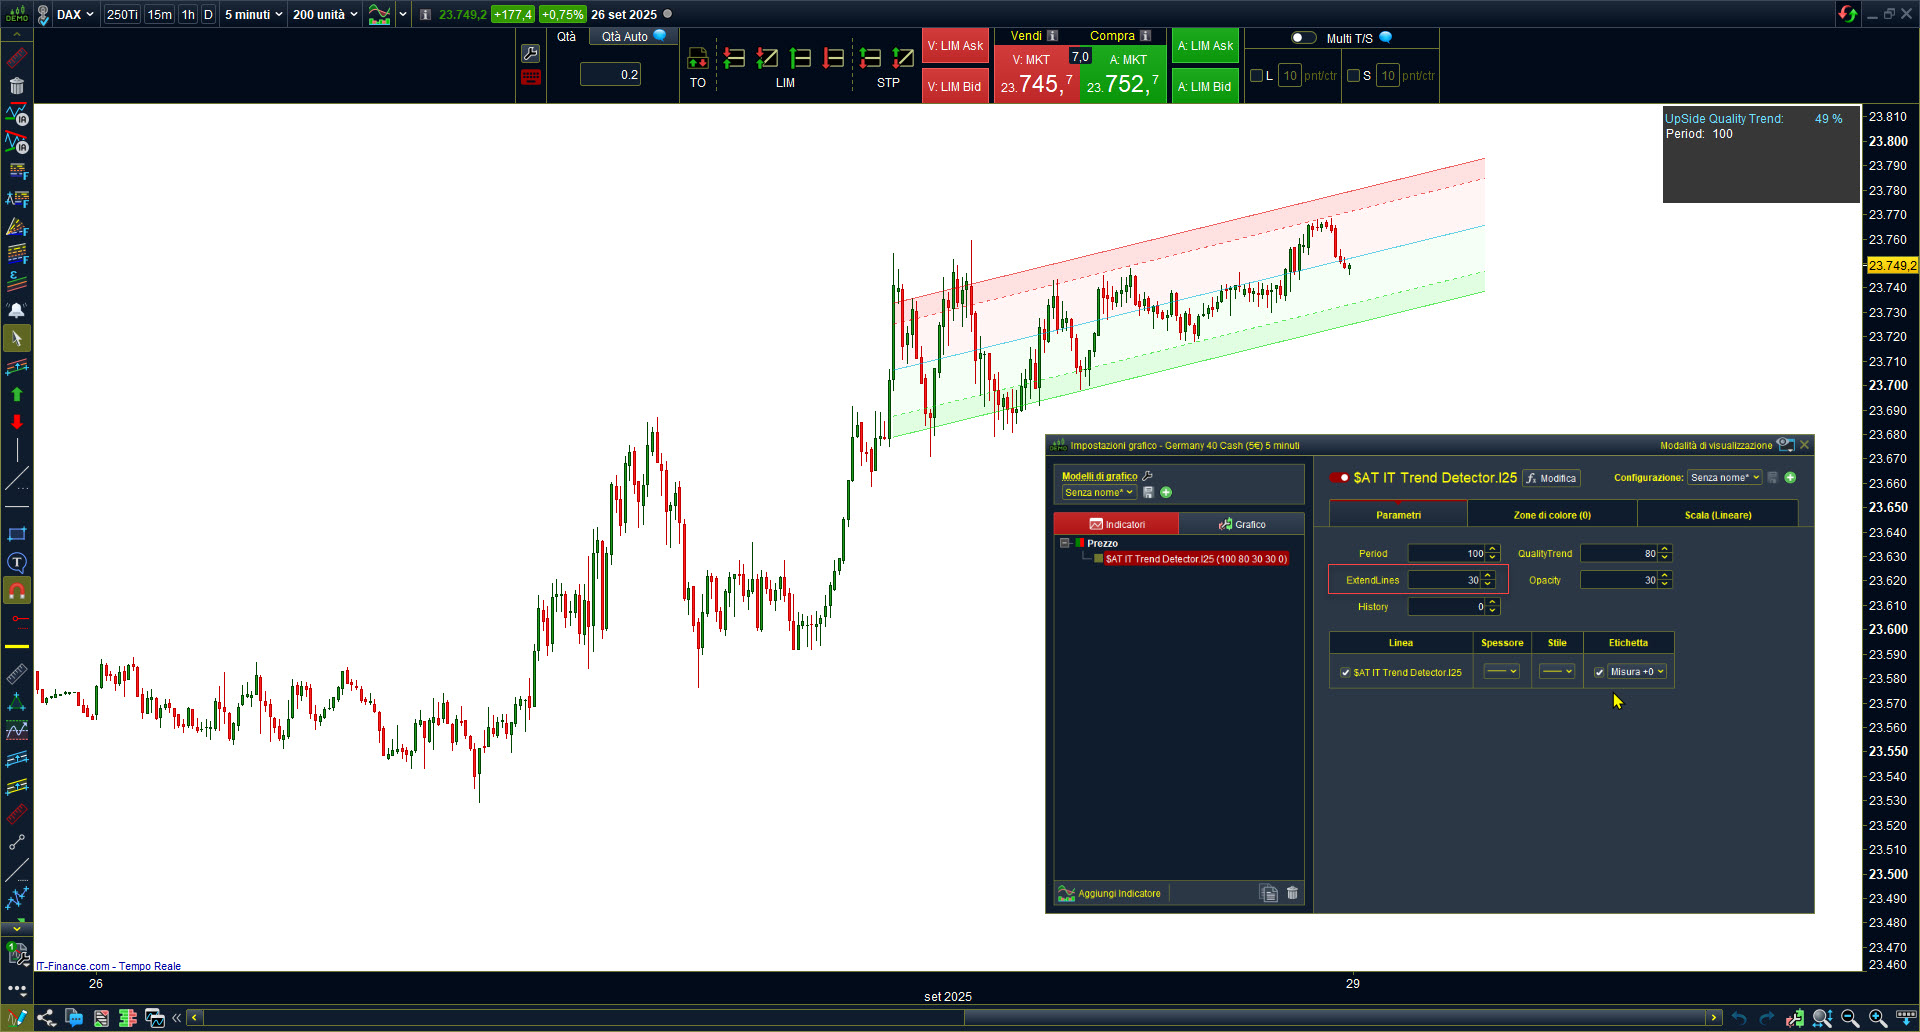
- EXTENDEDLINES: Extends the channel lines beyond the last bar, anchoring the channel to the latest point.
- OPACITY: Controls the transparency of the channel drawn on the chart, making it more or less visible.
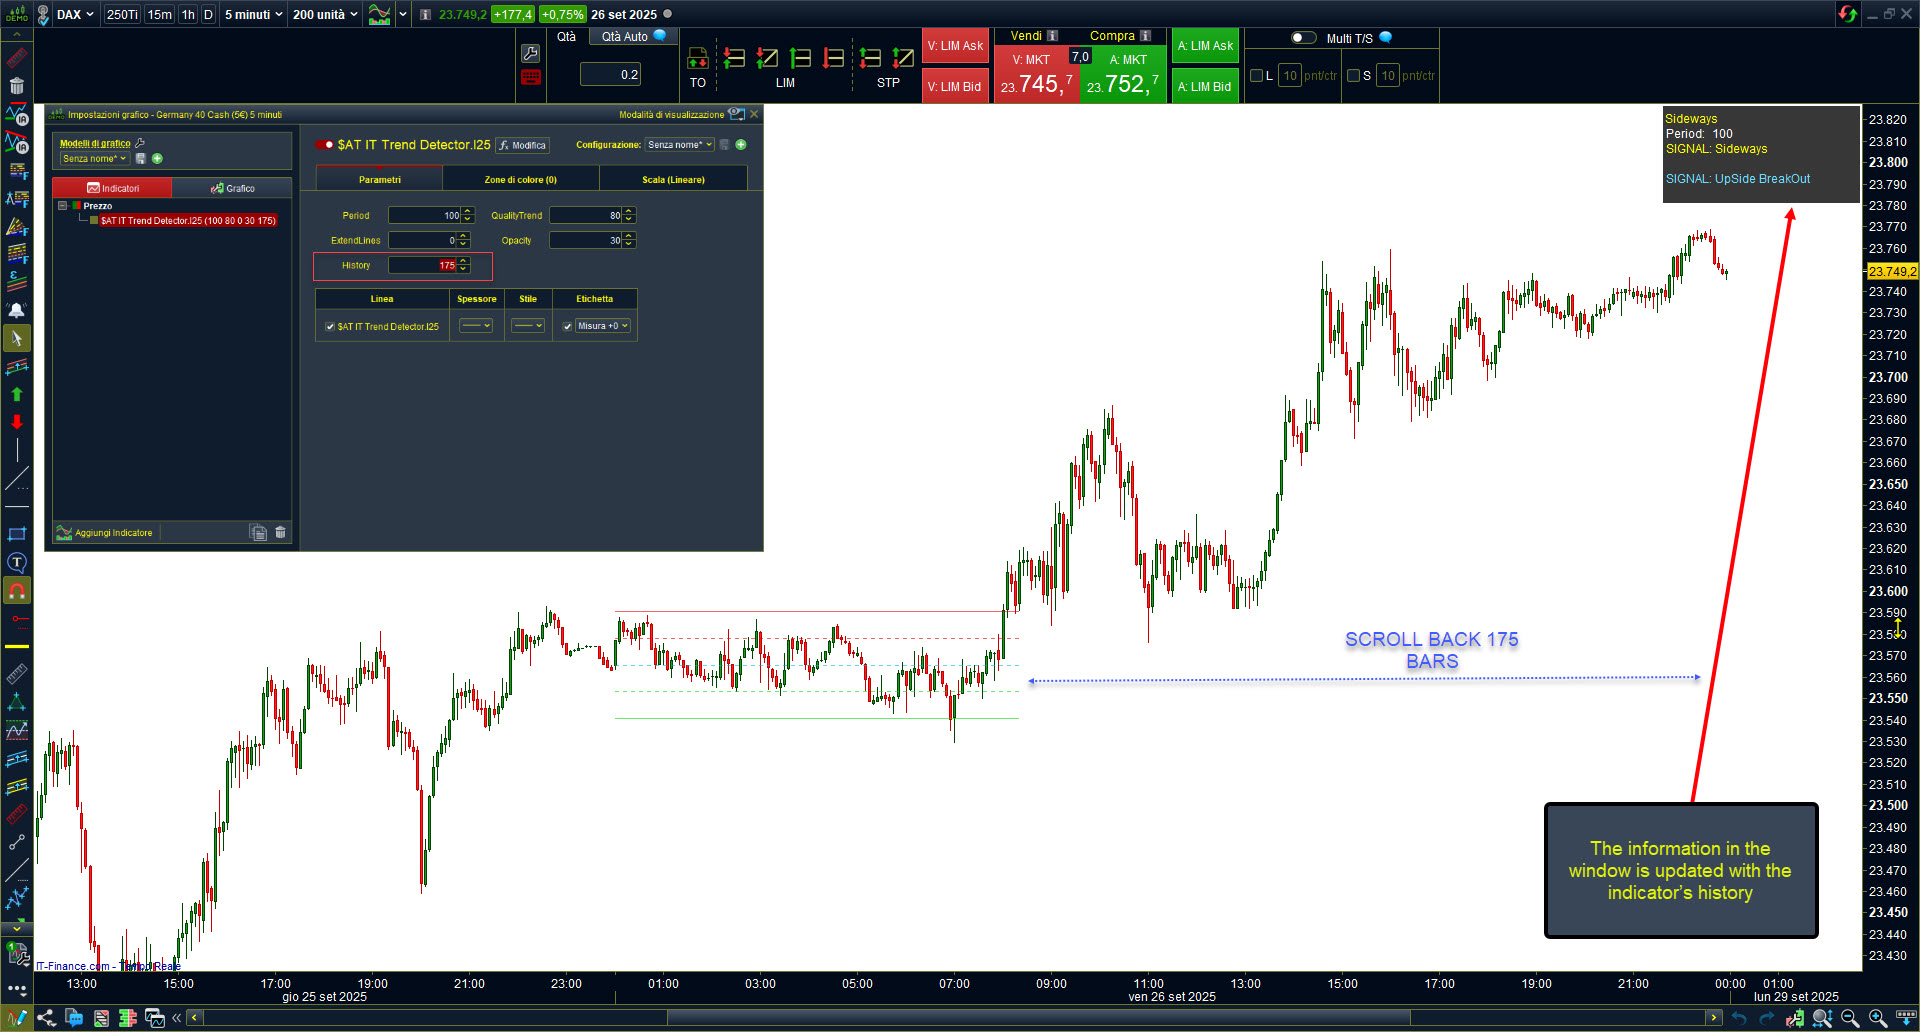
- HISTORY: Allows you to shift the indicator back in time to analyze how it would have reacted to past market conditions.
- YMOVE: Moves the information panel vertically (up or down) to avoid overlapping when multiple indicators are applied.
- XMOVE: Moves the information panel horizontally (left or right) to keep each panel clearly visible on the chart.
- 📌 See the images below for practical examples of how the Xmove and Ymove variables work, especially when applying multiple instances of the indicator with different settings.
-
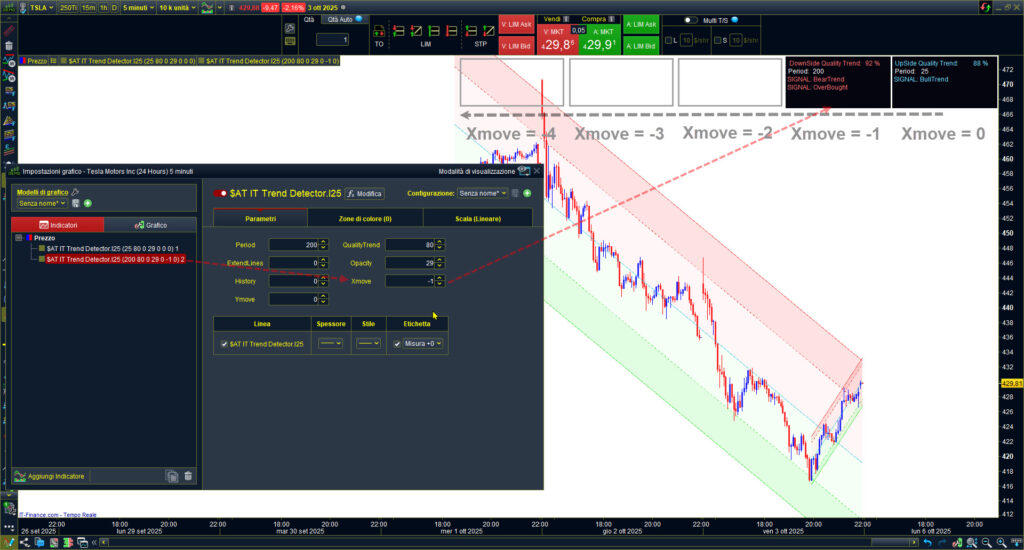
- Xmove
-
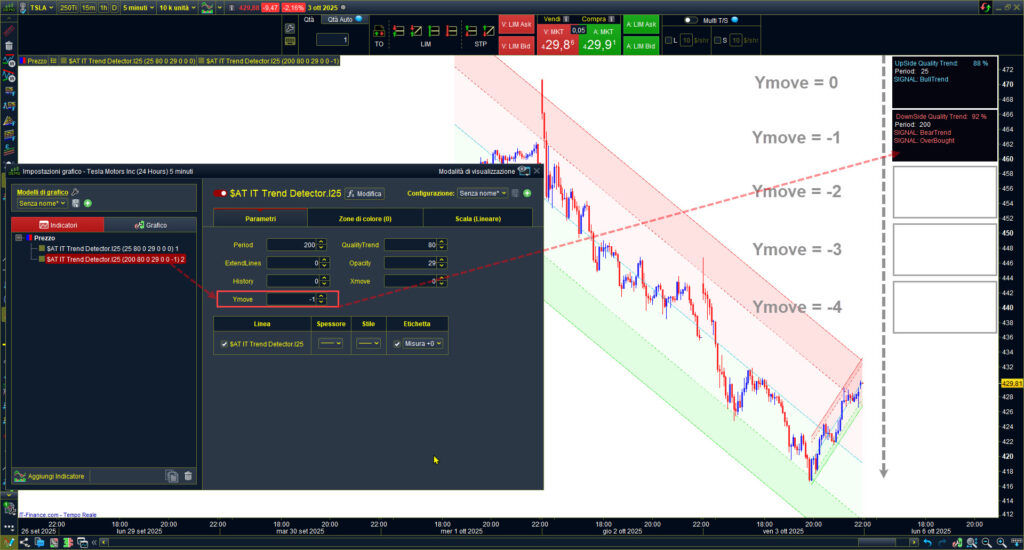
- Ymove
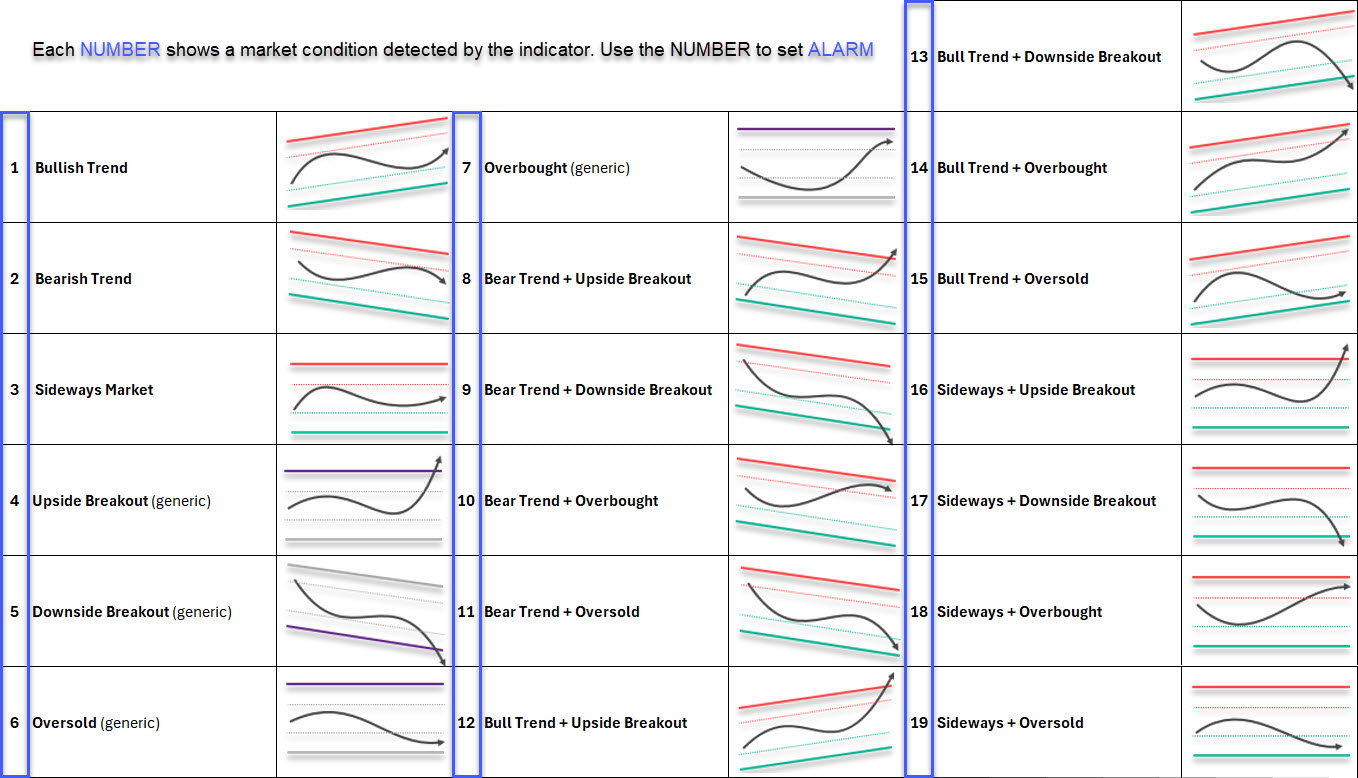
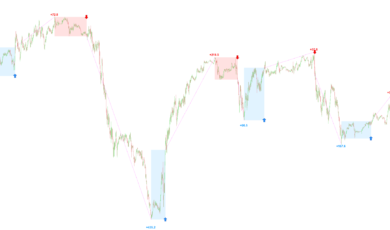
SIGNALS GENERATED BY THE INDICATOR:
The following table shows the numerical values associated with each signal generated by the indicator.
When the condition occurs on the chart, the indicator returns the corresponding value.
📌 These values can be used directly in the ProRealTime alert creation interface: simply select the number corresponding to the desired signal as the condition, and you will receive an automatic notification when the event occurs.
Signal Values Table:
|
1 |
BullTrend |
Market in an upward trend. |
|
2 |
BearTrend |
Market in a downward trend. |
|
3 |
Sideways |
Market in a sideways phase (no significant trend). |
|
4 |
UpSideBreakOut |
Breakout of the upper resistance of the channel. |
|
5 |
DownSideBreakOut |
Breakout of the lower support of the channel. |
|
6 |
OverSold |
Market in an oversold area (lower part of the channel). |
|
7 |
OverBought |
Market in an overbought area (upper part of the channel). |
|
8 |
BearTrend + UpSideBreakOut |
Downward trend with upward breakout. |
|
9 |
BearTrend + DownSideBreakOut |
Downward trend with downward breakout. |
|
10 |
BearTrend + OverBought |
Downward trend with overbought condition. |
|
11 |
BearTrend + OverSold |
Downward trend with oversold condition. |
|
12 |
BullTrend + UpSideBreakOut |
Upward trend with upward breakout. |
|
13 |
BullTrend + DownSideBreakOut |
Upward trend with downward breakout. |
|
14 |
BullTrend + OverBought |
Upward trend with overbought condition. |
|
15 |
BullTrend + OverSold |
Upward trend with oversold condition. |
|
16 |
Sideways + UpSideBreakOut |
Sideways phase with upward breakout. |
|
17 |
Sideways + DownSideBreakOut |
Sideways phase with downward breakout. |
|
18 |
Sideways + OverBought |
Sideways phase with overbought condition. |
|
19 |
Sideways + OverSold |
Sideways phase with oversold condition. |
PRACTICAL EXAMPLES OF USING THE INDICATOR:
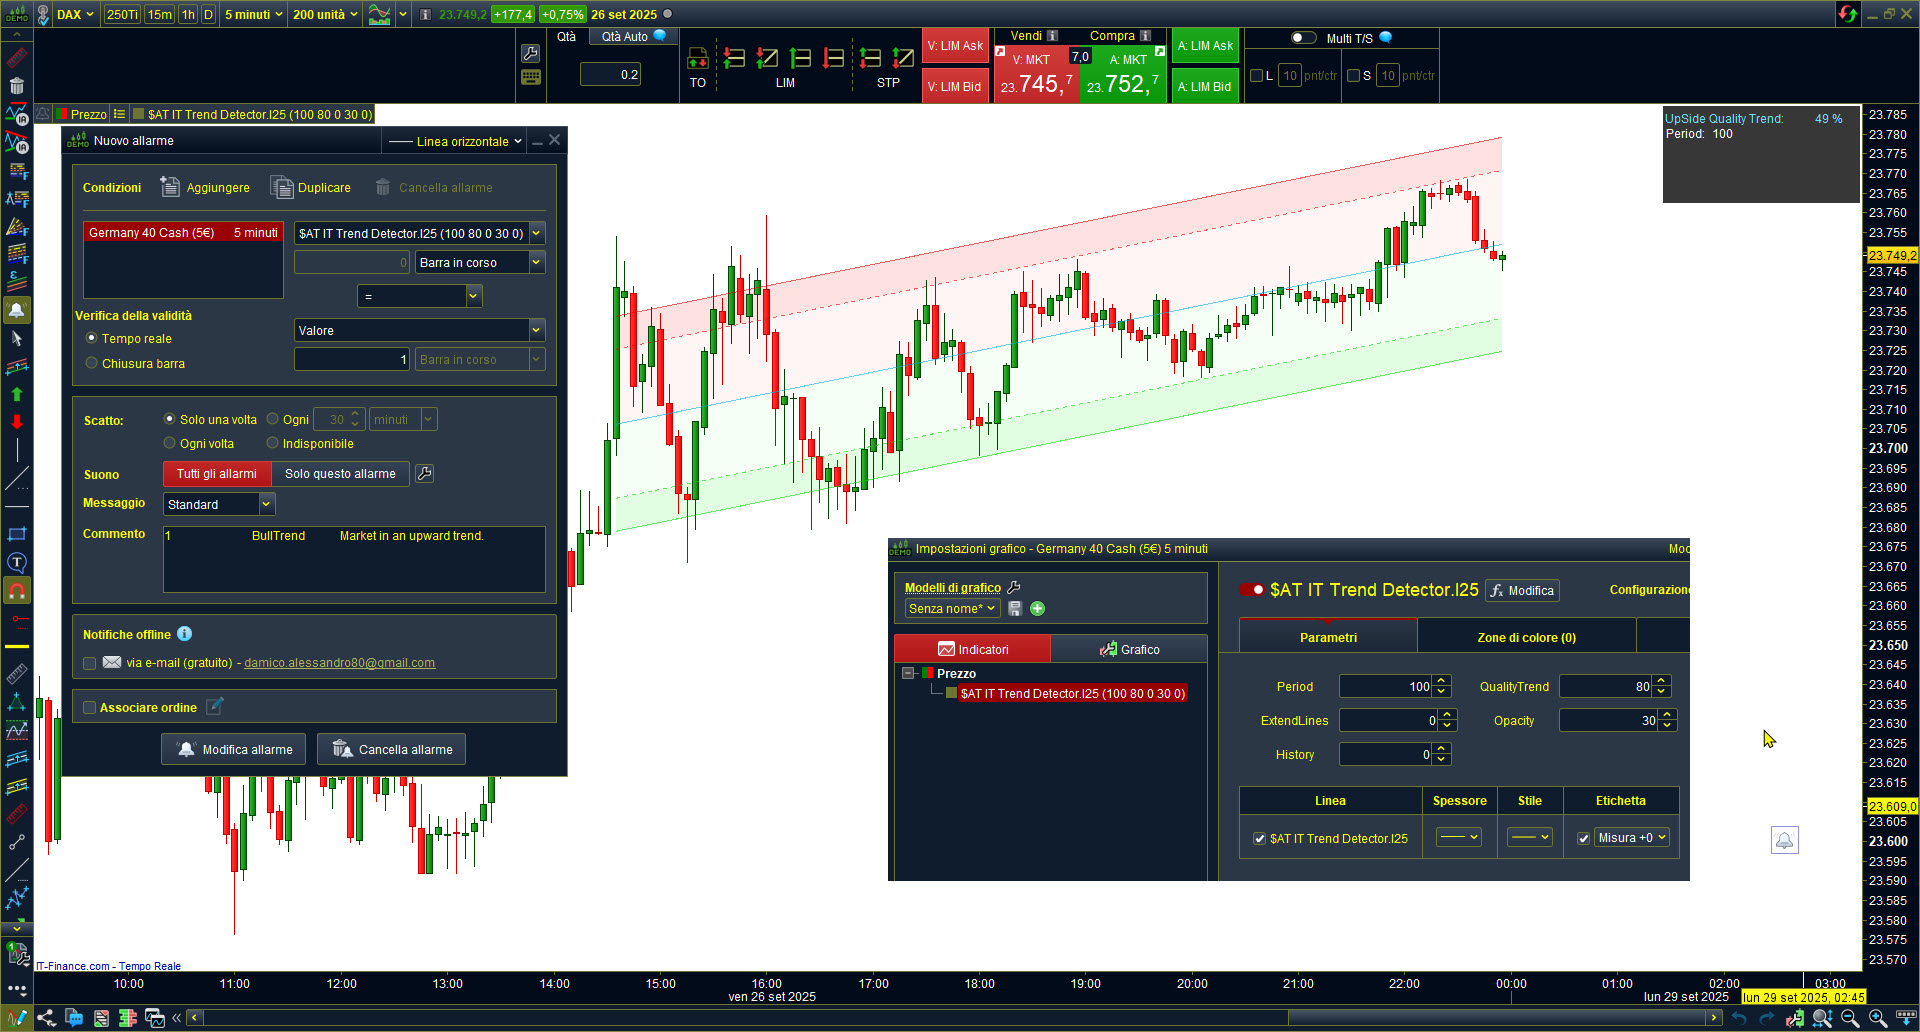
SETTING AN ALERT ON BULLTREND:
To monitor a symbol in an uptrend with a defined minimum quality:
- Open the chart of the desired symbol.
- Apply the indicator to the chart.
- Set the Period parameter (e.g., 100 for a medium‑term trend).
- Define the QualityTrend threshold (e.g., 80%).
- Create an alert by selecting the BullTrend condition, using the numeric value from the signals table — in this case = 1.
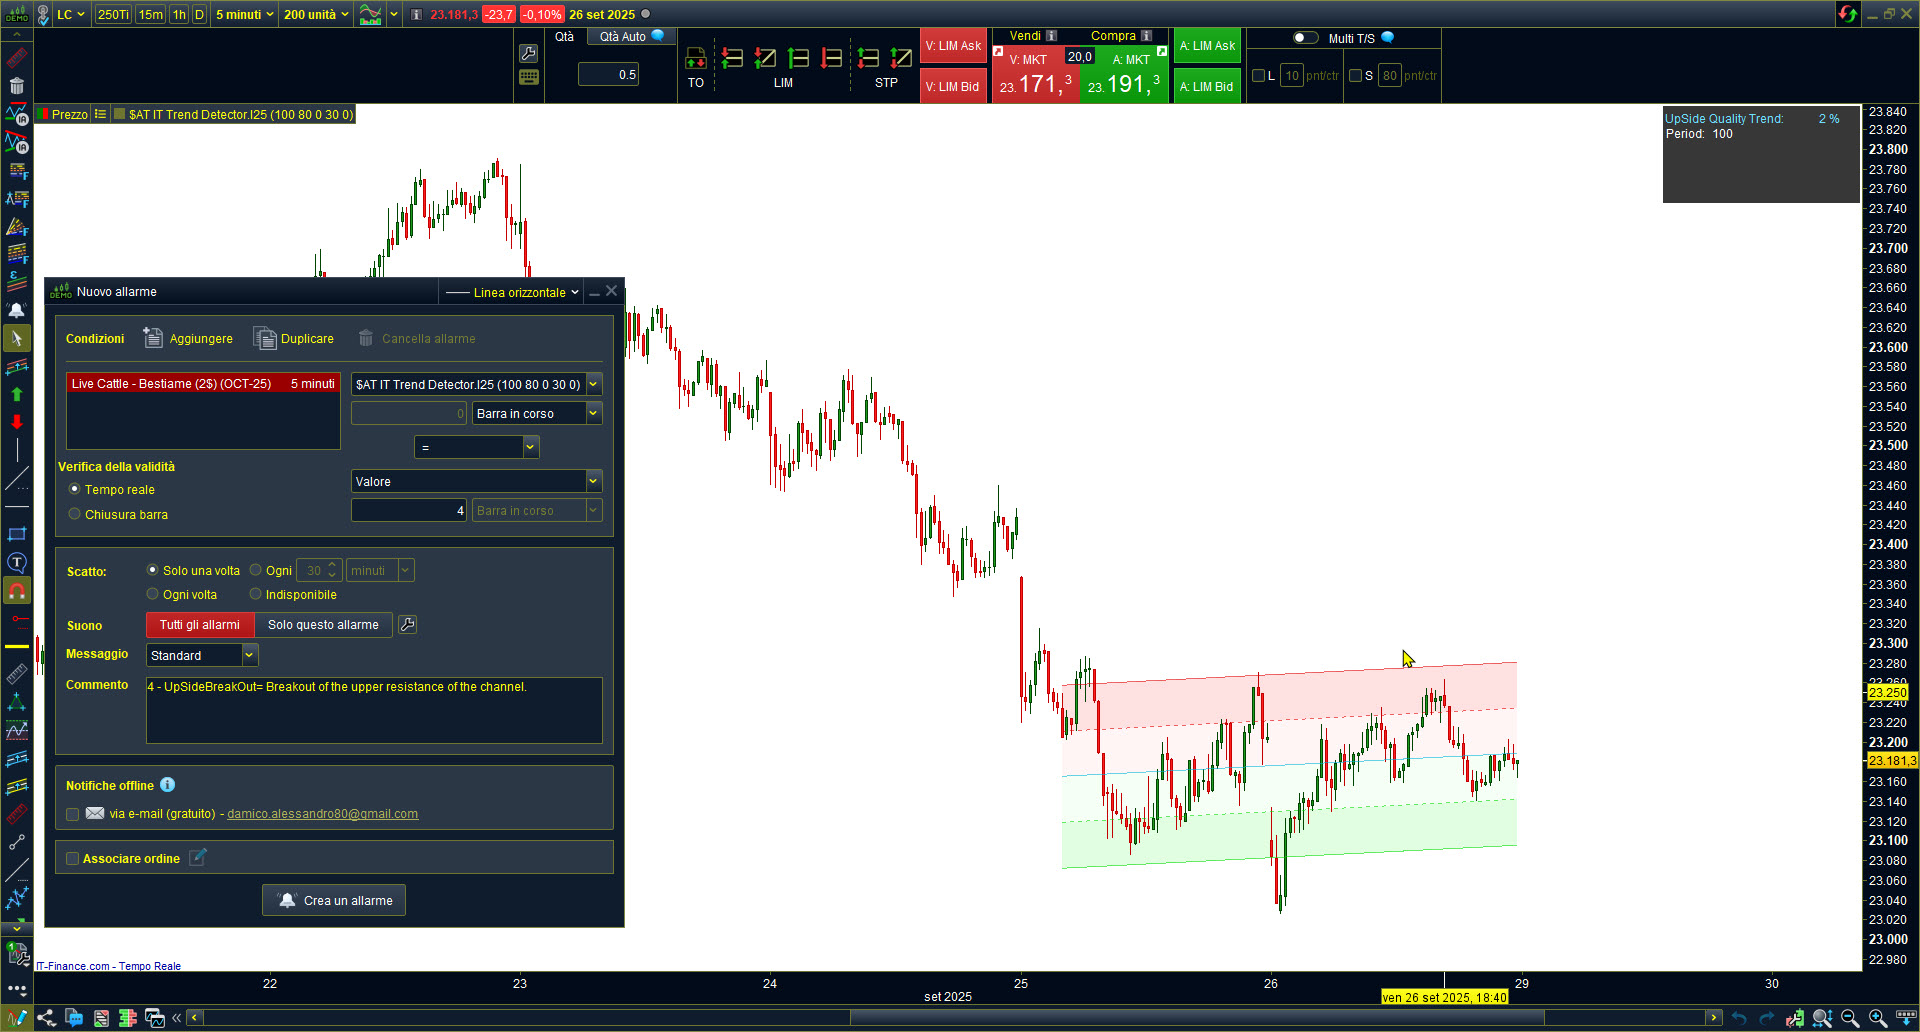
SETTING AN ALERT ON BREAKOUT:
To detect a significant channel break:
- Create an alert on UpSideBreakOut (bullish break).
- 📖 When the upper line is exceeded, the alert will notify the breakout
USING “EXTENDEDLINES”:
To project the channel beyond the last bar:
- Set ExtendedLines = e.g., 30.
- Observe the channel lines extended forward.
HISTORICAL ANALYSIS WITH “HISTORY”:
To study how the indicator would have behaved in the past:
- Set a value in History (e.g., 175).
- The channel and panel will shift back by 175 bars.
—————————————————————————————————————————————————————————————————————————————————————————————————————————————————
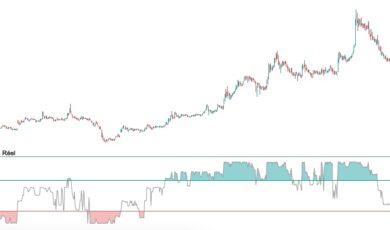
🖥️ Screener Trend Detector – What it’s for
The Screener Trend Detector lets you instantly find the markets with the signal you’re looking for, without scrolling through dozens of charts.
👉 For example:
-
Looking for reversals? Select BullTrend + DownSideBreakOut and the screener will show you only those markets in an uptrend that are breaking down.
-
Want to follow strong trends? Set BullTrend or BearTrend with a high quality threshold, and the screener will return only the cleanest markets.
-
Interested in price extremes? Activate OverBought or OverSold and get a list of instruments in extreme conditions.
📌 In short: the screener is your intelligent filter. It tells you where to look and which instruments deserve your attention, so you can focus only on real opportunities and save valuable time.
📷 Example
In the image you find the screener’s interface setting and results.
For more information visit the screener’s page: ProScreener

-
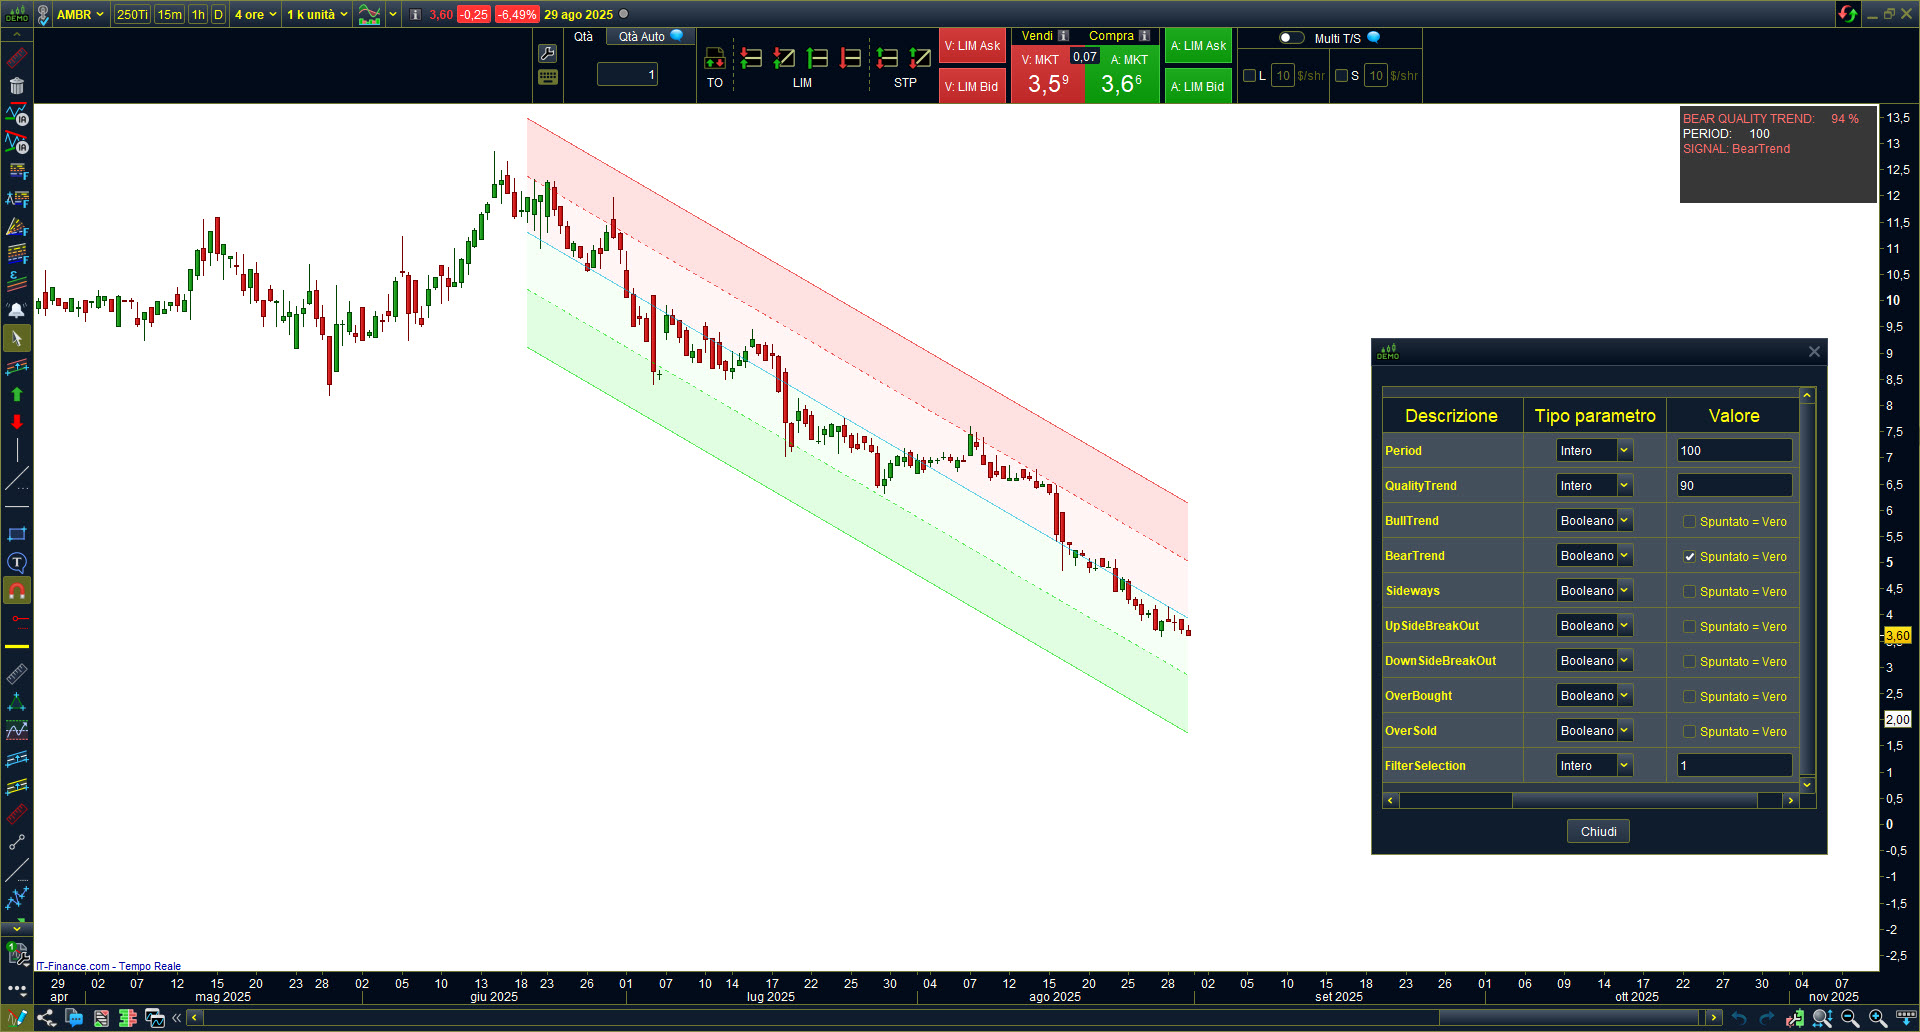
- BearTrend The indicator identifies a strong downward trend, with regression channel sloping negatively and signal confirmed as BearTrend.
❓ FAQ – TREND DETECTOR (INDICATOR + SCREENER)
On which markets and timeframes does it work?
Trend Detector works on any market and on any timeframe available in ProRealTime.
Does the indicator generate signals only for alerts?
No. Signals can be used for alerts, but also for ProBackTest and ProScreener, making the tool fully integrated with the platform.
What if the chart gets compressed when I apply the indicator?
If the chart looks compressed, go into the chart settings and check “Use Price Only”. Alternatively, in the indicator interface you can deselect the Output option to avoid scaling issues.
How many markets can I scan with the screener?
You can scan all markets available in ProRealTime (stocks, indices, ETFs, forex, futures, etc.) without restrictions.
Does it work with all timeframes in the screener too?
Yes. The screener is compatible with all ProRealTime timeframes, from intraday to multi-day. The indicator works in any pricechart and timeframe.
Do I need to buy both tools separately?
No. By purchasing the Indicator, you also receive the Screener license for free, included in your lifetime license and VICEVERSA.
How does QualityTrend work?
QualityTrend acts as a threshold: BullTrend and BearTrend signals (and their combinations) are generated only if the trend quality is above the value you set.
Are updates included?
Yes. All updates are included for life with your license, at no extra cost.
WHY USE THIS INDICATOR?
1️⃣ Quickly spot key reversals and breakouts: no need to scan all charts, the tool highlights the most important turning points.
2️⃣ Turn signals into actionable trades: with alerts, every setup becomes a clear and immediate opportunity.
3️⃣ Pinpoint the best markets with precision: the screener lets you cross-check trends and setups across multiple timeframes, focusing only where trading potential is strongest.
🎁 Bonus: When you purchase the Trend Detector indicator, you will also receive the Trend Detector Screener for free, included in your license.
*** LIFETIME LICENSE INCLUDES: ALL UPDATES ***
Recensioni
Ancora non ci sono recensioni.