

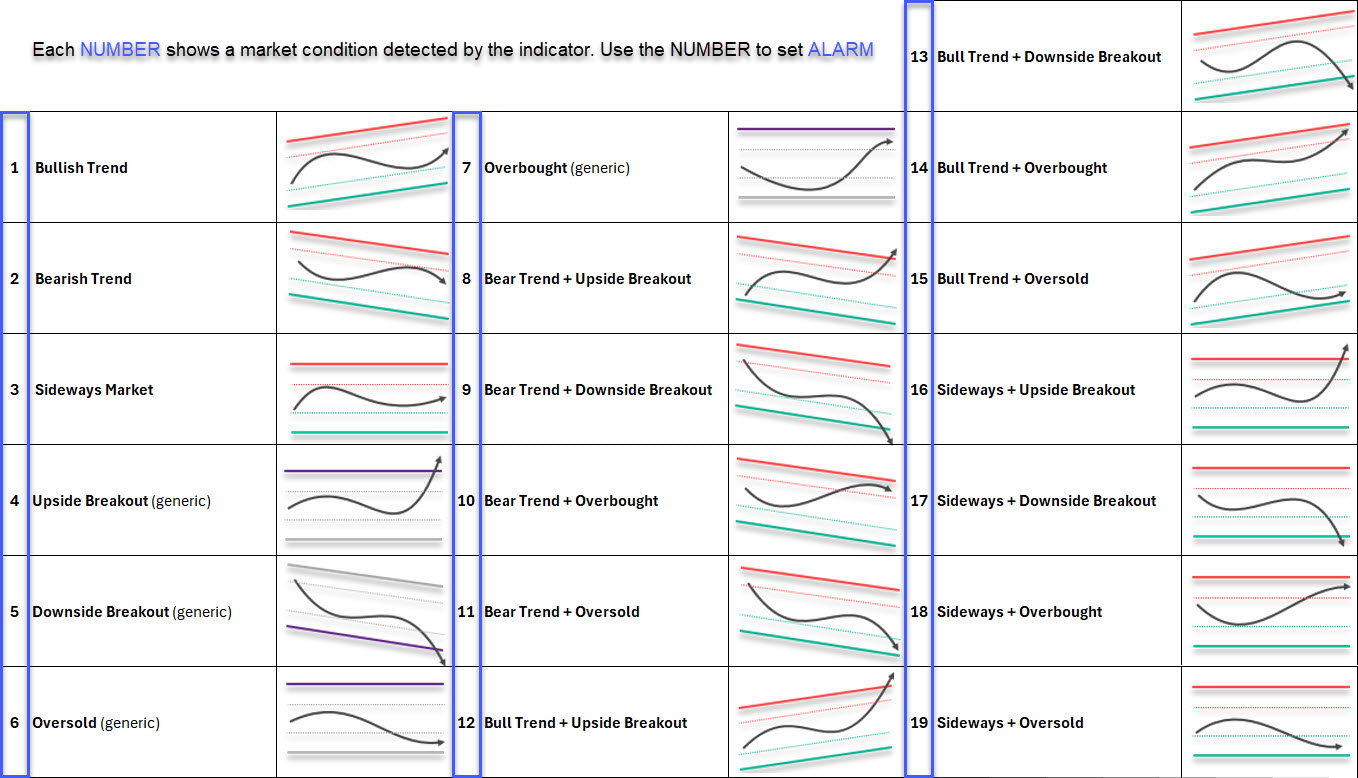

The Trend Detector Screener is the perfect companion to the Trend Detector indicator.
Instead of checking charts one by one, the screener continuously analyzes your selected instruments and highlights where the conditions of interest are met.
You can filter for:
- BullTrend or BearTrend phases to follow strong movements.
- Breakouts (UpSide or DownSide) to catch possible reversals or continuation setups.
- OverBought and OverSold zones to identify exhaustion points.
- Sideways phases when the market consolidates.
📌 For example, if you are looking for trend reversals, you can combine conditions such as BullTrend + DownSideBreakOut or BearTrend + UpSideBreakOut, the screener will instantly list all instruments matching your criteria, allowing you to act quickly and never miss an opportunity.
In combination with the indicator, the screener gives you a complete workflow:
- Scan the markets for signals.
- Analyze the chart with the Trend Detector channels.
- Set alerts to get notified when the conditions reappear.
With this tool, you stop wasting time scrolling charts and start focusing on trading the right setups at the right time.
🔎 HOW THE SCREENER WORKS
In this screen you can:
- Select the markets, lists, or sectors to be scanned.
- Choose the timeframe on which the screener will operate.
- Set Variables
- Launch the scan by clicking “Run ProScreener”.
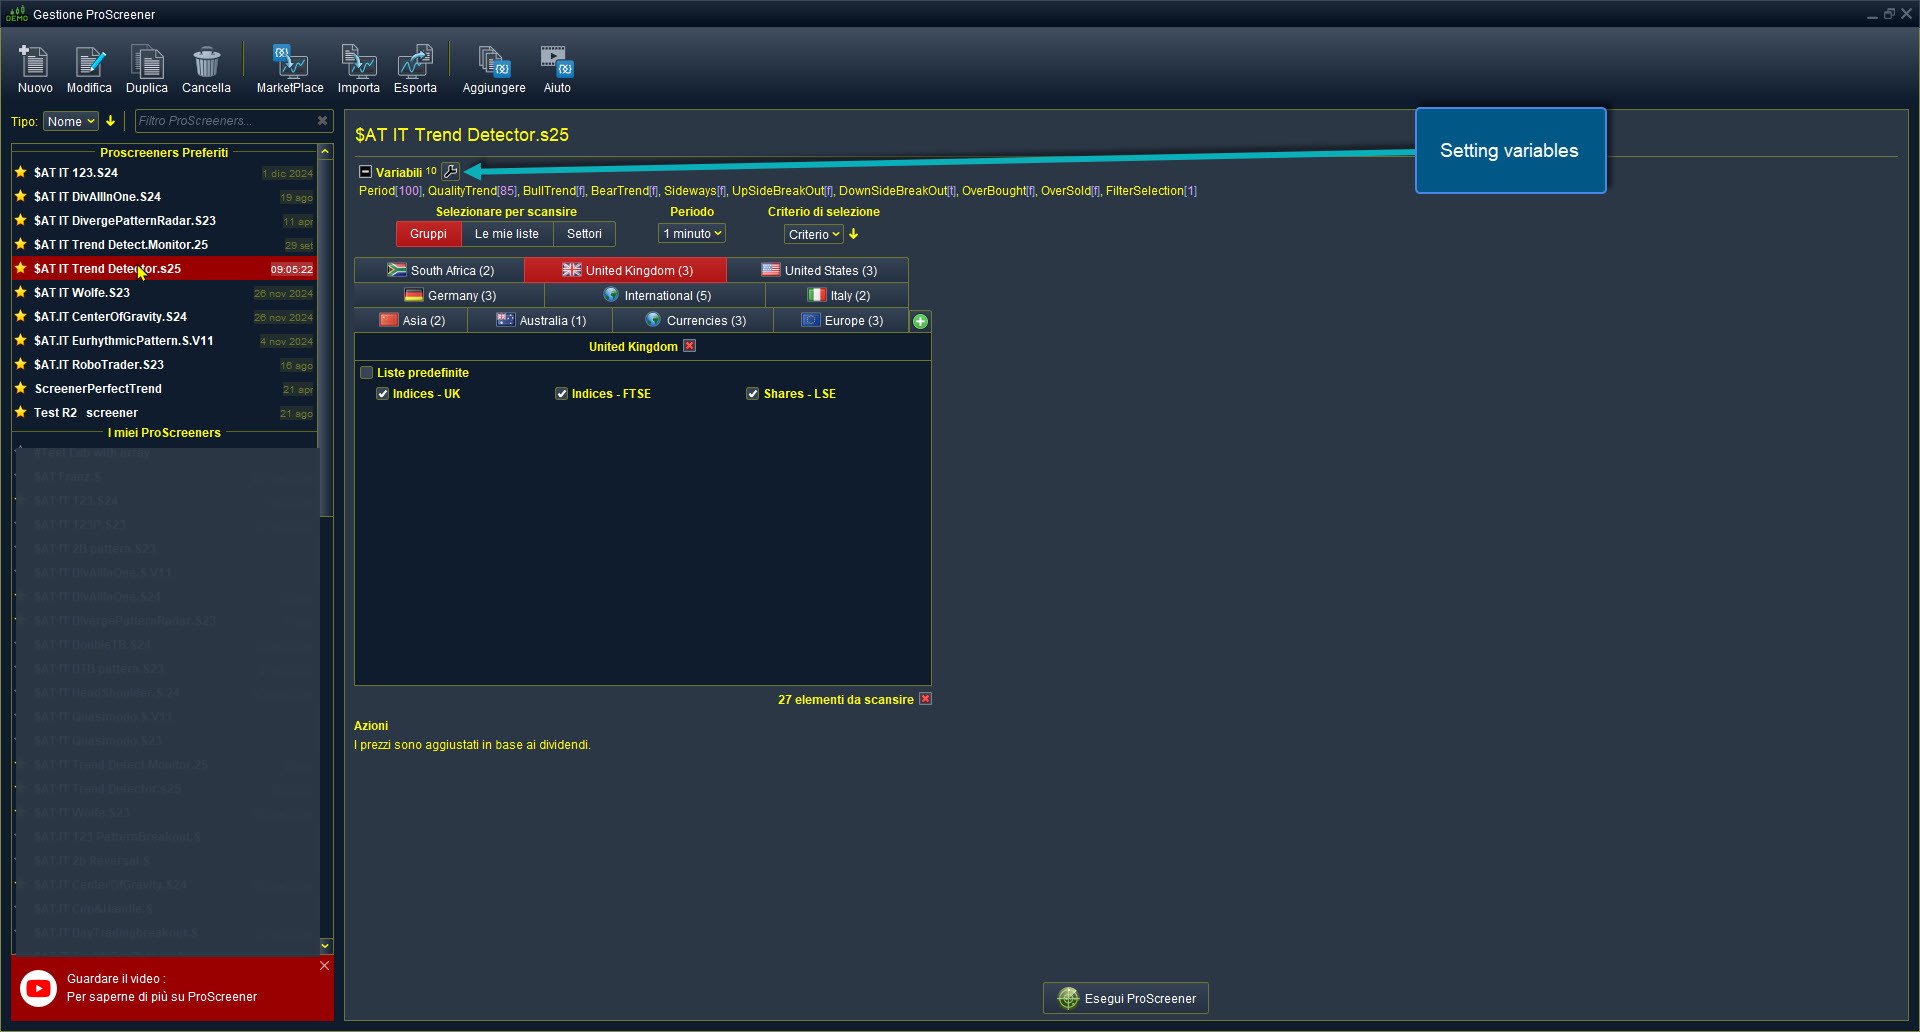
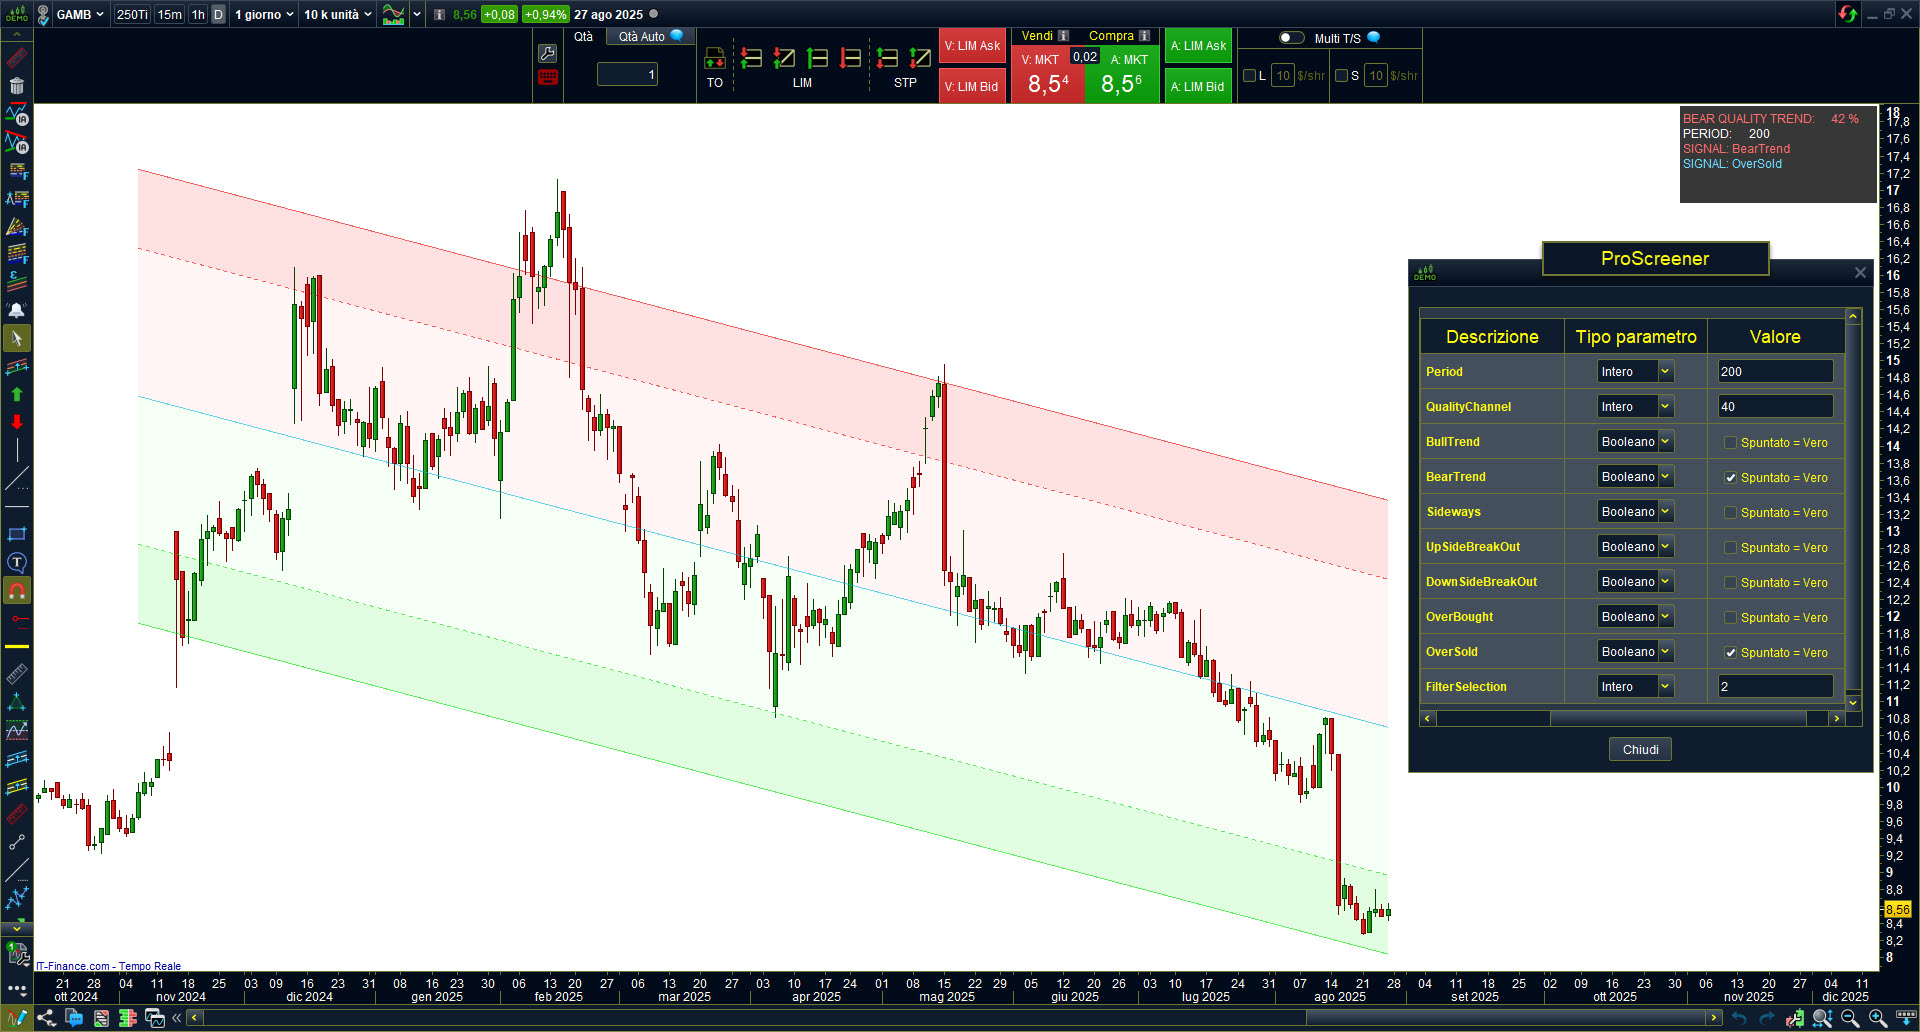
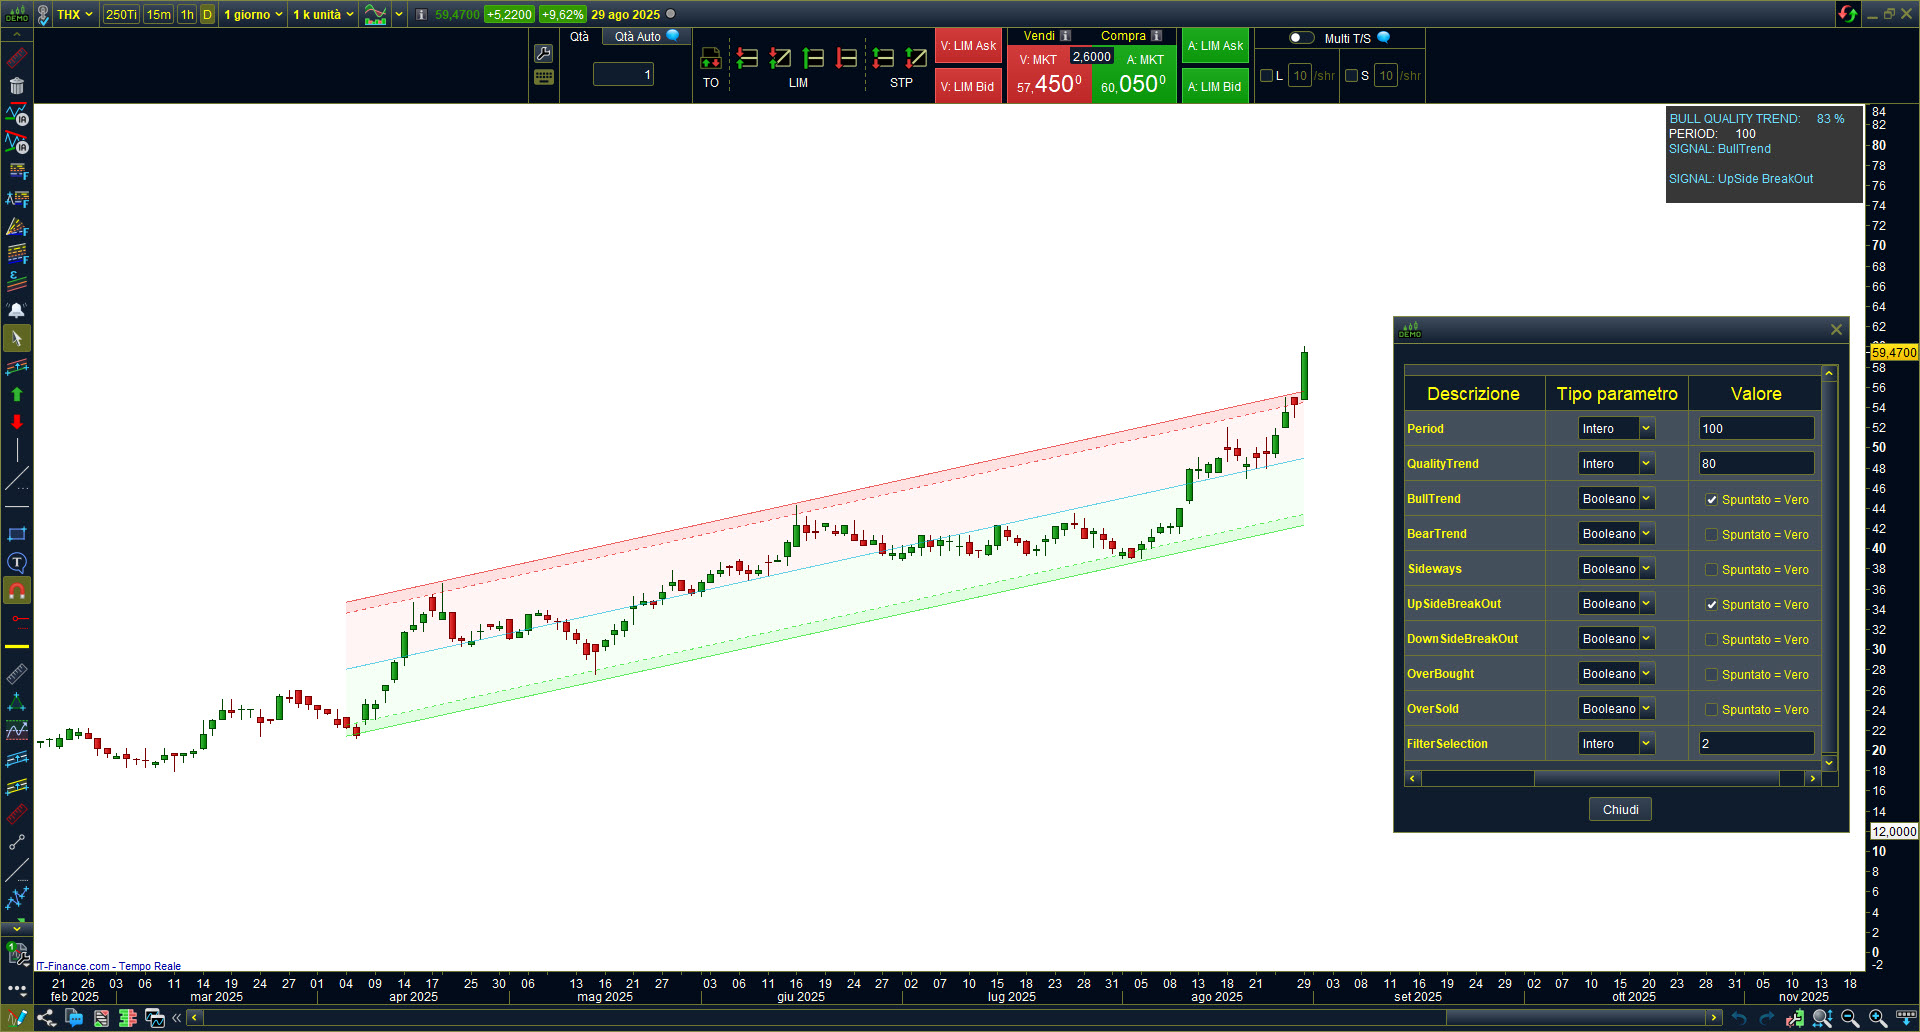
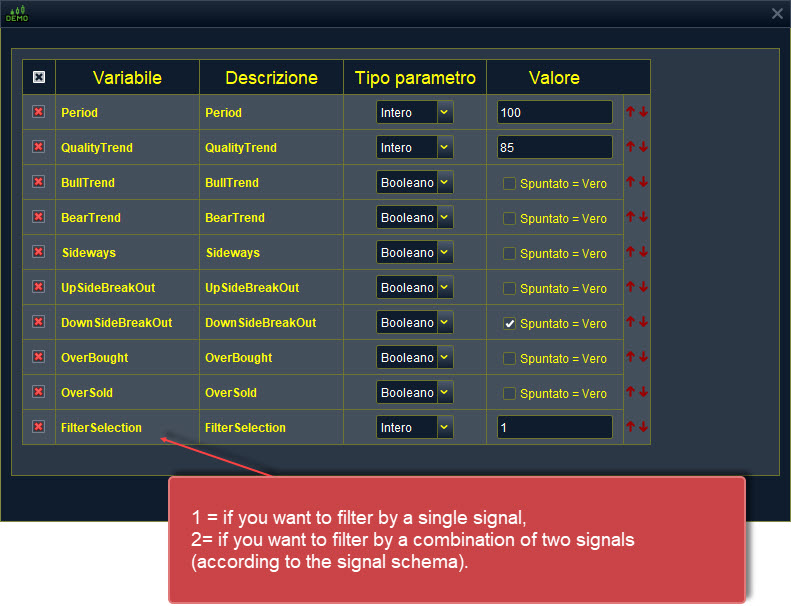
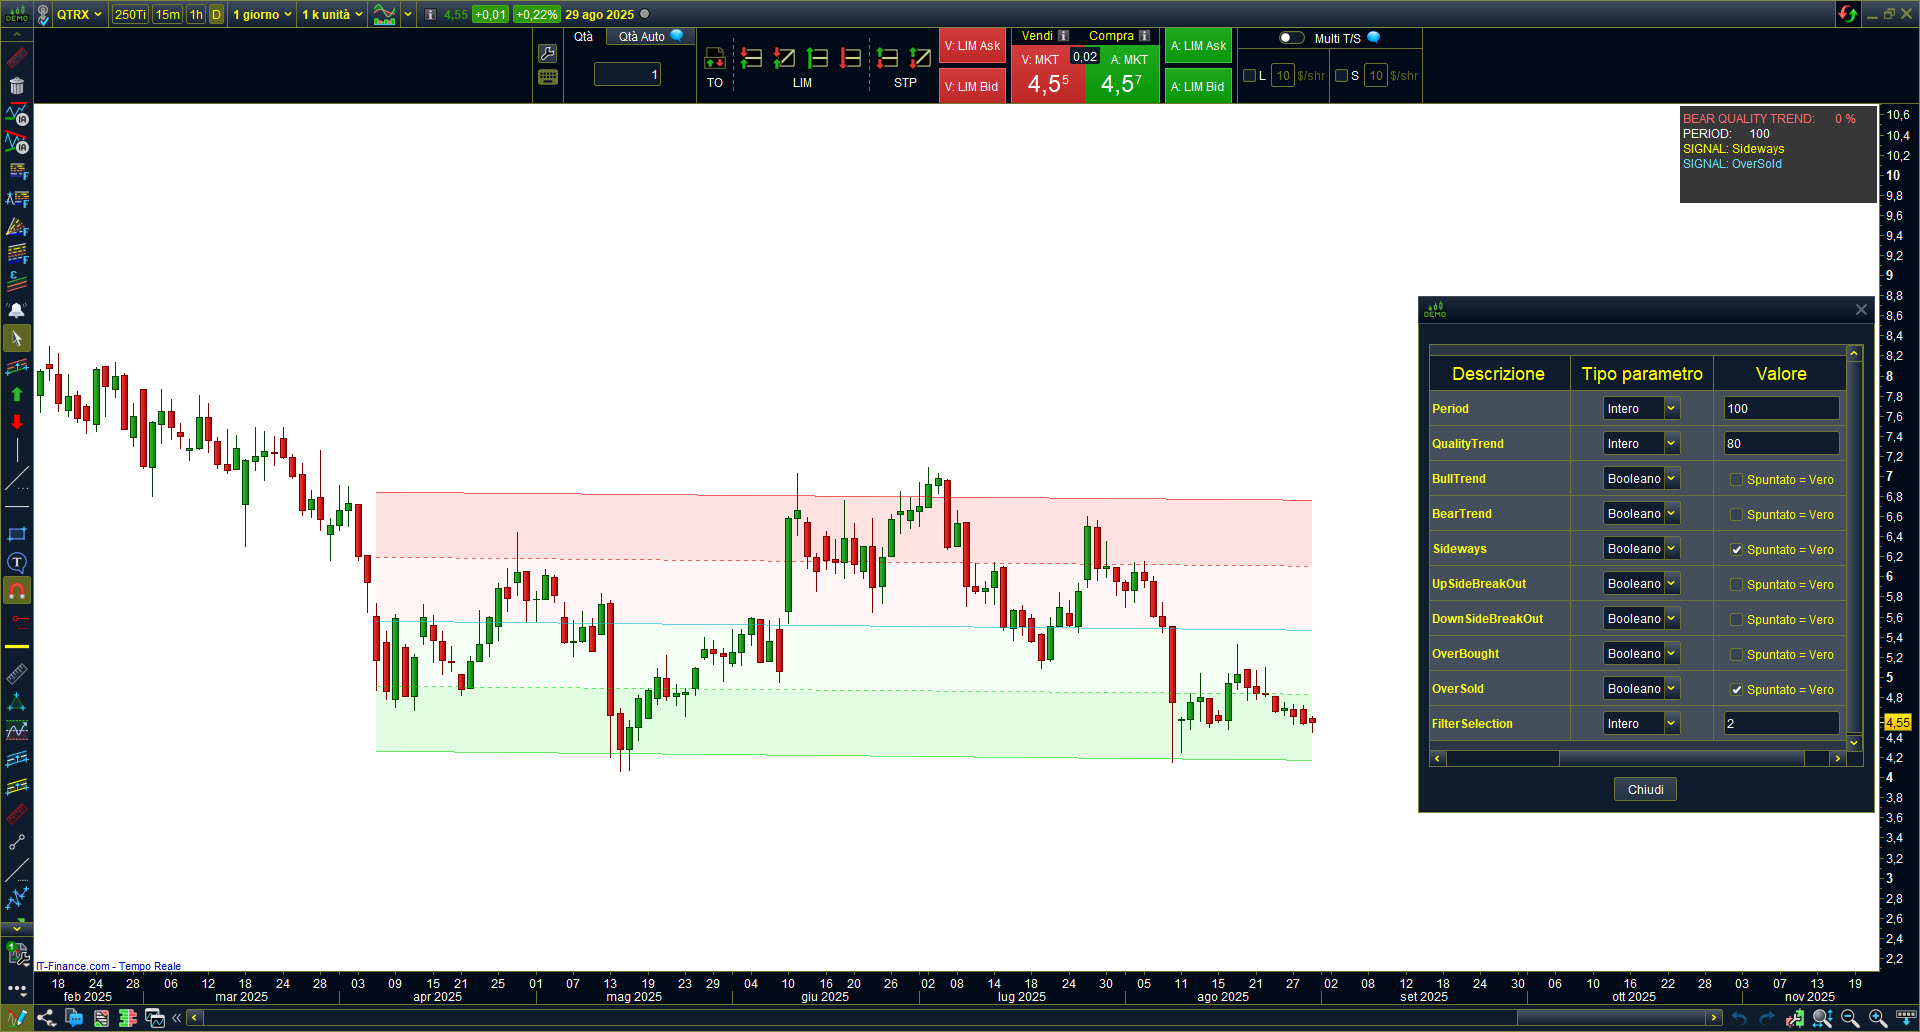
SCREENER VARIABLES
By clicking on the wrench icon, you open the variable panel.
Here you can:
Activate the Boolean variables (BullTrend, BearTrend, Sideways, BreakOut, OverBought, OverSold). These define the conditions the screener will search for.
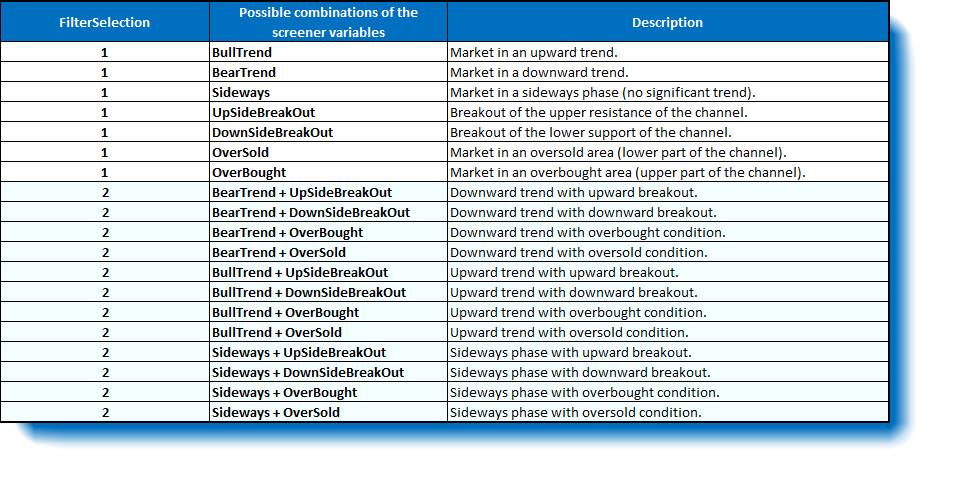
Set FilterSelection:
- if you want to filter by a single signal,
- if you want to filter by a combination of two signals (according to the signal schema).
📌 Example
If you activate BullTrend only and set FilterSelection = 1, the screener will return all assets currently in an upward trend.
If you activate BullTrend + DownSideBreakOut and set FilterSelection = 2, the screener will show only assets in an upward trend that are simultaneously breaking downward – a typical reversal setup.
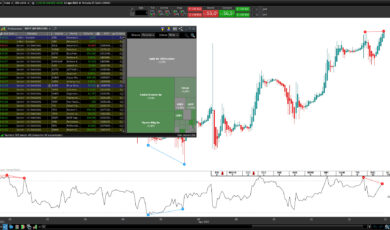
Here is an example of the screener’s output list.
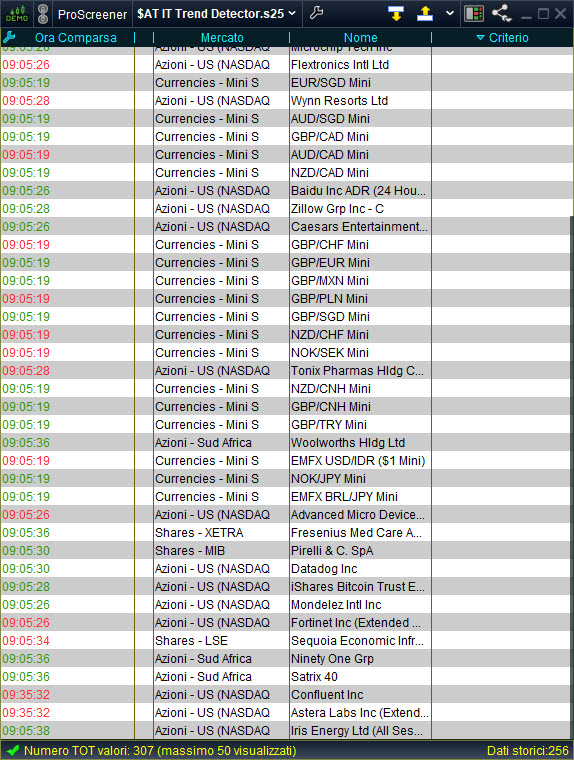
📌 IMPORTANT NOTE FOR USERS:
At the bottom right of the window you can see the note “Historical data: 256”.
This means the screener has performed calculations on the last 256 historical bars.
The PERIOD variable in the screener cannot exceed the number of available historical bars (in this case, 256).
If you set a value higher than the maximum allowed, the screener will return no results.
ProRealTime offers two levels of screeners:
– – Standard Screener: calculations on 256 bars
– – Premium Screener: calculations on up to 1000 bars
👉 Always check the “Historical data” value before setting the PERIOD variable, to ensure valid results.
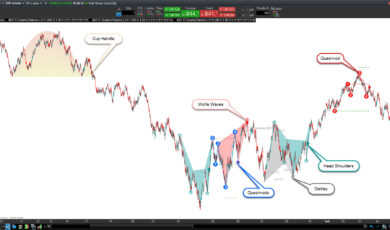
📊 GALLERY – TECHNICAL EXAMPLES
-
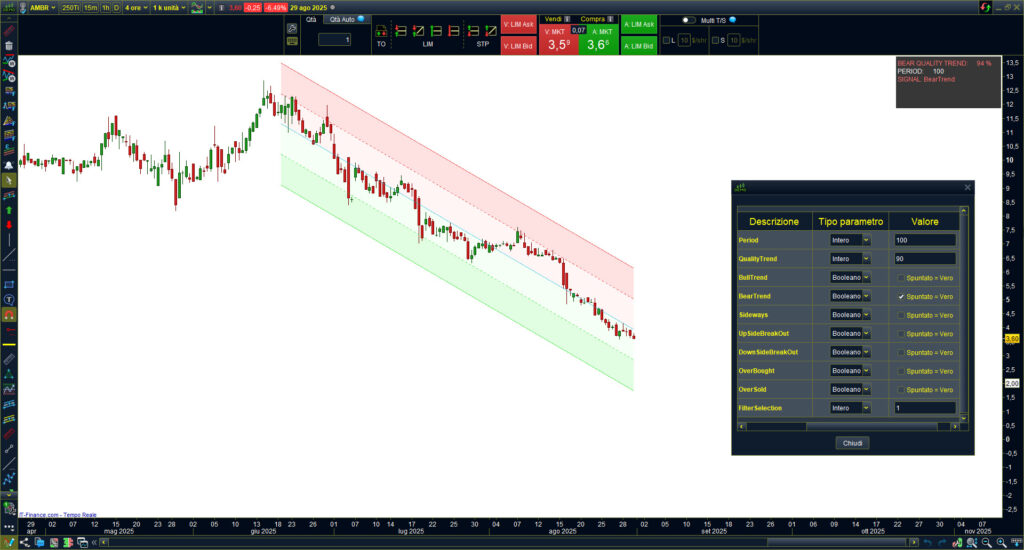
- BearTrend The indicator identifies a strong downward trend, with regression channel sloping negatively and signal confirmed as BearTrend.

-
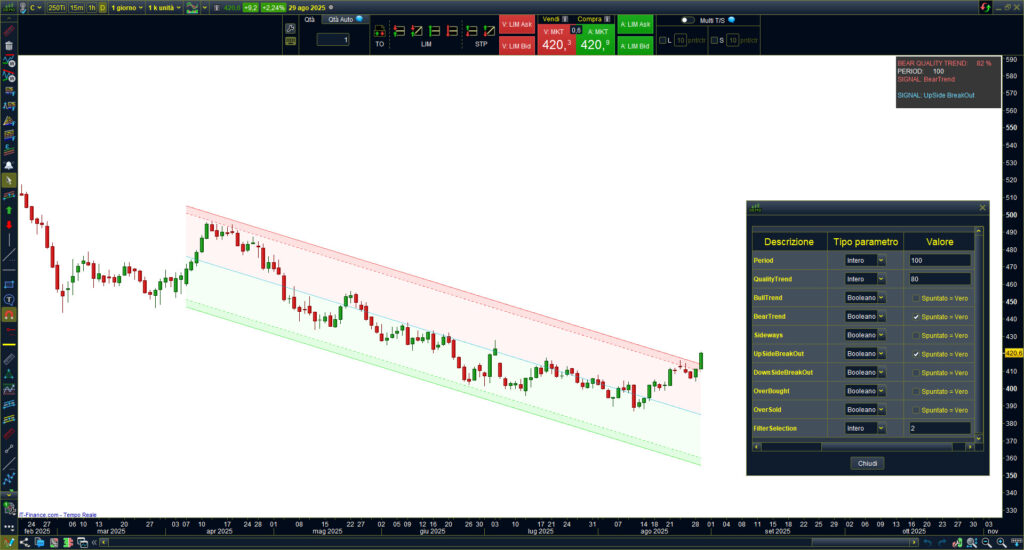
- BearTrend + UpSideBreakOut Downward trend in progress, with price breaking the upper resistance of the channel. Signal combination: BearTrend + UpSideBreakOut.

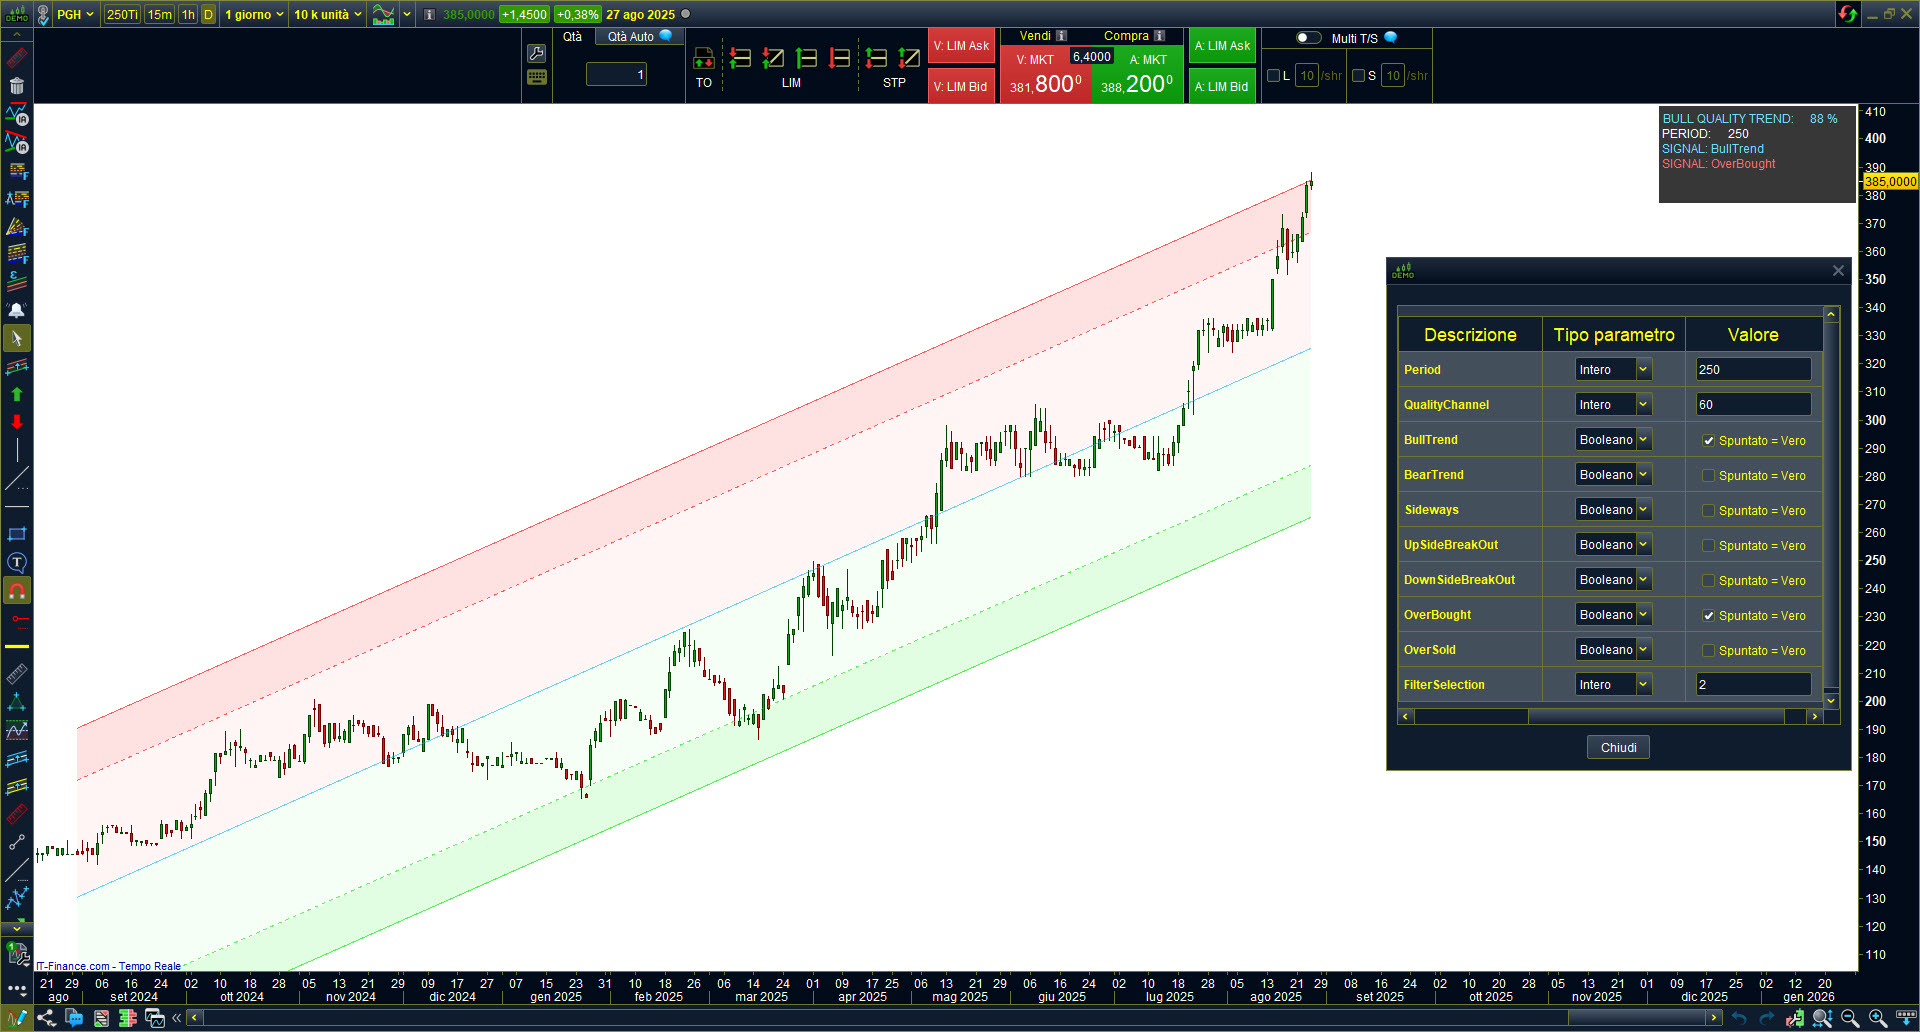
-

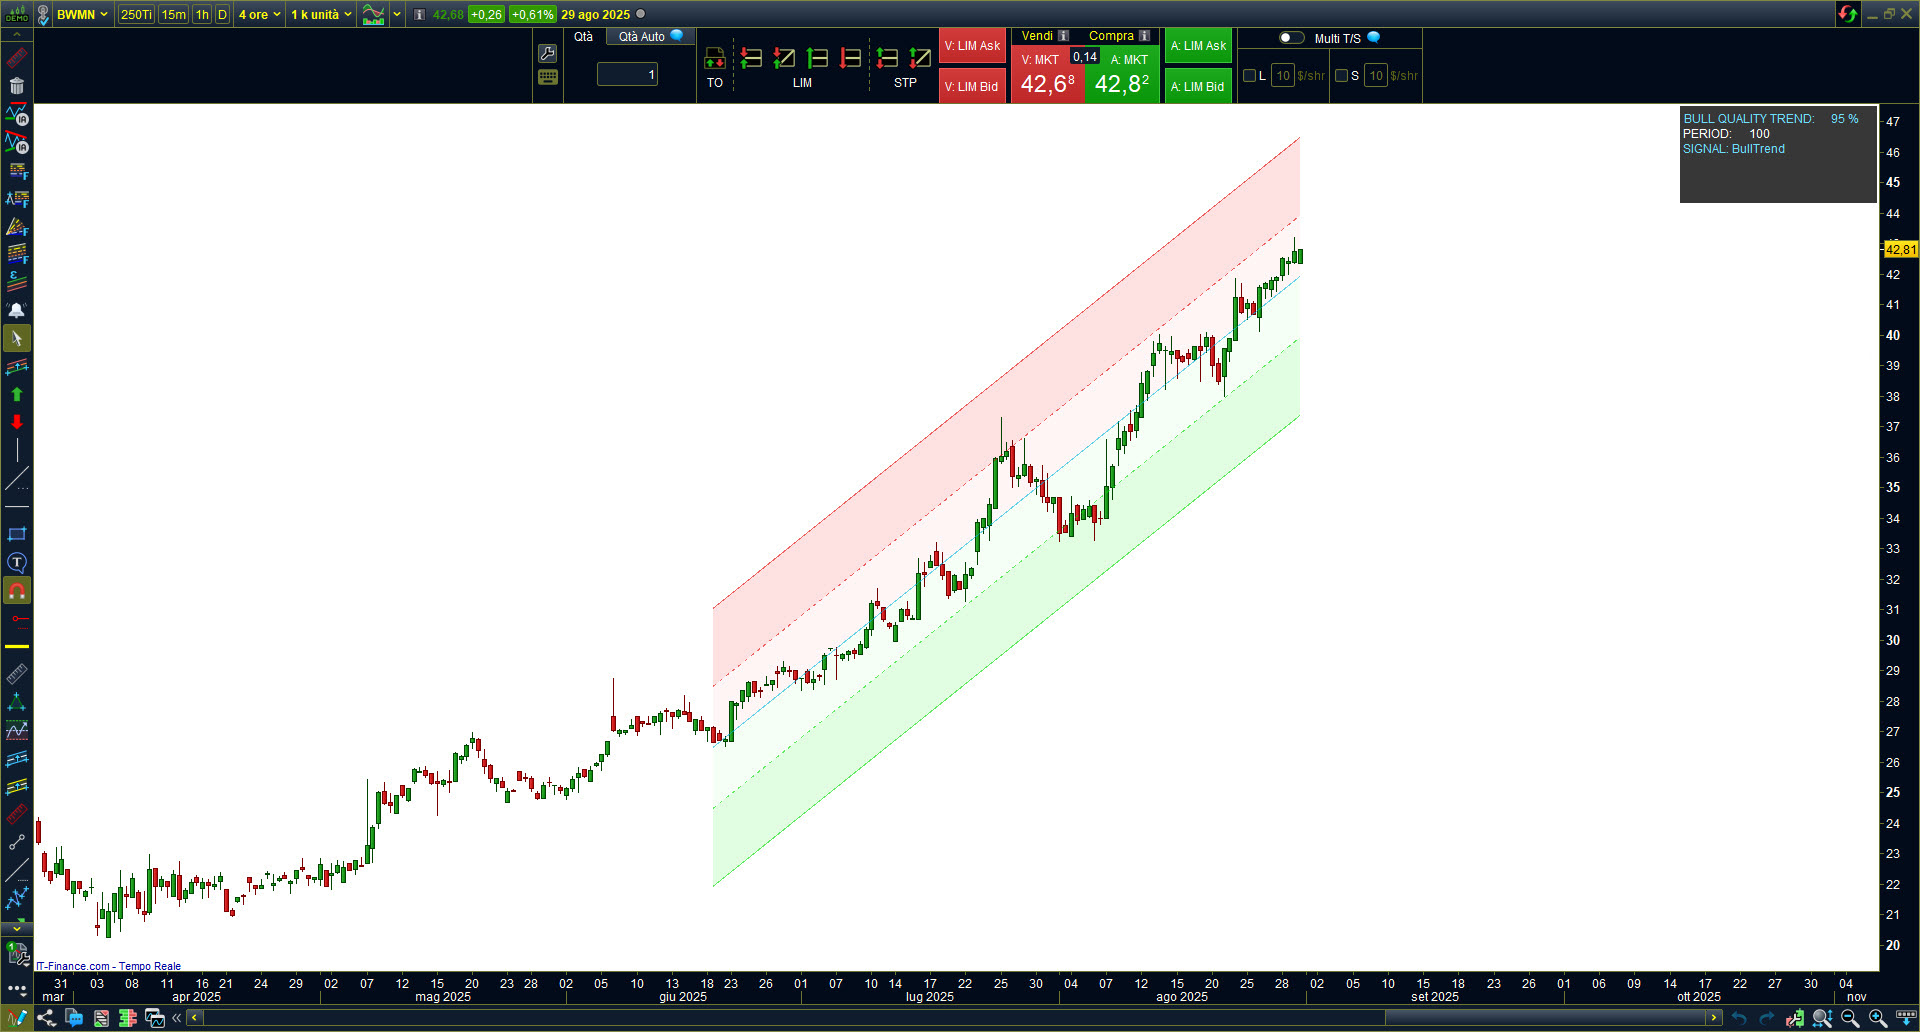
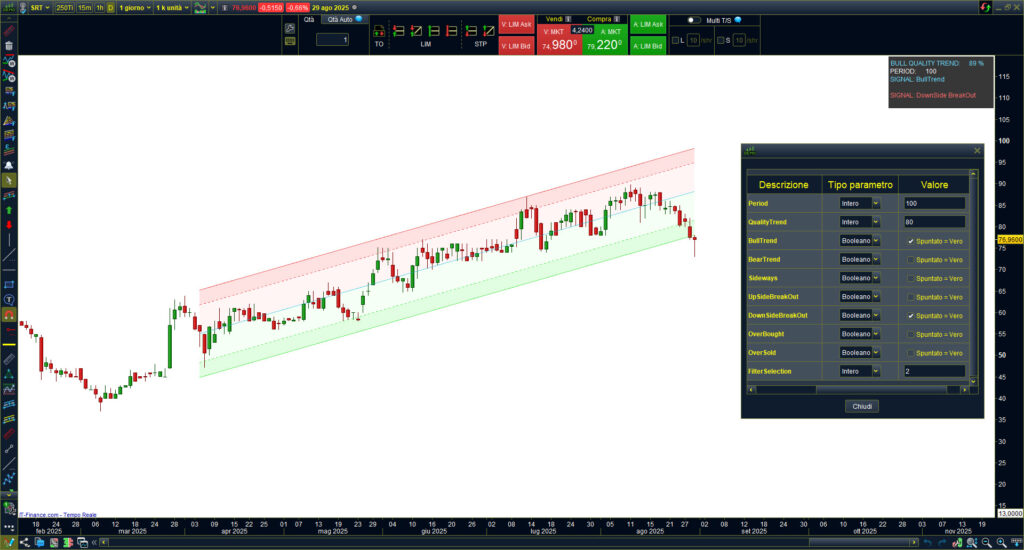
- BullTrend + OverBought Upward trend with price positioned in the overbought zone (upper area of the channel). Signal combination: BullTrend + OverBought.
-
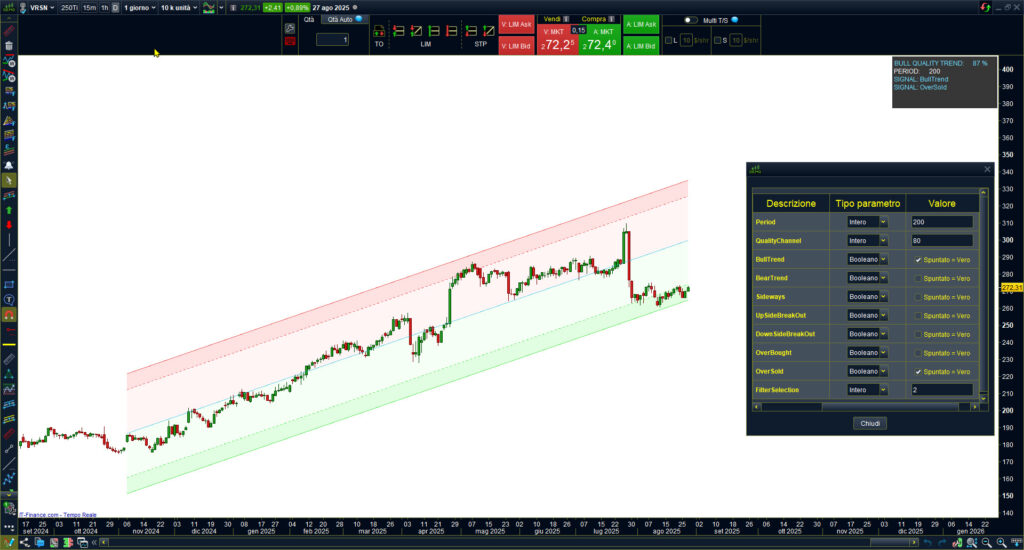
- BullTrend + OverSold Upward trend condition, with the price temporarily reaching the oversold zone (lower channel area). Signal combination: BullTrend + OverSold.

-
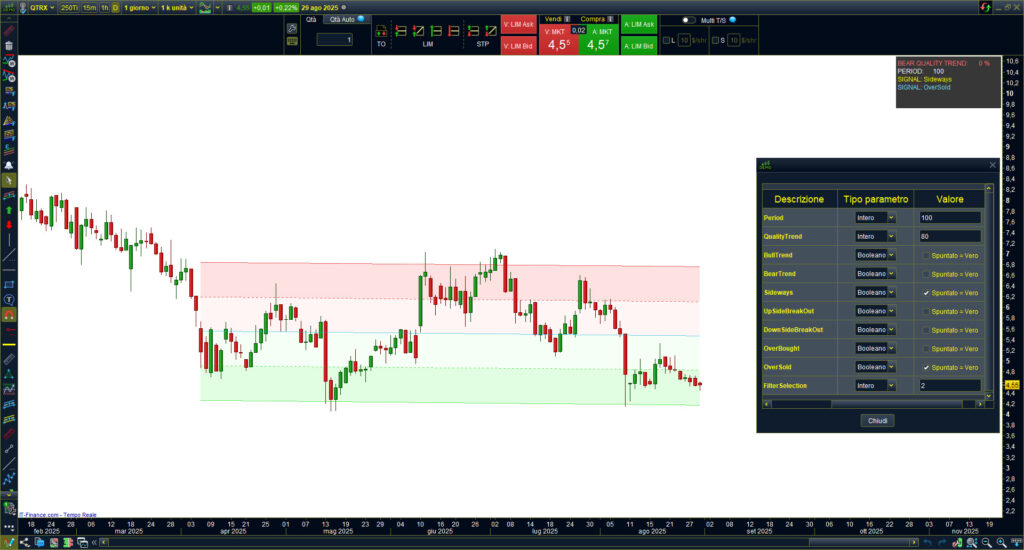
- Sideways + OverSold Market in sideways condition with low trend quality, price positioned in the oversold area. Signal combination: Sideways + OverSold.
-
- BullTrend + DownSideBreakOut Upward trend interrupted by a downward breakout of the lower channel support. Signal combination: BullTrend + DownSideBreakOut.

❓ FAQ – FREQUENTLY ASKED QUESTIONS
- How many markets can I scan?
- You can scan all markets available in ProRealTime (stocks, indices, ETFs, forex, futures, etc.) with no restrictions on the number of instruments.
- Does it work with all timeframes?
- Yes. The screener is fully compatible with all ProRealTime timeframes, so you can adapt it to your strategy (intraday, daily, or multi-day).
- Do I need the indicator to use the screener?
- No, when you purchase the screener you will also receive the Trend Detector indicator for free, already included in your license.
- Are updates included?
- Yes. All future updates are included at no extra cost. The license is lifetime: once purchased, the tool is yours forever.
WHY USE THIS SCREENER?
1️⃣ Scan hundreds of instruments in seconds: no more manual chart-by-chart analysis, the screener automatically filters and highlights only the markets that meet your selected conditions.
2️⃣ Find the exact setups you are looking for: from simple signals (BullTrend, BearTrend, BreakOut, OverBought, OverSold) to combined conditions (e.g., BullTrend + DownSideBreakOut).
3️⃣ Save time and never miss opportunities: cross-check multiple markets and timeframes at once, focusing only on assets that match your trading strategy.
🎁 Bonus: When you purchase the Trend Detector Screener, you will also receive the Trend Detector Indicator for free, included in your license.
*** LIFETIME LICENSE INCLUDES: ALL UPDATES ***
Avis
Il n’y a pas encore d’avis.