
Disclaimer
This indicator does not provide buy or sell signals.
It plots market structure levels intended to support discretionary decision-making and risk management.
What this indicator does
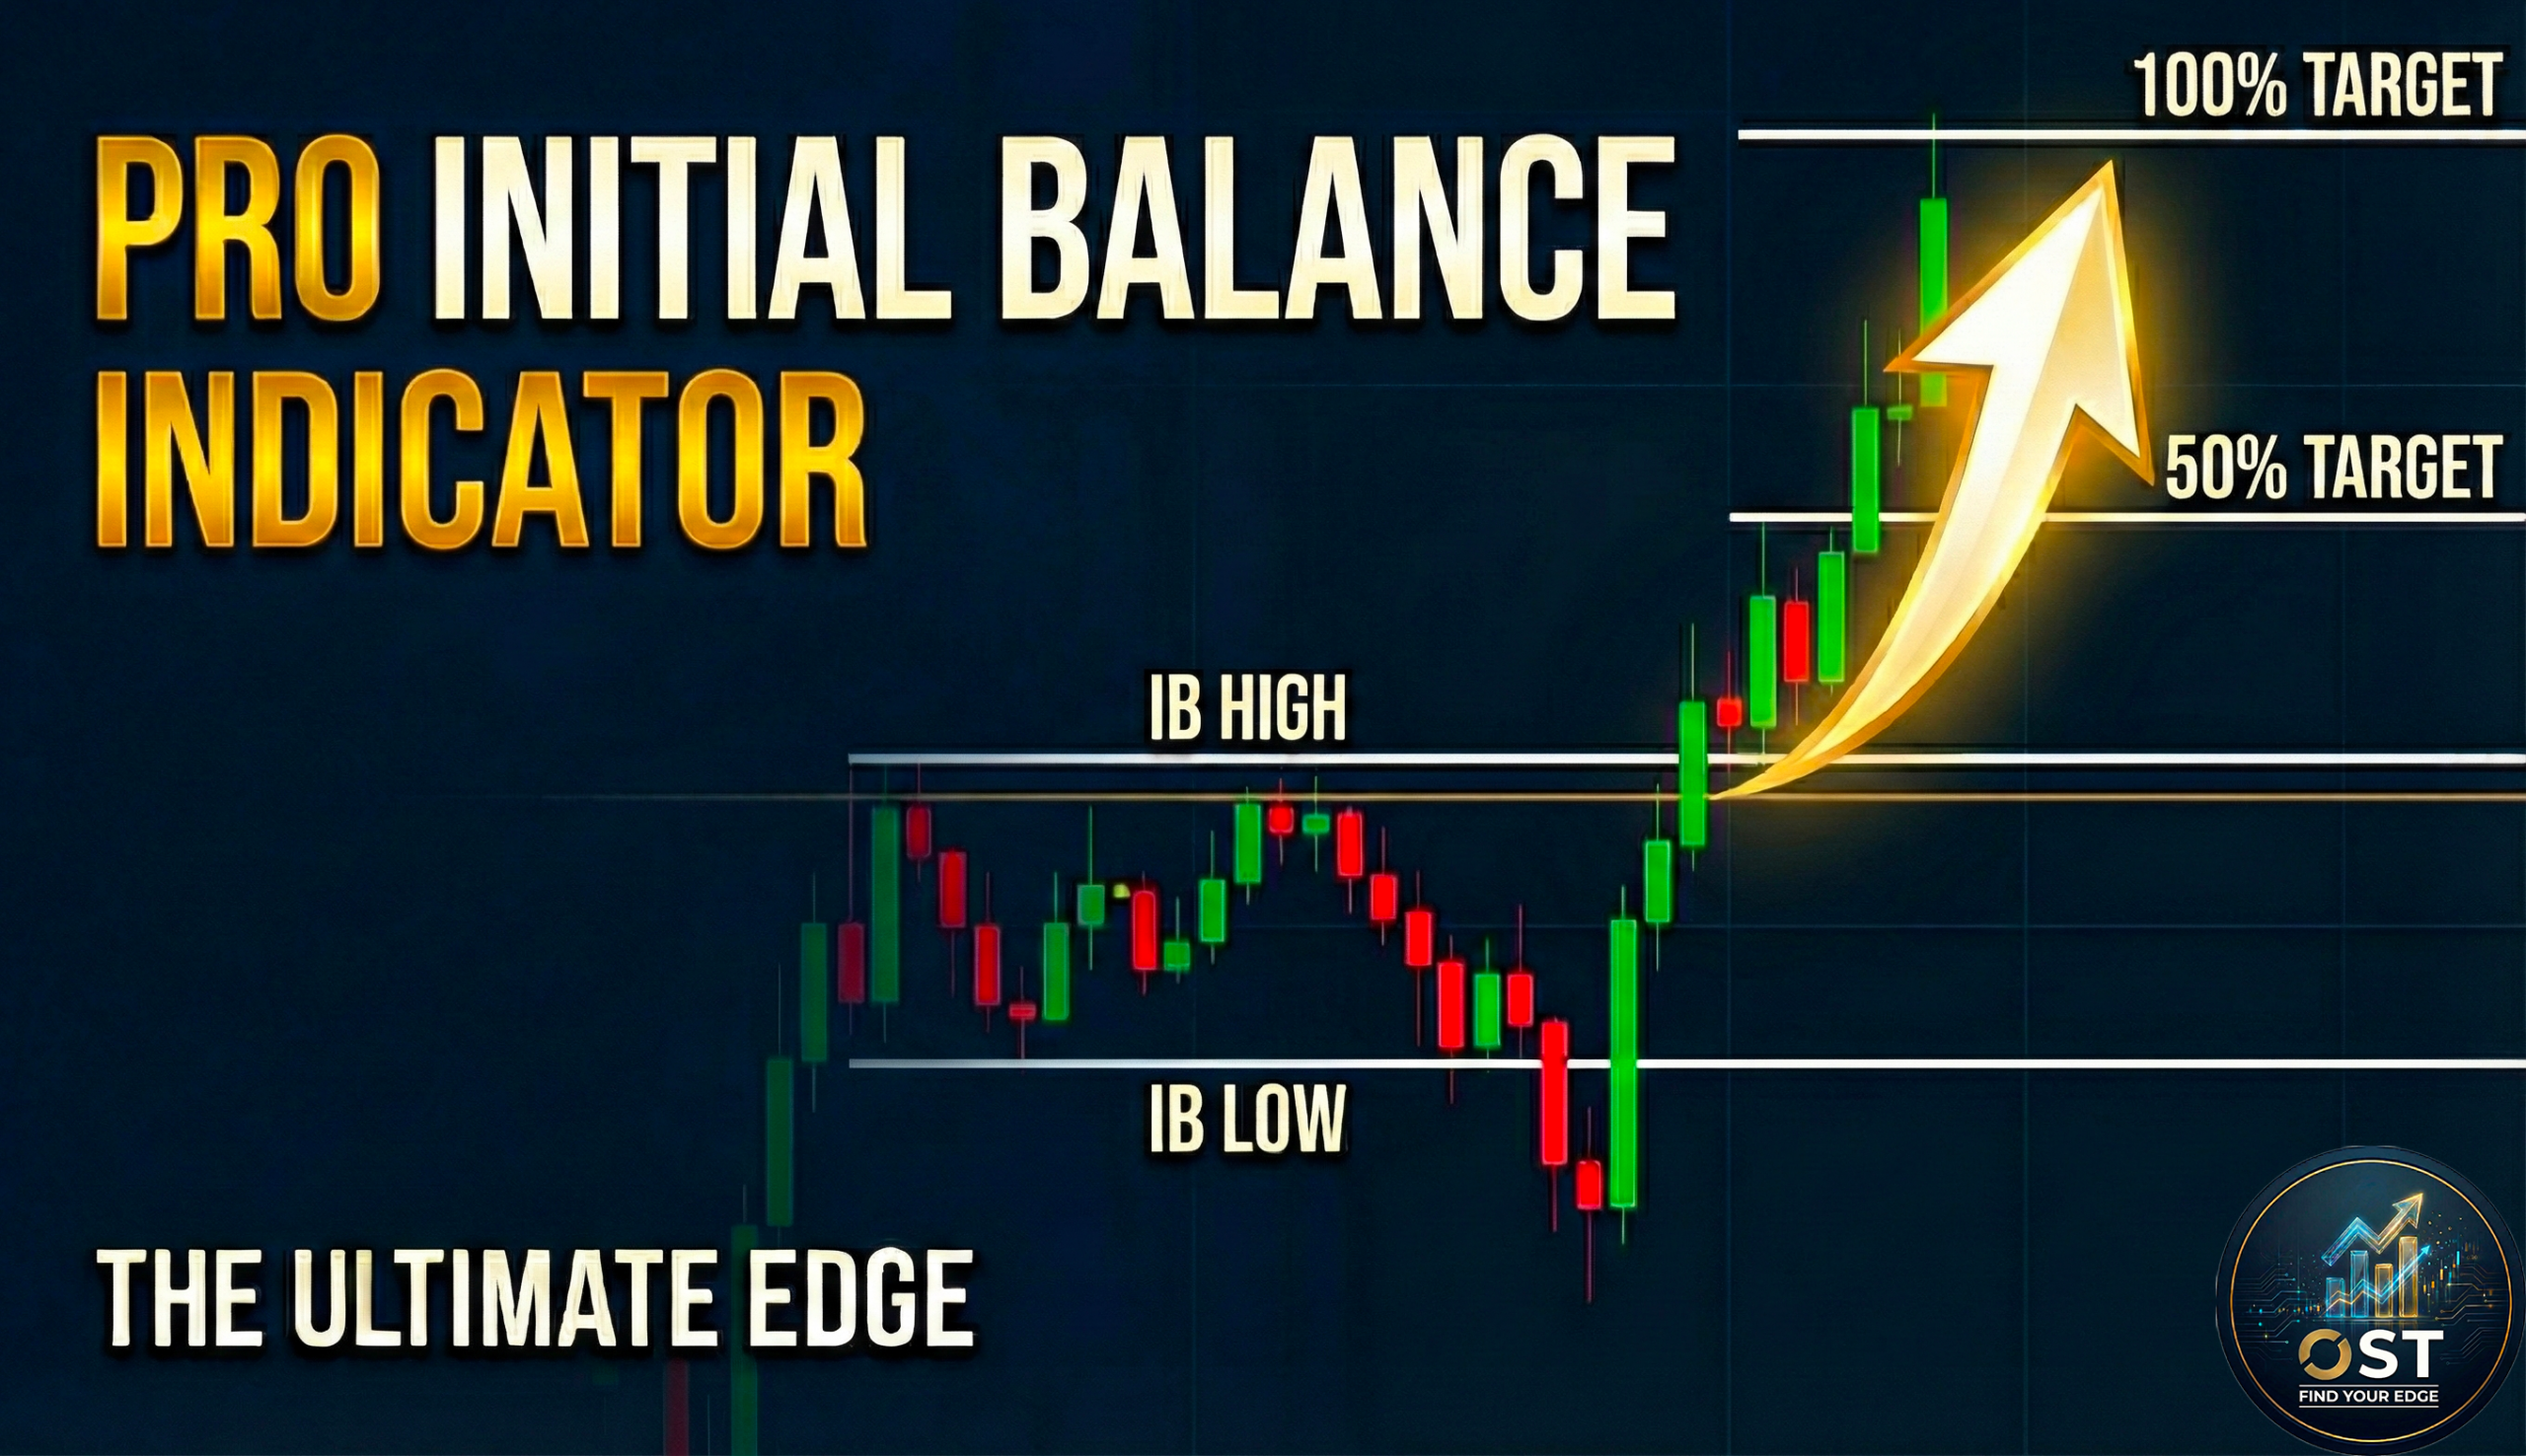
The Pro Initial Balance automatically plots the Initial Balance (IB) of the trading session, helping traders visualize the most important reference levels of the day.
The Initial Balance represents the price range formed during the first 60 or 30 minutes of a session, a period where institutional participation and directional intent are often revealed.
This indicator provides a clear and consistent framework to assess whether the market is likely to:
- Breakout and extend
- Remain balanced
- Revert back to value
Settings
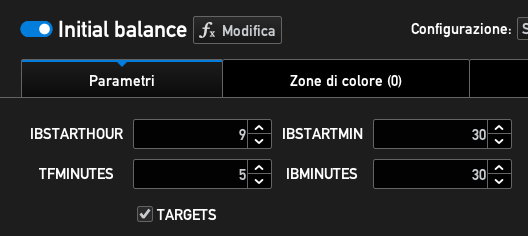
The indicator includes Initial Balance timing parameters via IBSTARTHOUR and IBSTARTMIN.
- I.e. US Stocks → IBSTARTHOUR = 9, IBSTARTMIN = 30
Based on the selected IB session, the indicator plots:
- IB High
- IB Low
- IB Mid
- Optional Target levels
The indicator is designed to be used on intraday charts below 30 minutes (1, 2, 3, 5 or 10 minute timeframes ideally).
- TFMINUTES reflects the timeframe you are plotting the indicator on, thus an integer between 1,2,3,5 or 10.
- IBMINUTES represents the duration of the initial balance, typically it should be set to 30 or 60 depending on you trading style and asset to trade.
- An optional TARGETS setting allows traders to display projected extension levels based on the Initial Balance range:
- 50% extension
- 100% extension
- Both bullish and bearish projections
These targets provide objective reference points for:
- Breakout continuation
- Partial exits
- Intraday trade management
How traders use it
- Identify key intraday support and resistance
- Structure breakout and range expansion trades
- Frame mean reversion scenarios around IB Mid
- Improve execution consistency during the most active part of the session
The indicator does not generate signals, but defines structure, leaving full control to the trader.
General rules
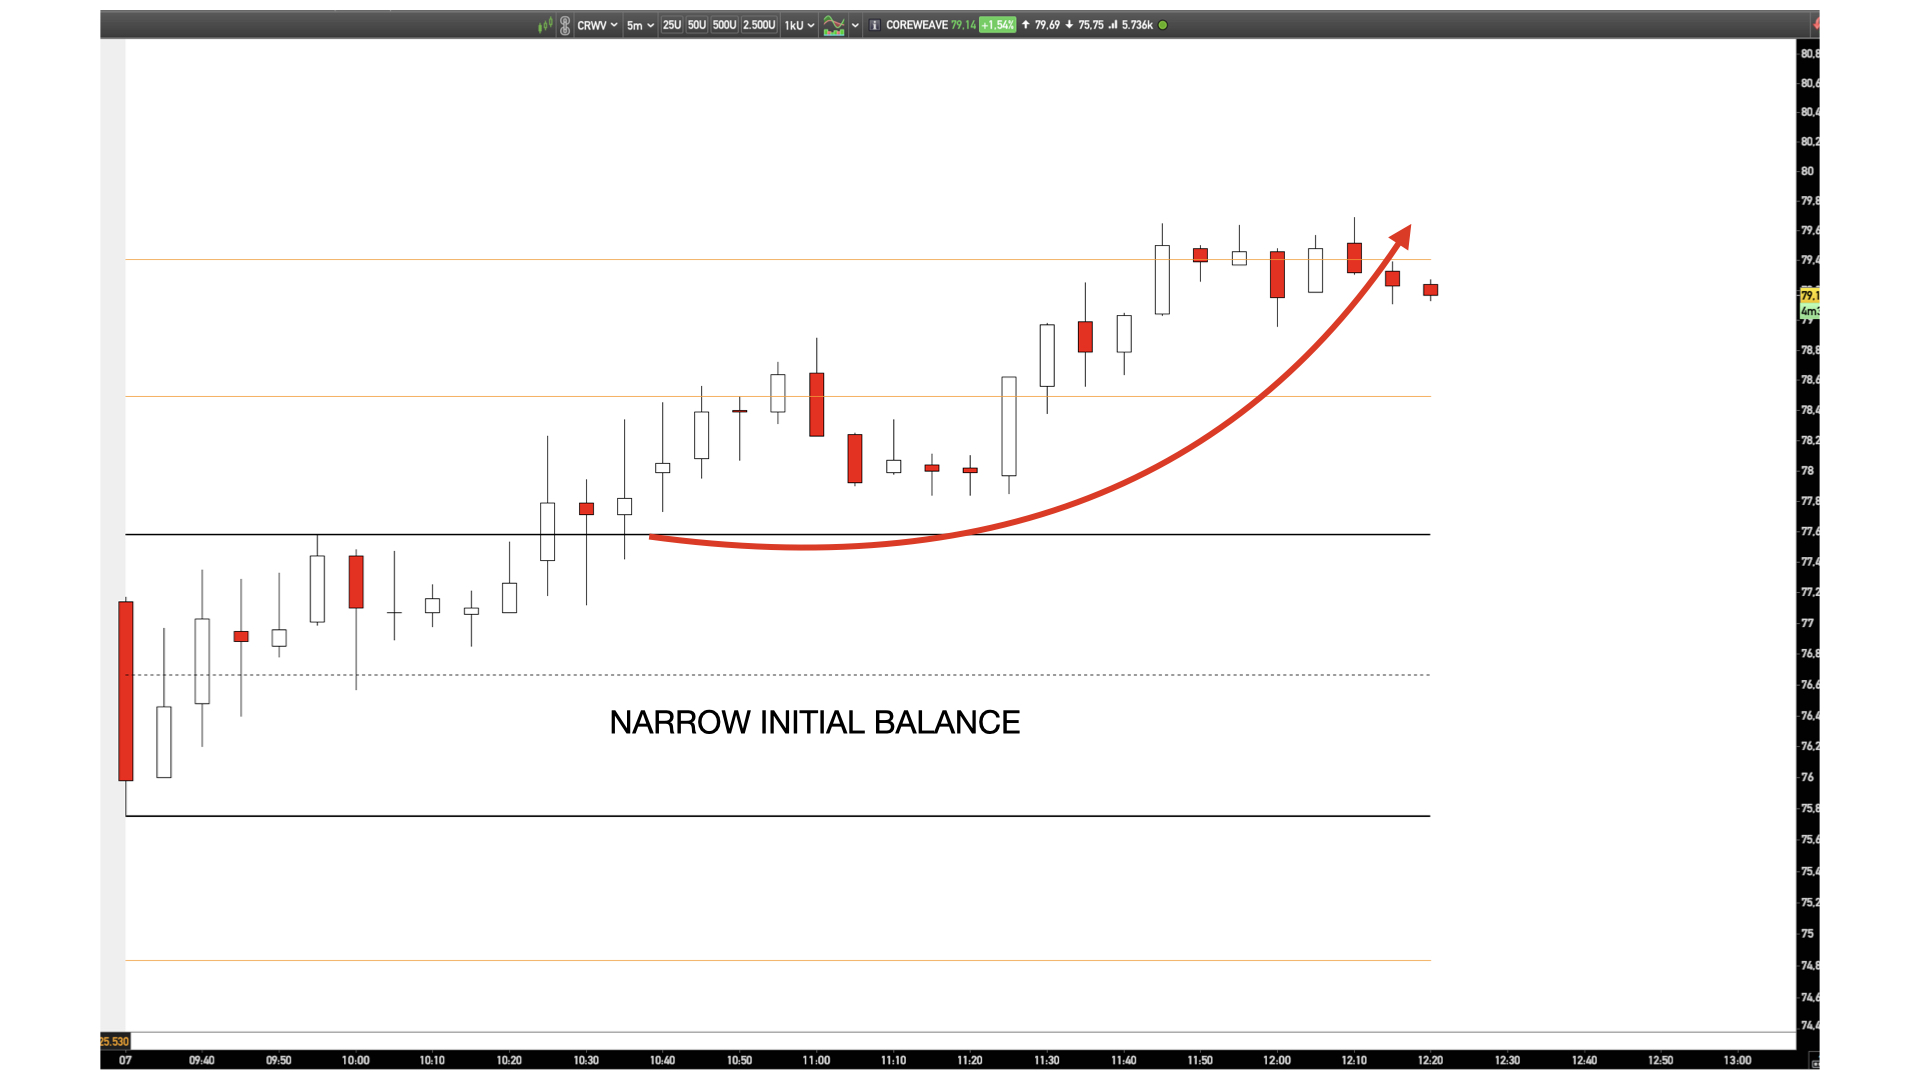
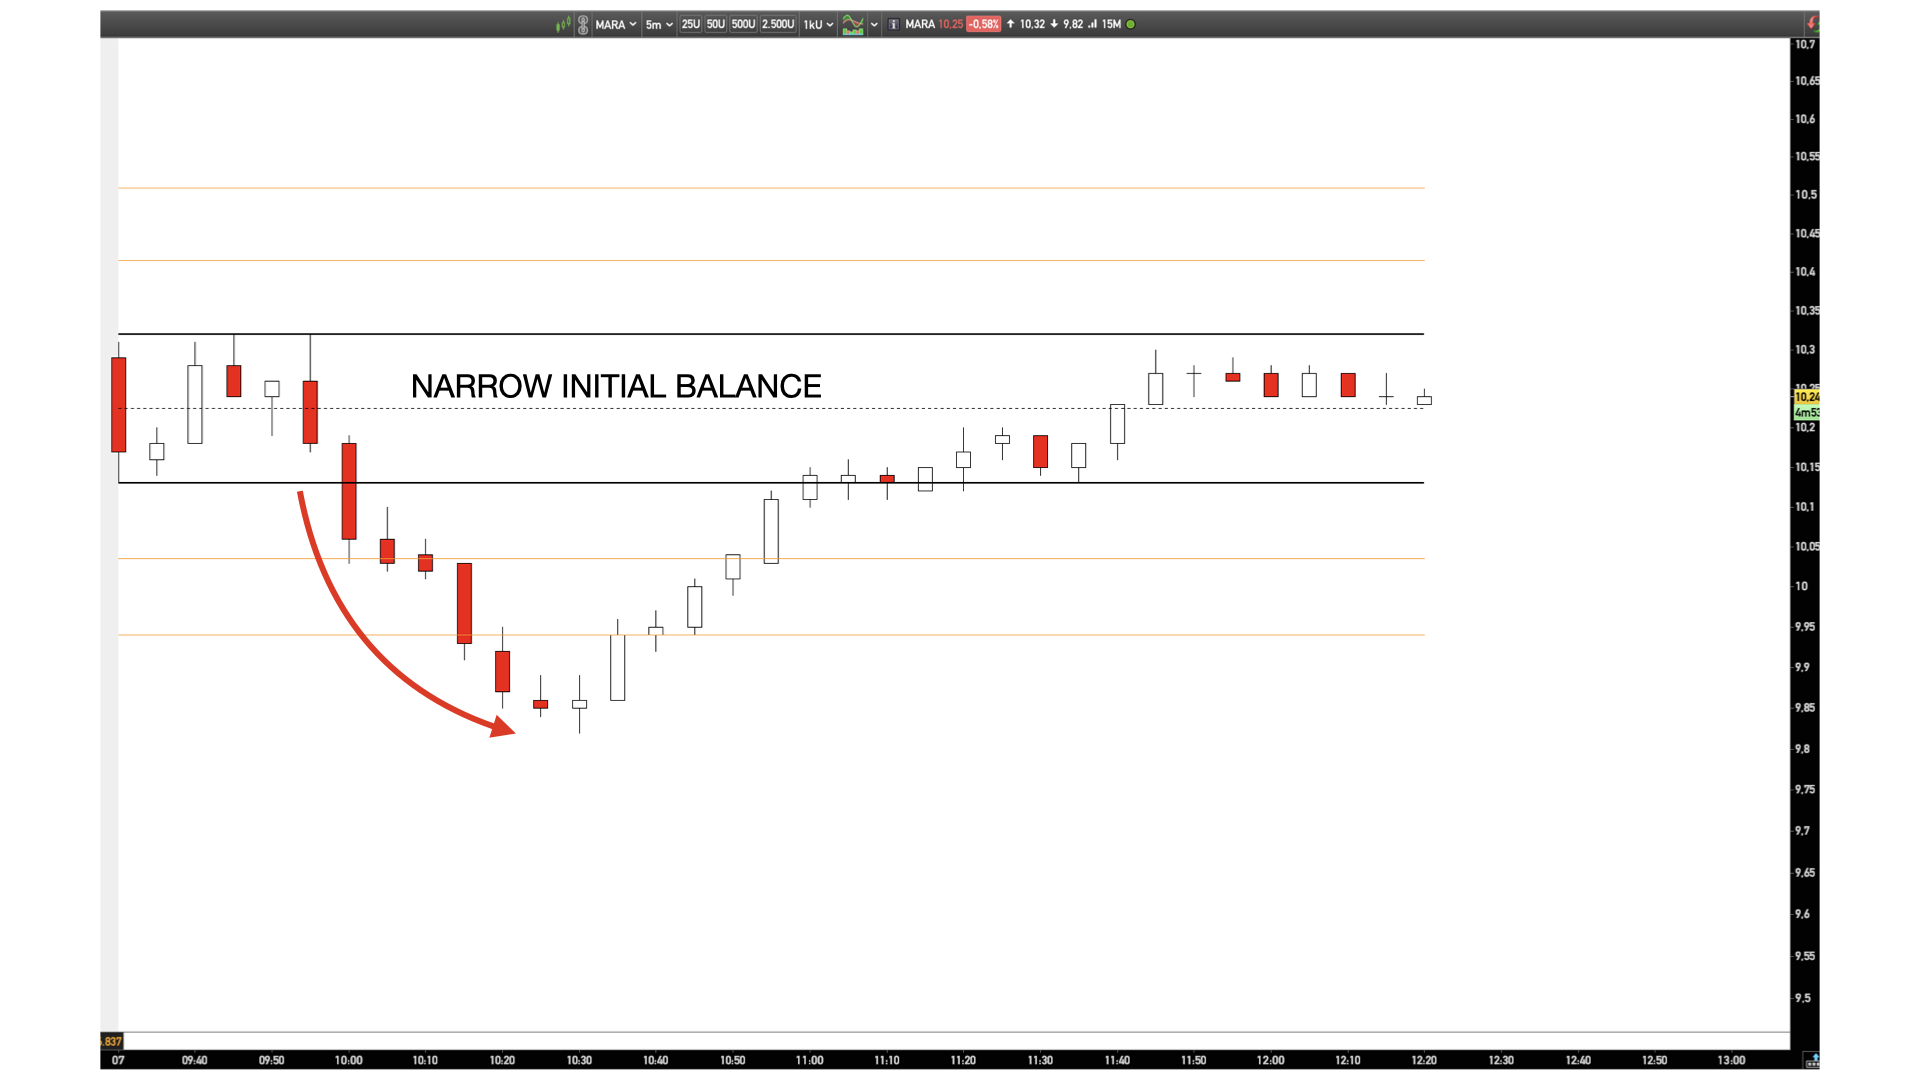
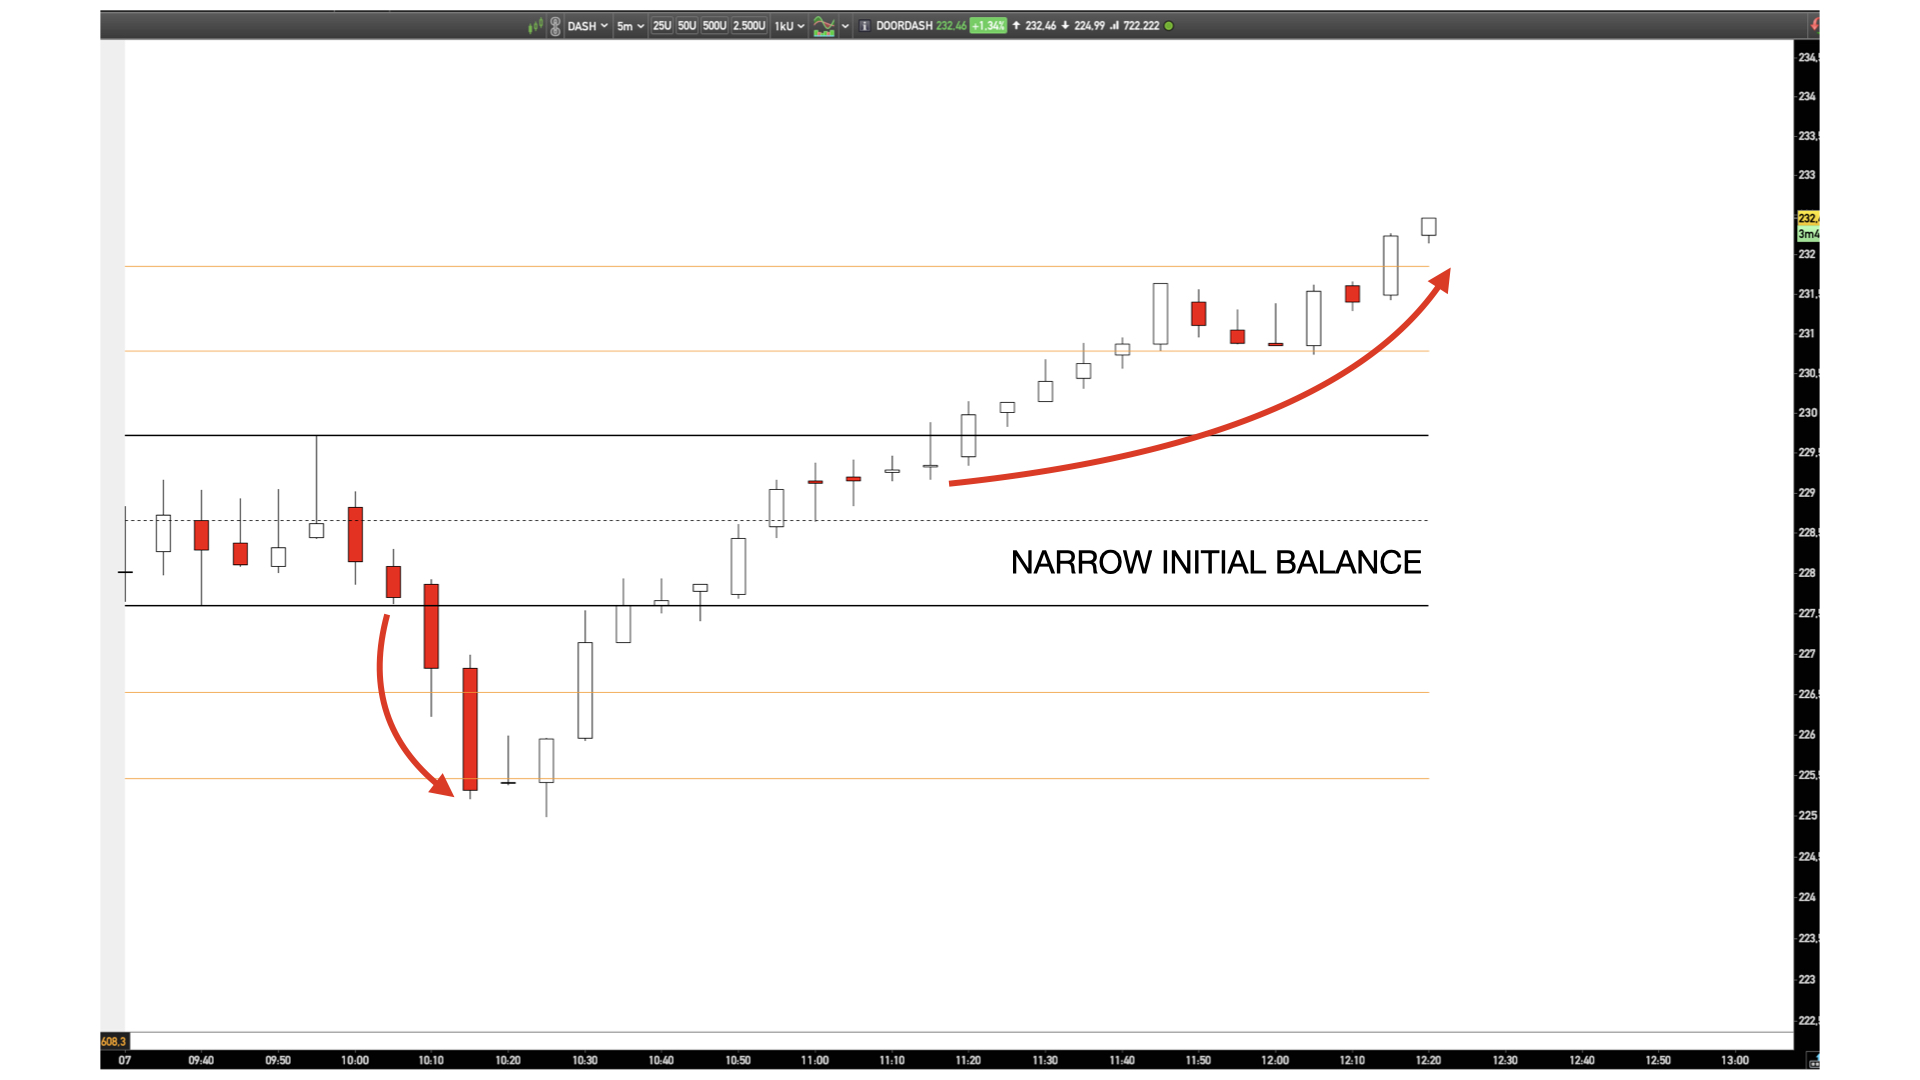
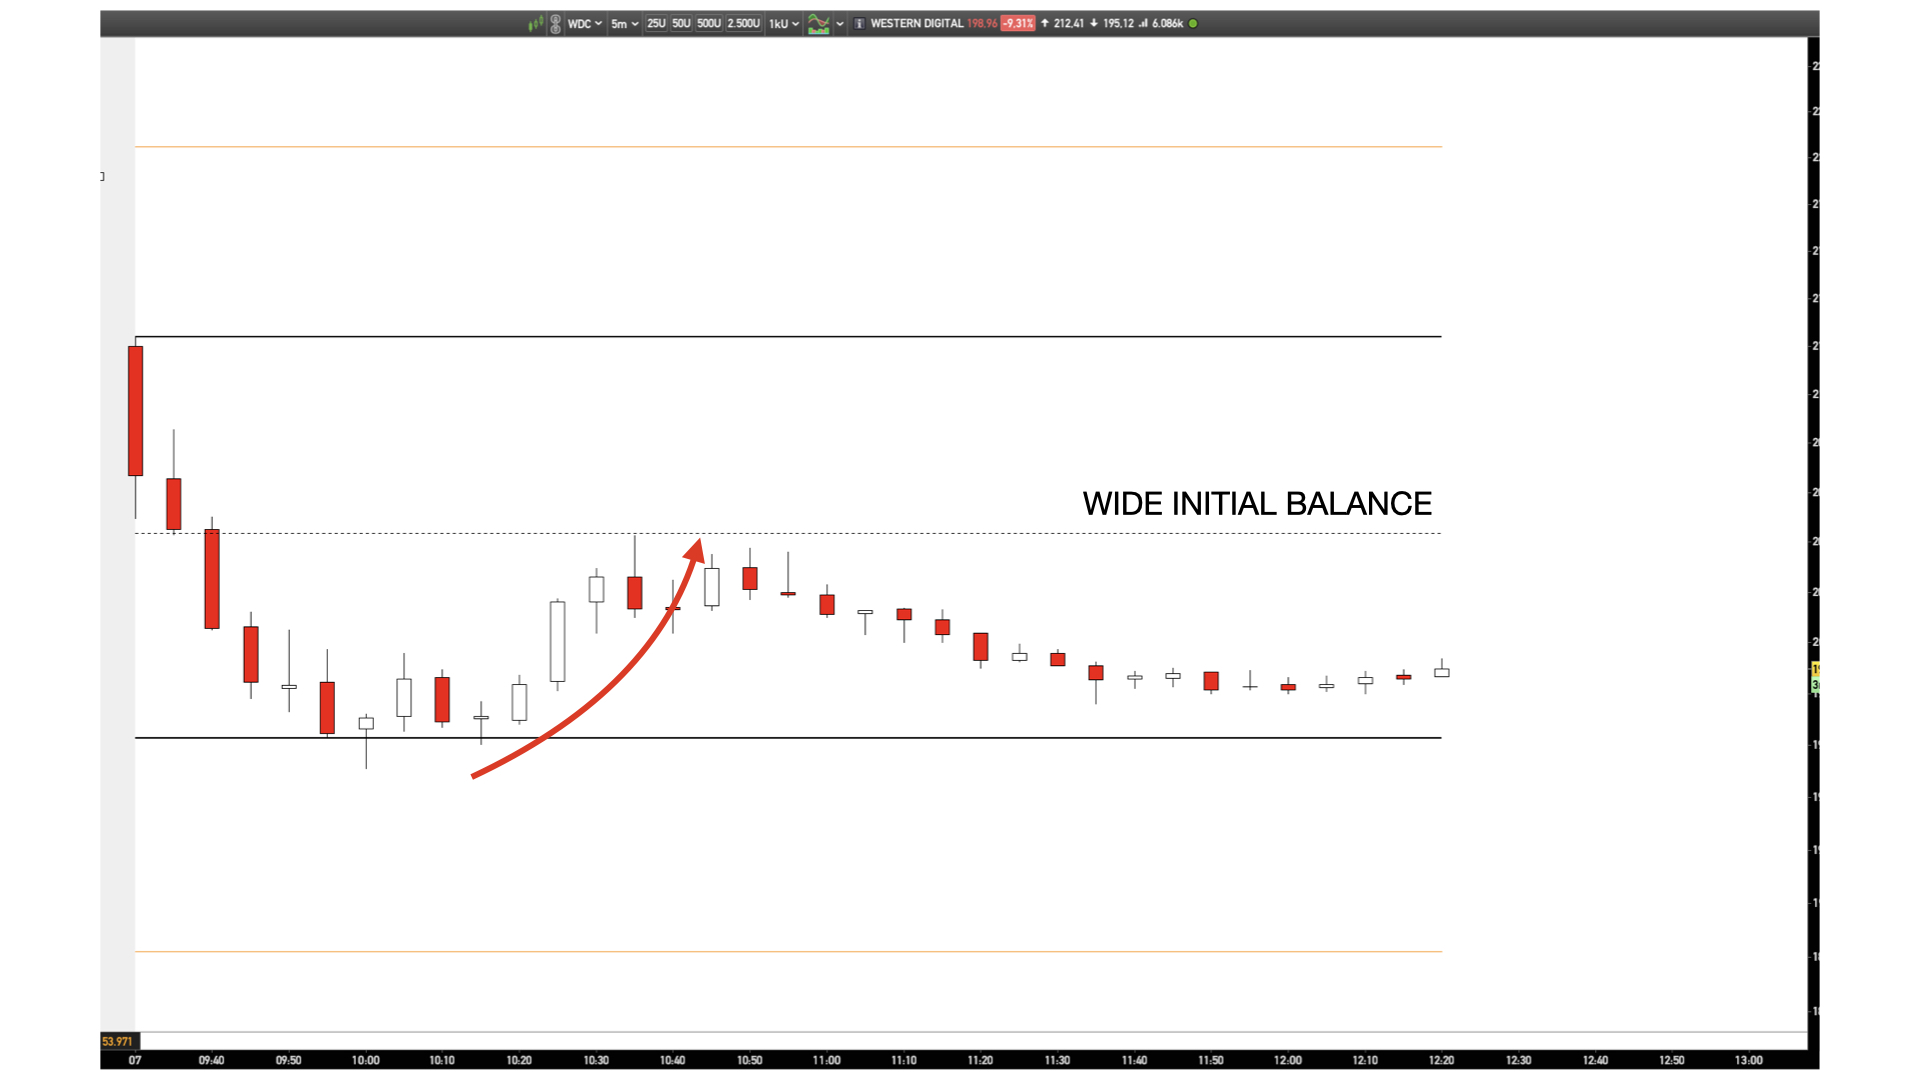
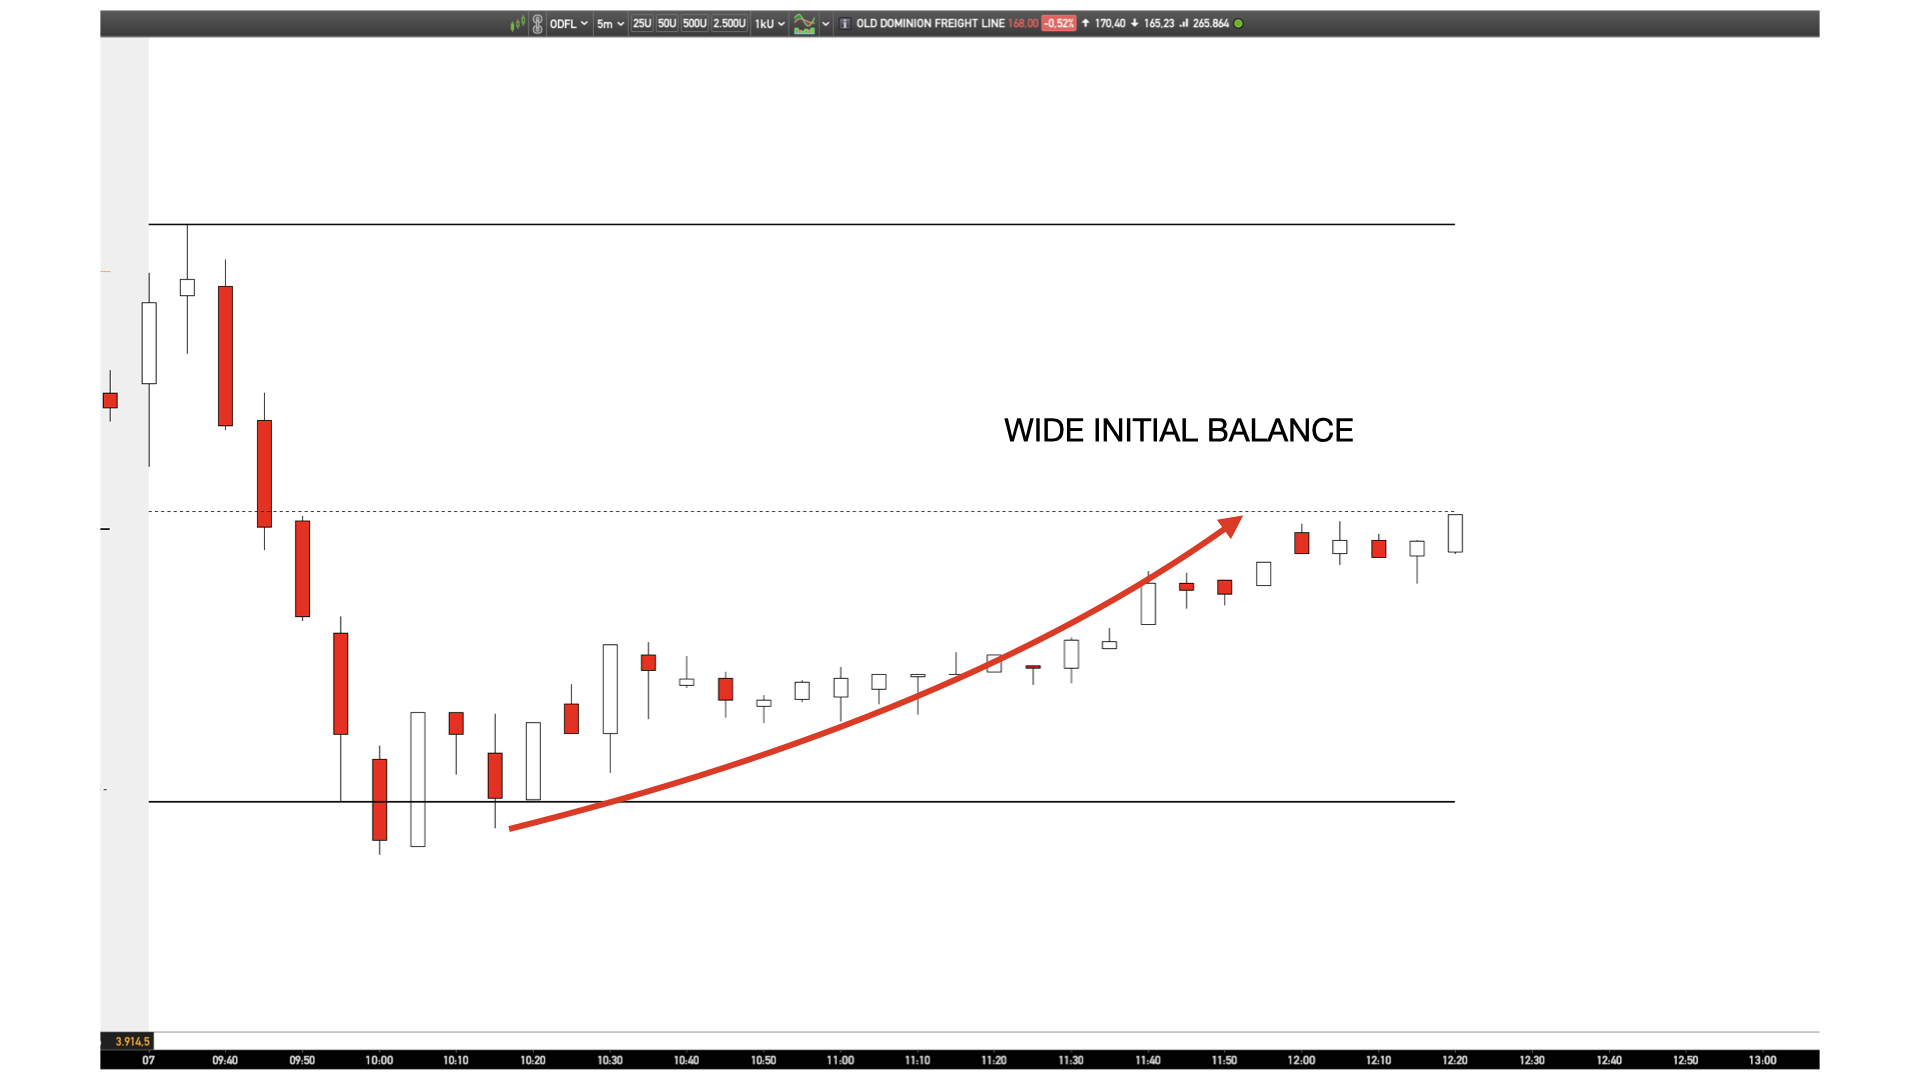
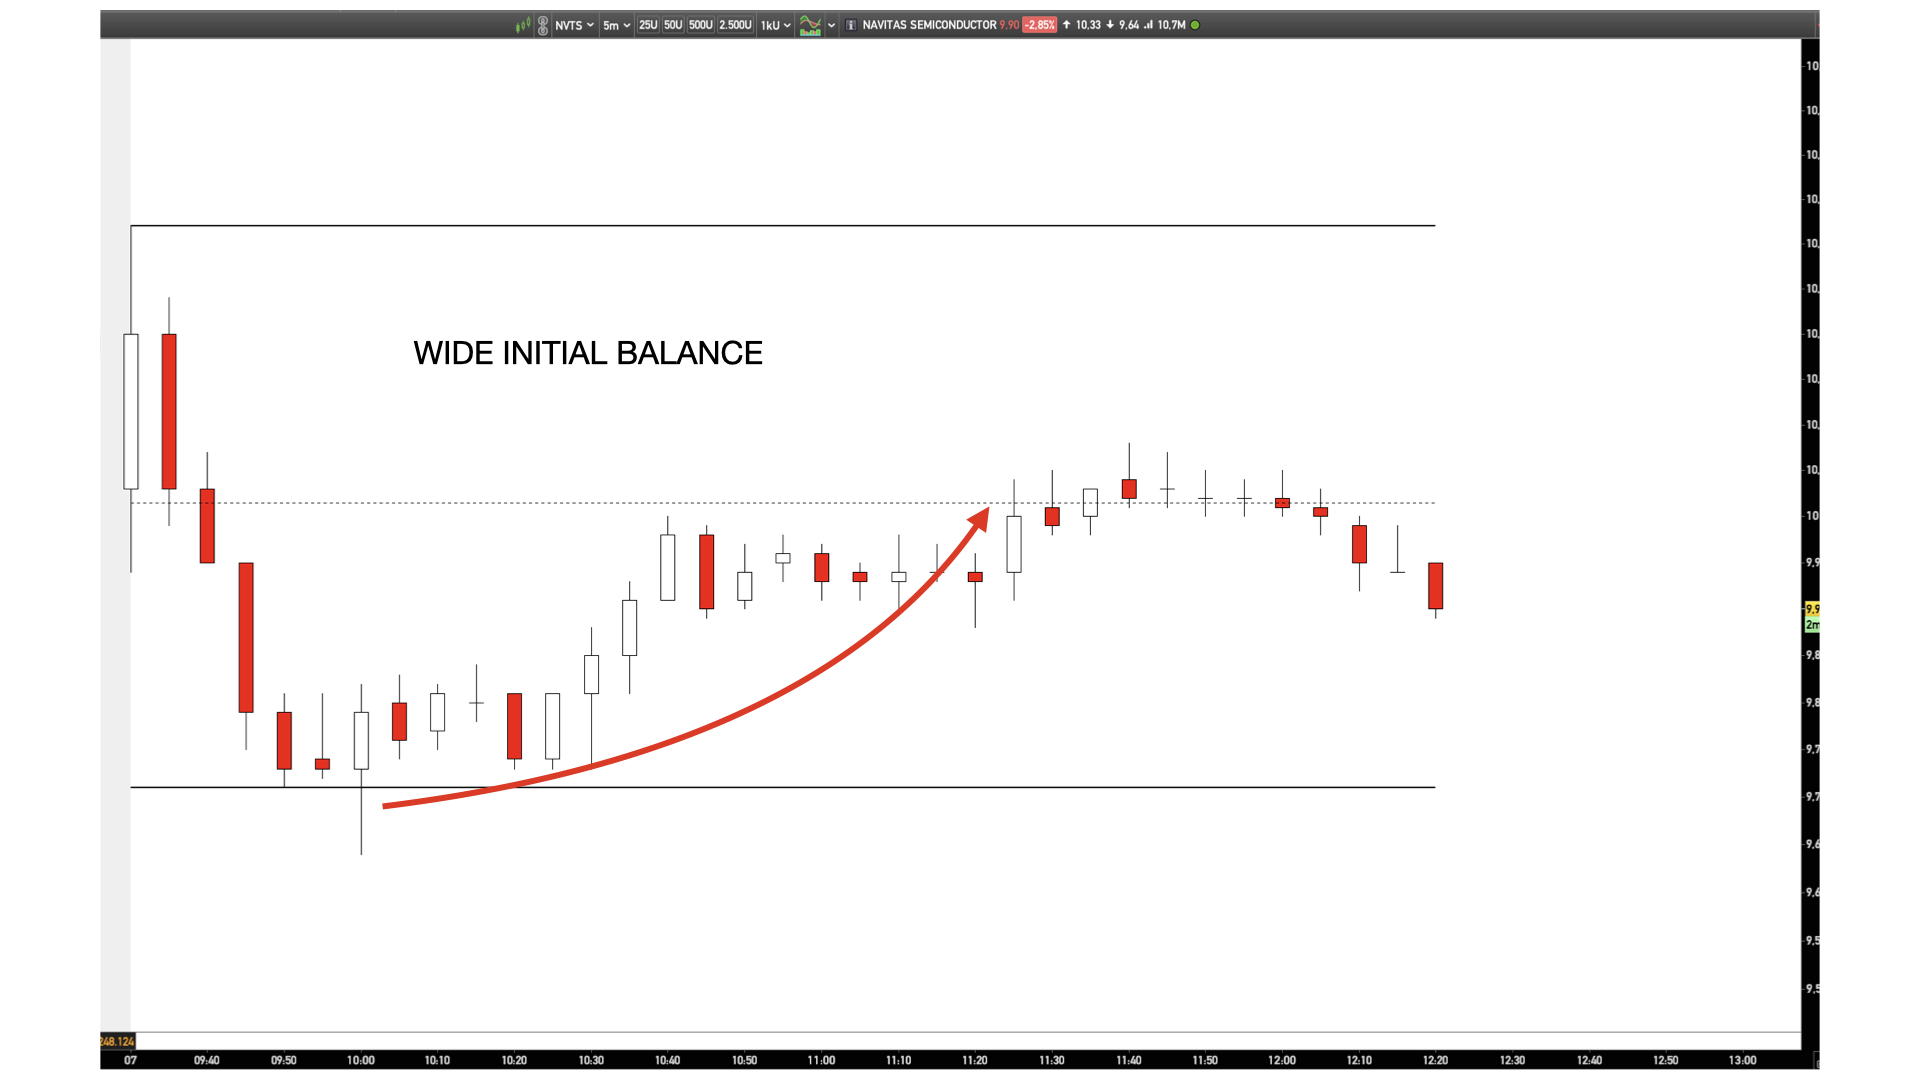
- If the Initial Balance is narrow as compared to average, price will likely break free form the range and auction toward new value, creating a range extension up to the plotted targets
- A wider than average Initial Balance is on the other hand harder to break and prices might fade the Initial Balance extremes and reverse back to the Initial Balance midpoint.
Who this indicator is for
- Intraday traders
- Stocks, FX and crypto traders
- Breakout and mean reversion strategies
- Traders seeking objective session-based levels


Valoraciones
No hay valoraciones aún.