


 VINCULUM WITH MM
LONG-TERM ELLIOTT WAVE ANALYSIS HYPOTHESIS OF THE NASDAQ INDEX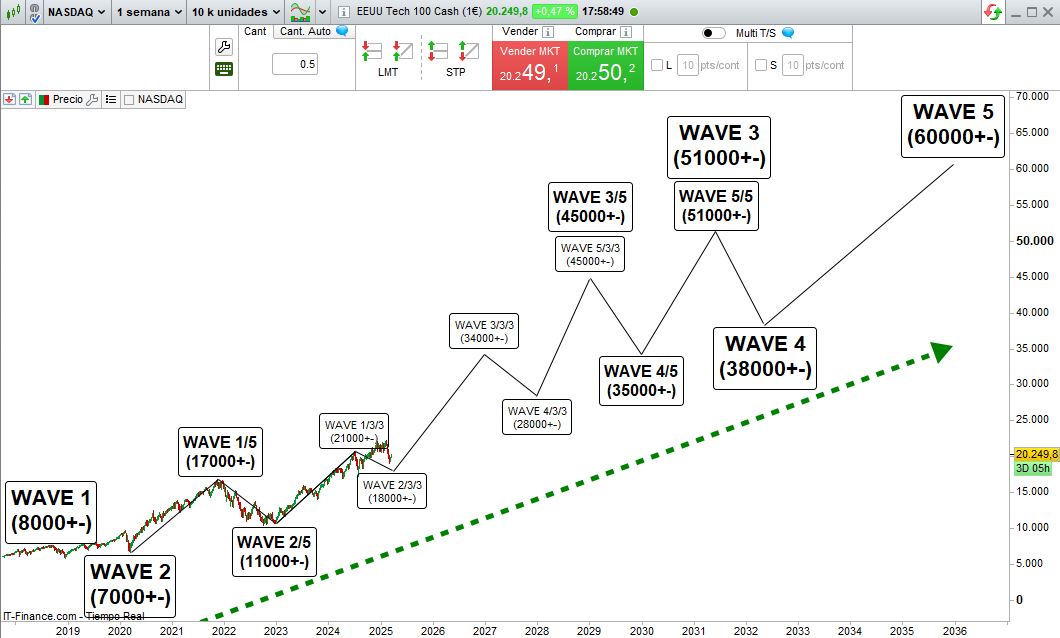 (MARCH 13, 2025;)
 (Next real results on september 30, 2025)
TECHNICAL OVERVIEW
The VINCULUM algorithm is a fully automated, long-only trading system operating on the Nasdaq 100 index (NDX), structured around the 1-hour timeframe. Designed on the ProRealTime platform, this strategy emphasizes mid-frequency, high-accuracy entries within trending phases, balancing a tight stop structure with moderately wide profit targets.
VINCULUM adopts a hybrid entry model incorporating breakout triggers, micro-momentum acceleration, and volatility filters. It is engineered for robustness across both volatile and calm market regimes, delivering reliable performance under realistic money management constraints.
While inspired by multiple pre-existing frameworks, VINCULUM is an original implementation with unique parameter tuning and capital scaling logic. It serves well both standalone and within diversified portfolios, offering consistent trade output and drawdown control.
TECHNICAL SPECIFICATIONS
- Algorithm Name: VINCULUM
- Target Market: Nasdaq 100 (US Tech 100 Cash)
- Position Type: Long-only (no short trades)
- Timeframe: 1-hour candles
- Platform: ProRealTime
- Programming Language: ProBuilder
- Trading Hours: UTC +1
- Trade Frequency: Moderate (3–7 trades per week)
STRATEGY PARAMETERS
- Stop Loss: ~1.00%
- Take Profit: ~5.00%
- Break-even Activation: At approximately +0.30%
- Trailing Stop: Enabled, includes layered logic
- Entry Conditions: Breakout structure, early momentum, volatility filter
- Money Management:
- Without MM: Fixed size (1 €/pip for €2,000 capital)
- With MM: Dynamic progression from 0.5 €/pip based on equity growth
PERFORMANCE COMPARISON
Starting Capital: €2,000
| Metric | Without MM | With MM |
|---|---|---|
| Maximum Historical Drawdown | -6.2% | -13.7% |
| Average Drawdown per Losing Streak | -2.5% | -4.3% |
| Average Reward-to-Risk Ratio | 3.5:1 | 3.5:1 |
| Win Rate | 68–72% | 68–72% |
| Estimated Annualized Return | 19–22% | 46–52% |
| Recovery Factor | 3.6 | 5.4 |
| Estimated Sharpe Ratio | 1.6 | 2.4 |
MONTECARLO SIMULATION RESULTS
Methodology: 100,000 random permutations of historical trade data
Probability of Profit
| Time Horizon | Without MM | With MM |
|---|---|---|
| 1 Year | 82.3% | 86.7% |
| 2 Years | 87.8% | 90.9% |
| 3 Years | 90.9% | 94.1% |
| 4 Years | 92.7% | 95.9% |
| 5 Years | 94.2% | 97.0% |
Average Profit
| Time Horizon | Without MM | With MM |
|---|---|---|
| 1 Year | ~€2,600 | ~€7,800 |
| 2 Years | ~€6,000 | ~€28,000 |
| 3 Years | ~€10,200 | ~€80,000 |
| 4 Years | ~€14,600 | ~€160,000 |
| 5 Years | ~€18,000 | ~€250,000 |
Additional Metrics
| Metric | Without MM | With MM |
|---|---|---|
| Projected Max Drawdown (VaR 99%) | -6.1% | -14.2% |
| Standard Deviation of Equity Curves | €3,900 | €72,000 |
EXTENDED TECHNICAL CONCLUSION
VINCULUM is a versatile, resilient trading algorithm designed to perform optimally in moderately trending markets with occasional bursts of volatility. Its 1-hour candle base allows it to remain responsive without becoming reactive—entering positions only under specific confluences of breakout force and early trend acceleration.
The risk-reward profile is tuned for a 5:1 target-to-stop ratio, with high entry precision and strong trailing logic ensuring that profits are both captured and protected. With its relatively tight stop loss and fast break-even trigger, the system minimizes exposure per trade while maintaining a high win rate.
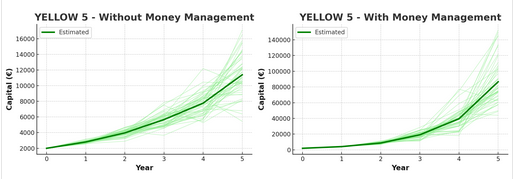
Without money management, VINCULUM achieves strong linear growth with controlled equity drawdowns, ideal for strict capital requirements or prop trading criteria. With dynamic pip sizing, the strategy multiplies capital effectively while still avoiding over-leverage or volatility blowouts.
Monte Carlo analysis affirms the strategy’s statistical integrity, with narrow deviation bands and very high profitability probability over multi-year horizons.
VINCULUM is the right tool for traders who prioritize:
- Medium-frequency, high-precision bullish trades
- Scalable growth potential via dynamic risk sizing
- Fast breakeven and conservative downside control
- Clean equity curves with solid win/loss symmetry
- Structural protection during volatile market spikes
Its robust balance between frequency, precision, and growth rate makes it an excellent algorithmic solution for both new and experienced quantitative traders.
ENDIF


Reviews
There are no reviews yet.