


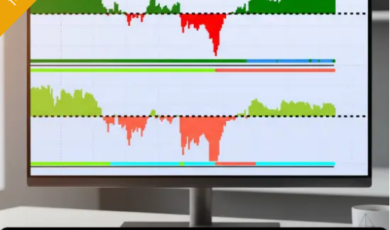
Trend Analysis with Pivot Zones by @InversoresInstitucionales is an advanced analytical tool designed to provide a visual representation of both past and future trends in primary and secondary orders. This tool employs sophisticated algorithms to identify and highlight critical turning points in market trends, enabling users to gain a comprehensive understanding of market dynamics. By analyzing historical data and the potential development in the future, it allows users to make informed decisions, whether for investment, or trading. The visual component of this tool makes it accessible and intuitive, helping users quickly grasp complex trend patterns and anticipate potential market shifts.
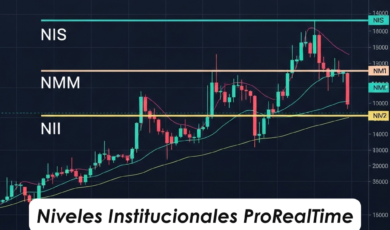
It is the perfect companion for users that already use Pivot Zones by @InversoresInstitucionales in their day to day analyses, and it does not require any parameter or configuration to work on any asset.
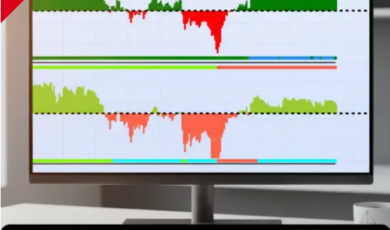
We have also added a special feature that provides the probability that each scenario (bullish, sideways, or bearish) both for primary and secondary treds, and a chart that displays visually how these probabilities have evolved in time.


In the latest update, we have added a module that provides advanced statistics for the asset the user wants to trade. n particular:
- Probability that the price will go up in the next number of candles configured by the user.
- Probability that the price will move above a percentage established by the user.
- Probability that the price will fall below a percentage established by the user.
- Average change in terms of percentage in the next number of candles configured by the user when the asset was in similar trend and scenario probability conditions.
In the following video -in Spanish, but you will find subtitles in other languages-, you will find a short guide to correctly visualize and interpret the information provided by this indicator.
In the next video, you will find a thorough study over 17 years of intraday candles that proves that tight relationship between the information provided by our indicator and the performance of a key asset such as S&P500.
Reviews
There are no reviews yet.