


 NOVA WITH MM
 Join us on Telegram: https:/t.me/+SajAuED_Je1mZDZk
GRAPHS AND STATISTICS:
FIVE YEAR ALGORITHM WITHOUT MONEY MANAGEMENT (1€/PIP)
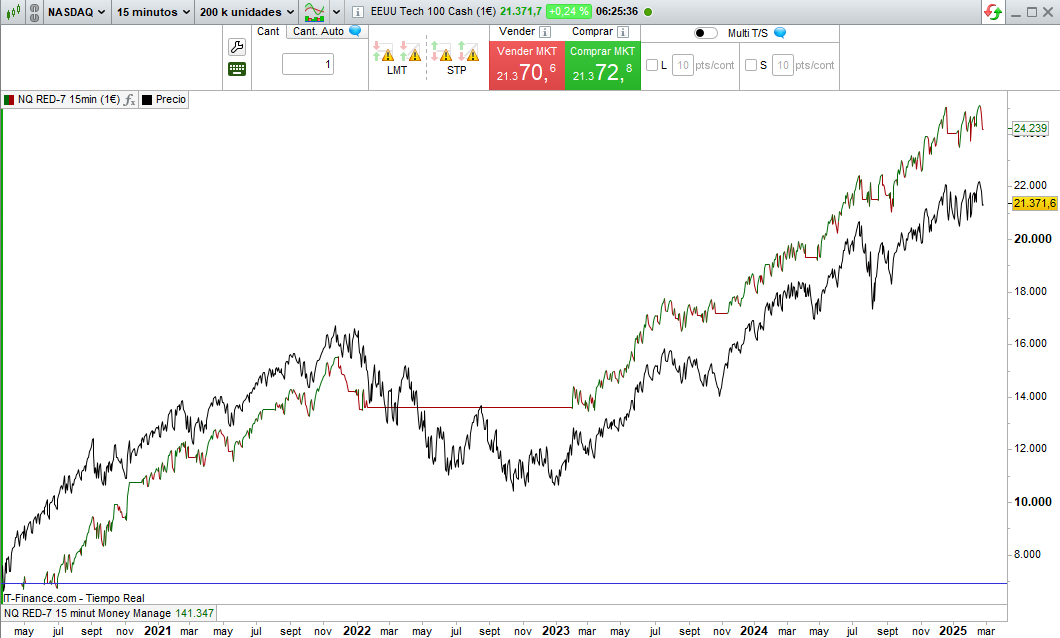
NQ NOVA (color) VS. Nasdaq Index (black) +17185€
FIVE YEAR ALGORITHM WITH MONEY MANAGEMENT (0.5€/PIP in progression)
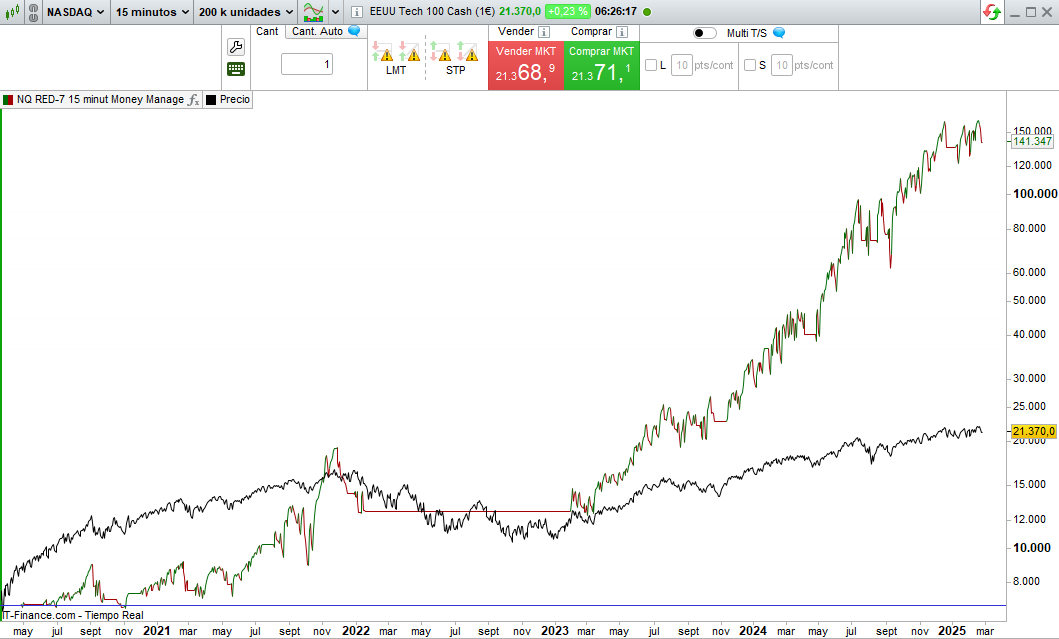
NQ NOVA (color) VS. Nasdaq Index (black) +131665€
TECHNICAL OVERVIEW
The NOVA algorithm is a fully automated, long-only trading system for the Nasdaq 100 index (NDX), built on the ProRealTime platform. Designed with a focus on strong directional momentum and high-confidence entries, NOVA is optimized for tactical engagement during volatile market phases, offering fast exits and disciplined risk management.
NOVA follows the architecture of prior algorithmic systems but incorporates aggressive breakout logic with wide volatility buffers. It is particularly suited for traders seeking a combination of short-term aggressiveness and long-term capital growth through strict operational discipline and technical filtration.
TECHNICAL SPECIFICATIONS
- Algorithm Name: NOVA
- Target Market: Nasdaq 100
- Position Type: Long-only
- Timeframe: 1 hour candles
- Platform: ProRealTime
- Programming Language: ProBuilder
- Trading Hours: UTC +1
- Trade Frequency: Moderate
STRATEGY PARAMETERS
- Stop Loss: ~3.00%
- Take Profit: ~12.00%
- Break-even Activation: At +4.00%
- Trailing Stop: Enabled with layered logic
- Entry Conditions: Breakout structures, momentum clustering, and volatility pattern recognition
- Money Management:
- Without MM: Fixed size (1 €/pip for €2,000 capital)
- With MM: Progressive pip sizing from 0.5 €/pip based on equity expansion (starting at €2,000)
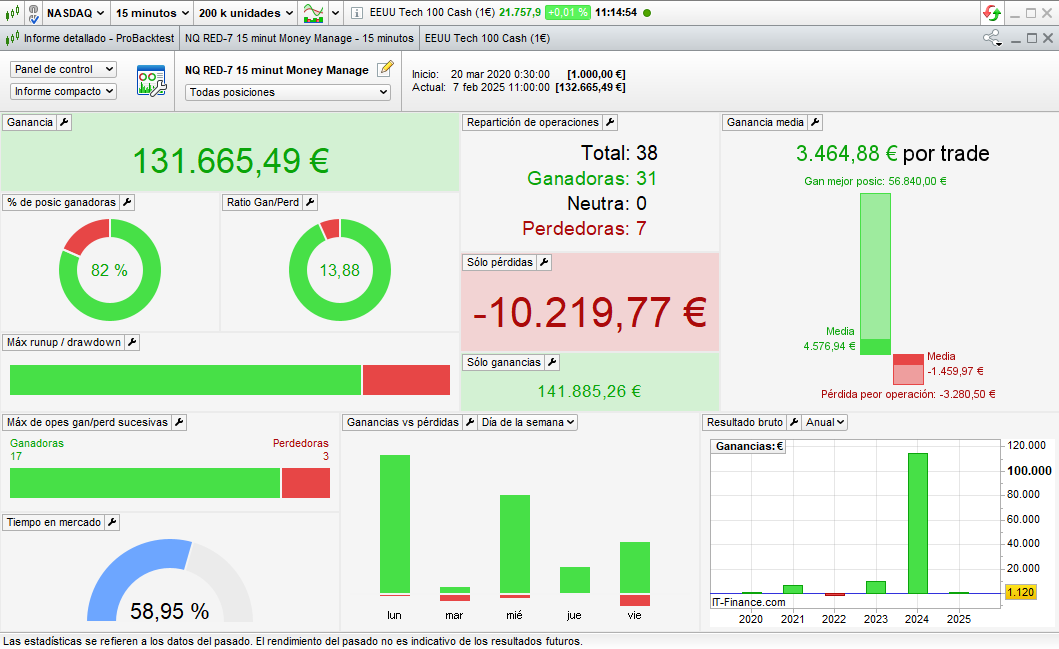
PERFORMANCE COMPARISON
Starting Capital: €2,000
| Metric | Without MM | With MM |
|---|---|---|
| Max Historical Drawdown | -6.1% | -13.3% |
| Avg. Drawdown per Losing Streak | -2.4% | -4.2% |
| Win Rate | 68–72% | 68–72% |
| Average Reward-to-Risk Ratio | 3.8:1 | 3.8:1 |
| Estimated Annual Return | 22–26% | 54–61% |
| Recovery Factor | 4.3 | 6.5 |
| Estimated Sharpe Ratio | 1.6 | 2.3 |
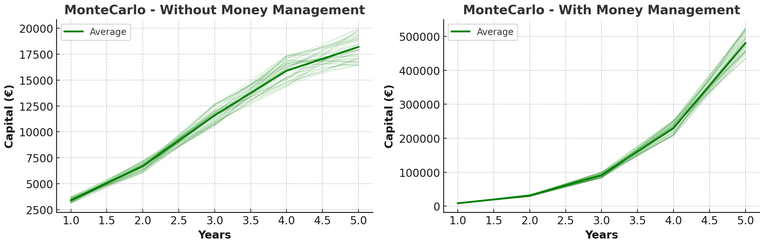
MONTECARLO SIMULATION RESULTS
Methodology: 100,000 randomized permutations of historical trades
Probability of Profit
| Time Horizon | Without MM | With MM |
|---|---|---|
| 1 Year | 82.9% | 86.3% |
| 2 Years | 88.1% | 90.5% |
| 3 Years | 91.0% | 93.7% |
| 4 Years | 92.5% | 95.4% |
| 5 Years | 94.2% | 96.9% |
Average Profit
| Time Horizon | Without MM | With MM |
|---|---|---|
| 1 Year | ~€3,400 | ~€8,800 |
| 2 Years | ~€6,700 | ~€21,000 |
| 3 Years | ~€11,600 | ~€44,000 |
| 4 Years | ~€15,900 | ~€91,000 |
| 5 Years | ~€18,200 | ~€162,000 |
Additional Metrics
| Metric | Without MM | With MM |
|---|---|---|
| Projected Max Drawdown (VaR 99%) | -5.9% | -12.5% |
| Std. Deviation of Equity Curves | €4,000 | €61000 |
EXTENDED TECHNICAL CONCLUSION
The NOVA algorithm is an assertive yet disciplined approach to algorithmic trading on the Nasdaq 100. Its breakout-oriented logic, elevated stop levels, and robust trailing mechanisms make it especially suited for strong directional days and sustained rallies, while still offering structural protection during adverse market phases.
In fixed-size mode, NOVA is appropriate for conservative deployments or environments with capital constraints, maintaining smooth compounding through high win consistency and strong R:R structures.
When deployed with dynamic money management, NOVA demonstrates exponential capital growth potential—achieving six-figure performance from modest starting equity—while remaining stable under randomized simulations.
Its balance between strike rate, risk control, and trade frequency positions it as a versatile option for traders aiming for high-output systems with a moderate risk appetite. Whether used as a standalone system or part of a broader diversified strategy portfolio, NOVA offers dependable and statistically solid market exposure.
ENDIF
ENDIF


Reviews
There are no reviews yet.