How the “Price Level” indicator works
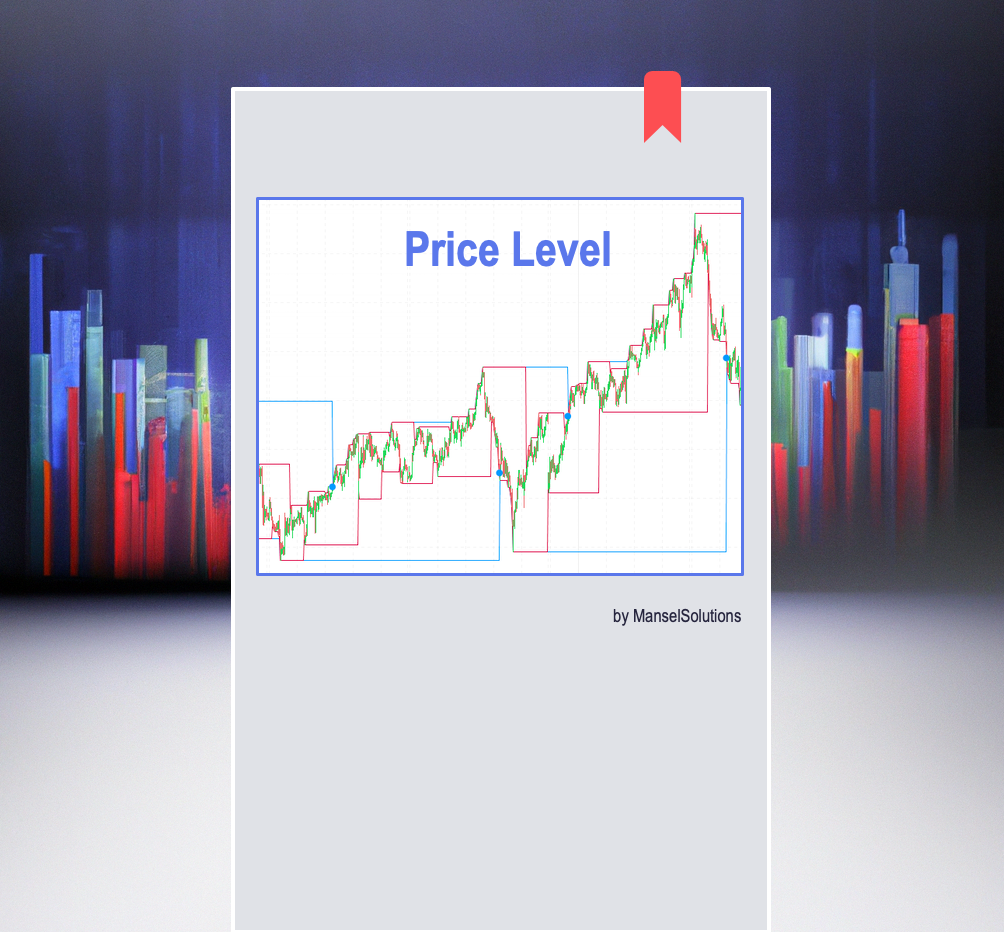
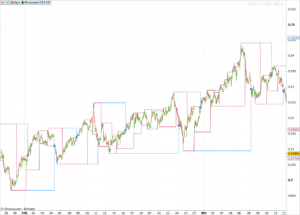
A adjustable indicator based on two averages – visualizes the price levels of a larger average zone defined by number of candles of your timeframe, called channel, and possible trading support and resistance prices within the channel. The Indicator shows you the change in direction of the channel and is also the price level that you should pay attention to for entry and exit positions, marked with blue dots in the screenshot:
Usage and Your Advantages
The main price levels, marked here with blue dots in the screenshot, are points at which the market changes direction or confirms the previous direction – this are your POI’s (Points of Interest) . Here some more advantages using this indicator:
- adjustable average zones “channel” and “trade”
- useable in all timeframes, also 1H, 4H etc.
- for index, forex and commodities market
- easy to use and to understand
- visualizes market movements and POI’s
How to adjust the indicator
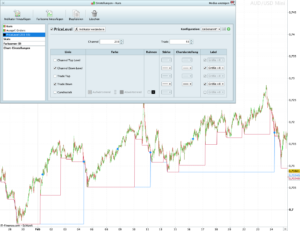
The indicator can be used on all time frames – adjust the “channel” and “trade” variables depending on the average zone you want to see and your personal trading style. The “channel” describes the higher trend that you should follow, the “trade” marks the movements within the higher trend, here you should choose your options for entering and exiting your trades.
Terms and Conditions
Please note our general terms and conditions.
These are accepted by you when purchasing our products


Claudia Herz (verified owner) –
Great Indicator, Thanks ProTradeTools! Very useful to understand how the market moves are going on. Also I see now the zones I should not trade 😉