

Overview
The Pro Daily Breakout Screener is a powerful tool designed to identify high-probability breakout setups for the next day trading session.
By analysing market compression, multi-day ranges, Central Pivot Range levels, and volume dynamics, this screener provides traders with actionable opportunities ready to break out of key levels.
Problem
Traders often miss powerful breakouts because they don’t spot compression and range conditions early enough.
Solution
Pro Daily Breakout Screener automatically identifies daily setups ready to explode, giving you a head-start before the market opens.
Key features
- Dynamic breakout detection : Identifies setups ready to break out based on technical compression and range conditions
- Multi day-range evaluation : Analyzes narrow ranges over multi-day periods for breakout readiness
- Compression analysis : Detects low-volatility phases, signaling impending price expansion
- Next-day mode: Works after market close and lets you prepare the watchlist for the next da
- Multi instrument support: Compatible with stocks, forex, futures and other assets
Benefits for traders
- Anticipate market big moves: Spot breakout opportunities in advance
- Save time: Automatically scan the market for the best setups
- Improve trade accuracy: Rely on precise and accurate CPR and range calculations to focus on high-probability breakout trades
- Adaptable strategy: use it intraday for immediate setups or post-market for tomorrow’s opportunities and preparation
- Versatile application: Works across various instruments and markets to suit yuour trading style
How it works
The Pro Daily Breakout Screener uses advanced technical analysis to identify breakout-ready instruments.
- Compression detection: Identifies low-volatility phases by comparing the current range and CPR width against historical averages
- Range analysis: Evaluates muli-day ranges to detect narrow ranges signaling potential price expansion
- Inside days and multi-day pattern: Screens for consecutive inside days or narrow ranges, indicating heightened breakout potential
- Next CPR levels: Calculates tomorrow’s CPR (Central Pivot Range) to anticipate breakout setups for the upcoming session
- Volume and price conditions: ensures sufficient volume and price activity to validate tehe strength of the setups
This systematic approach allows traders to pinpoint opportunities with minimal effort, ensuring they never miss a potential breakout.
Settings
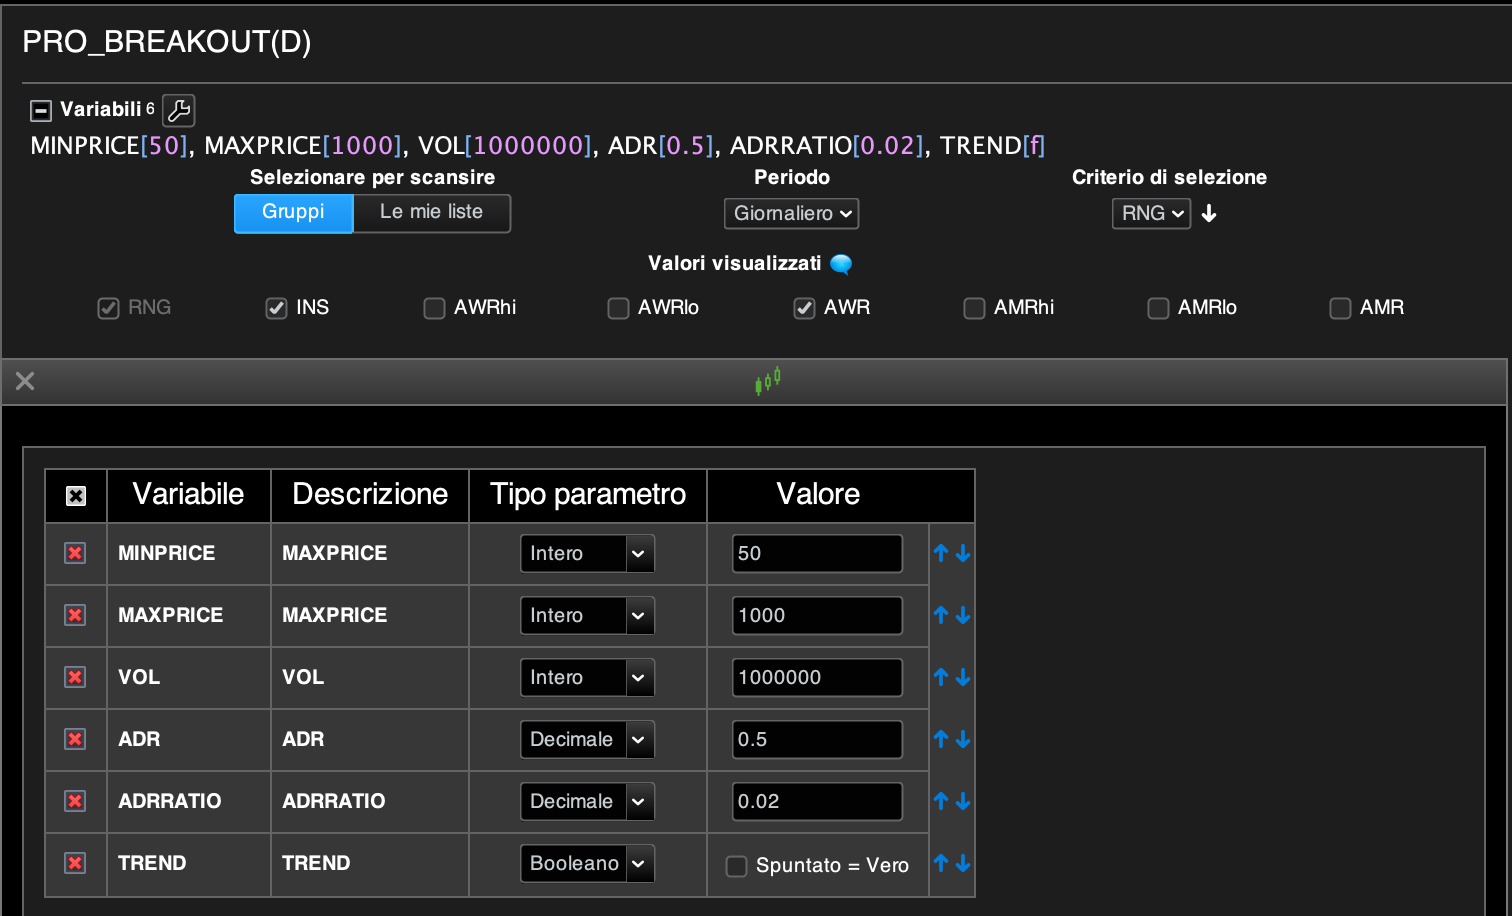
- PERIOD: leave it to “Daily”
- MINPRICE: the minimum price of the stock or asset to scan
- MAXPRICE: the maximum price of the stock or asset to scan
- VOL: the average volume of the asset (default = 1 Mio, ensures enough liquidity when used for stock scan)
- ADR: the minimum average daily range of the asset (default = 0,50$)
- ADRRATIO: the minimum ratio between the ADR and the last close price (default = 0,02 or 2%). The higher this number is, the more the asset is moving intraday
- TREND: additional flag to spot opportunities in a trend (uptrend or downtrend). This helps orientating the trade bias (long or short).
Results
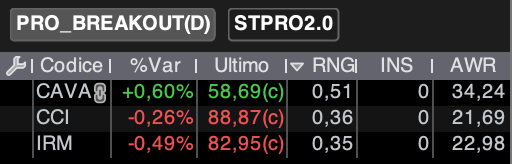
You can choose between the following information as info results of the screener:
- RNG: the ratio between last day range and ADR (Average Daily Range); the lower this is (i.e. < 0.65, the more compression and breakout we can expect)
- AWR: the Average Weekly Range that has alreaby been covered by the asset during the current week (in %).
- AWRhi: the distance in % between the last close price and the 100% weekly bullish target projected from current’s week low
- AWRlo: the distance in % between the last close price and the 100% weekly bearish target projected from curren’s week high
- AMR: the Average Monthly Range that has alreaby been covered by the asset during the current month (in %).
- AMRhi: the distance in % between the last close price and the 100% monthly bullish target projected from current’s month low
- AMRlo: the distance in % between the last close price and the 100% monthly bearish target projected from current’s month high
- INS: this refers to Inside days developed till the last session, included. It ranges from 0 to 3, with 1 indicating one inside day (increased likelihood of breakout), 2 indicating a double inside day pattern (even more likelihood of breakout) and 3 indicating a triple inside day pattern (very rare, explosive breakout opportunity).
- Independently from the “INS” result, the criteria for the Pro Daily Breakout screener are already optimized for the best breakout setups
Who can use it?
- Day Traders: Quickly find stocks with expansion potential
- Scalpers: Focus on instruments with immediate breakout potential
- Swing Traders: Spot multi-day compressions before significant moves
- Market Analysts: Gain insights into price behavior and volatility phases
Reference
The methodology behind the Pro Daily Breakout Screener is inspired by established principles of volatility-based analysis, including insights from Frank Ochoa’s teachings.
This screener has been independently developed and optimized for ProRealTime to provide traders with an efficient and reliable tool for daily breakout forecasting.


Reviews
There are no reviews yet.