

Features
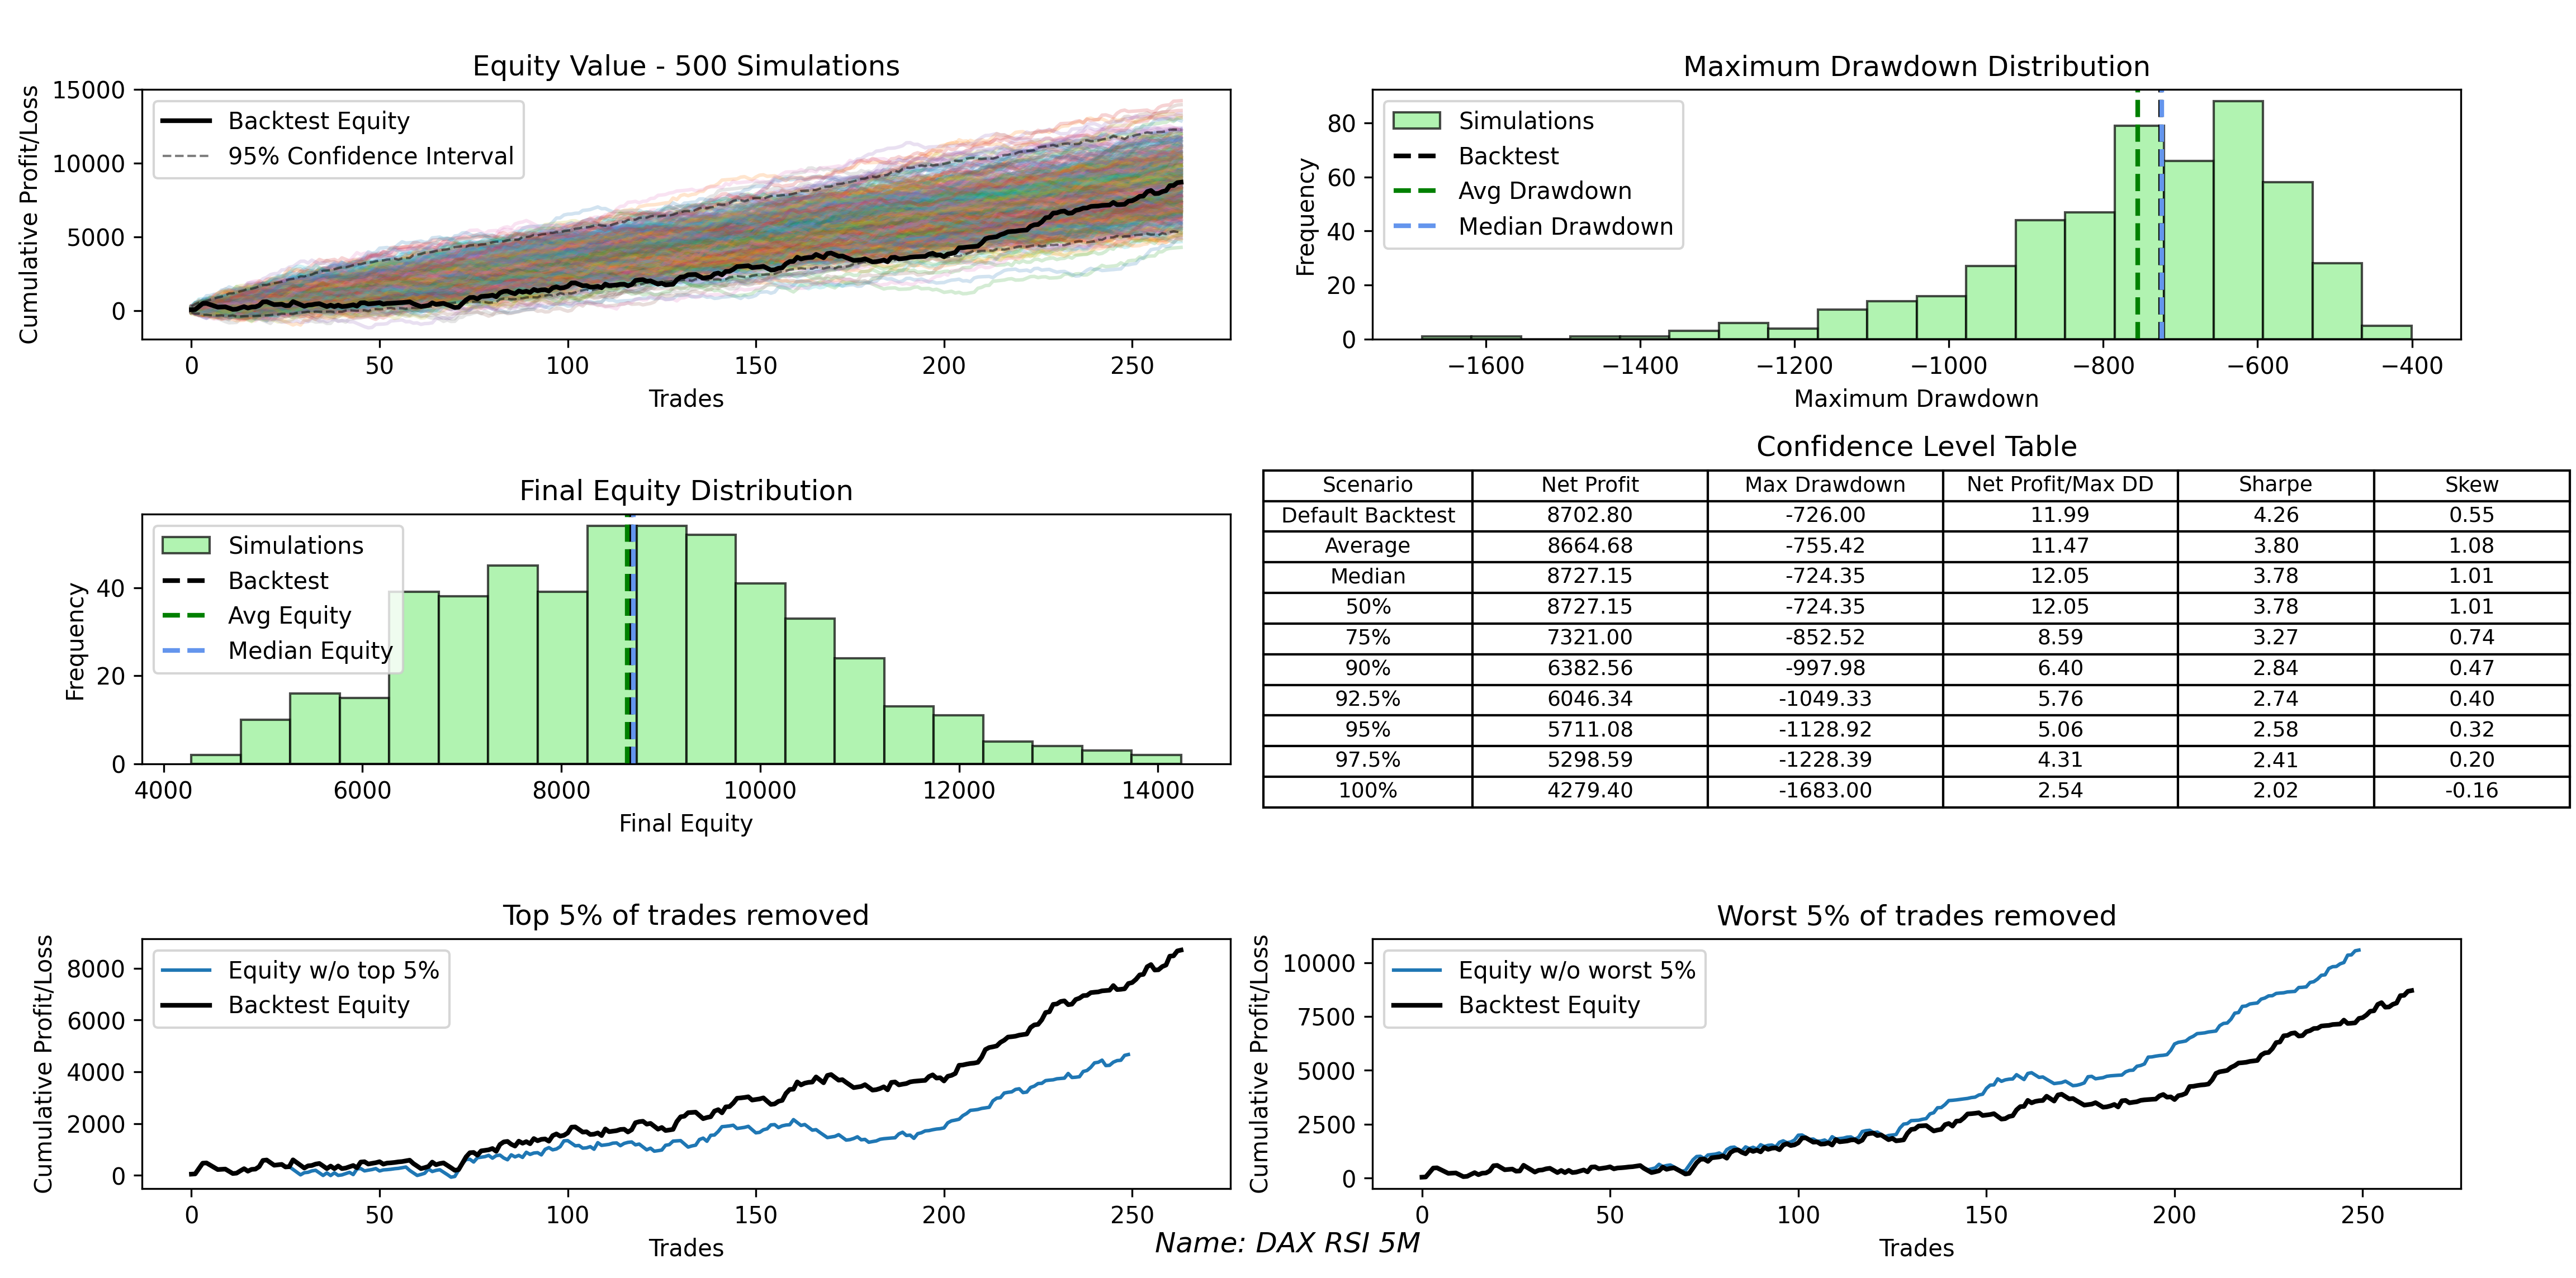
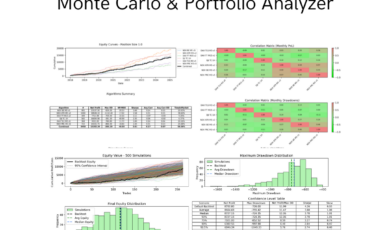
- Simulate hundreds or thousands of alternative equity curves based on your algorithm’s historical trades
- Analyze median and average drawdowns across all simulations
- View your backtest equity curve with the top and bottom 5% of trades removed
- View key metrics such as Sharpe Ratio, Skew, and Calmar Ratio (Net Profit / Max Drawdown) for different percentiles of your strategy
Why Use Monte Carlo for Algorithmic Trading?
This tool doesn’t replace a solid development process—but it adds another important layer of robustness testing. It helps you see how stable your algorithm is, and whether your backtest results may be the result of luck or overfitting. Simulations randomize both which trades are included and the order of the trades, giving you a range of possible outcomes
If your backtest drawdown is much lower than the average or median drawdown across simulations, it could be a sign of curve fitting and may warrant further testing or demo incubation. You can also test how your algorithm performs without its best trades—a valuable insight to your strategy.
How to Use Monte Carlo for Algorithmic Trading
- Run a backtest in ProRealTime using a consistent position size (e.g., 1 contract). (1 contract on US100 ≈ 0.5 contracts on Wall Street Cash)
- Go to the “Closed Position List” tab in the backtest dashboard
- Click the three dots in the top right corner and choose Export as .CSV
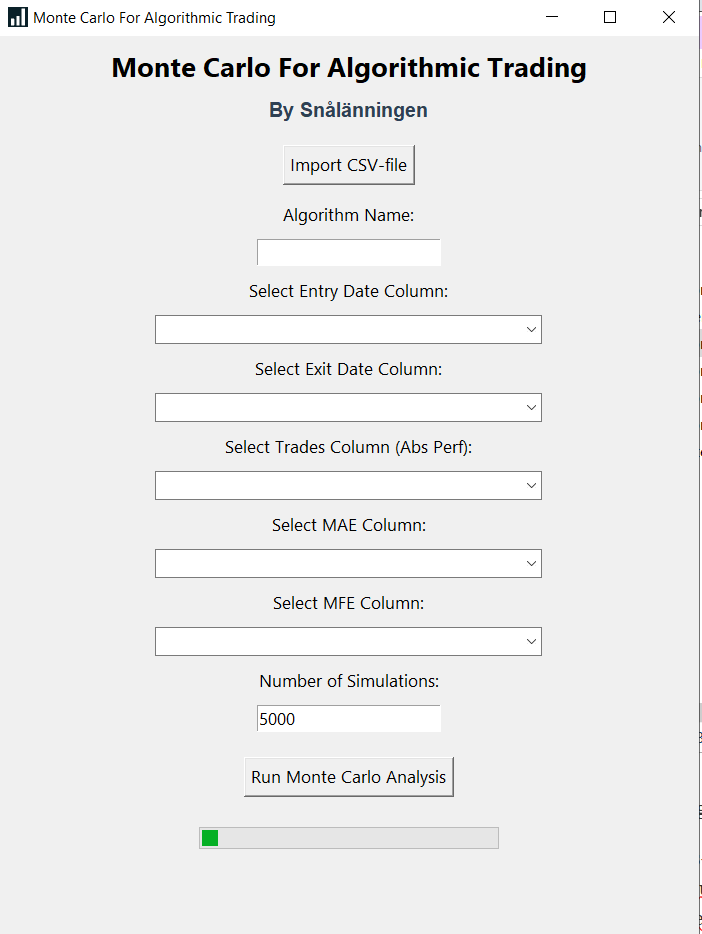
- Import your .csv file into the program
- Click “Run Monte Carlo” to begin your simulation
- To save down an image of your simulation, click the “Save image” icon in the bottom screen left corner.
How to Install Monte Carlo for Algorithmic Trading
- Purchase and download the setup.exe file.
- Extrect the .rar file. For testing purposes I included two example .CSV files.
- Click the MonteCarloSetup.exe and follow the installation steps.
- Start Simulating!
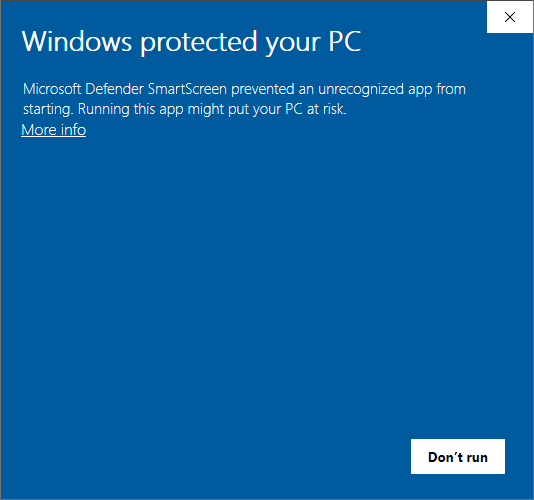
If Microsoft Defender Smart Screen pops up when installing, click “More Information” and then “Run Anyway”.
FAQ
What’s considered a good result?
That depends on your strategy and risk tolerance. Personally, I like to see a Net Profit / Max Drawdown (Calmar Ratio) of at least 2–3 in the 97.5 percentile.
If the backtest drawdown is far higher than the average and median, that could be a warning that your algorithm need further investigation. Also, I prefer strategies that remain profitable even without their top 5% of trades.
What is skew?
Trading returns are rarely balanced. A negative skew means many small gains but occasional large losses. A positive skew suggests small losses are more frequent, but larger gains occur often enough to outweigh them. Understanding the skew can give insights into the risk profile of your strategy.
Works on Windows 10/11.
For bug reports or feature requests, feel free to contact me at snalanningen@gmail.com
Reviews
There are no reviews yet.