What is TPO Based Market Profile?
Each TPO represents a point of time where the market traded at a specific price. A single TPO is displayed on the chart every time the price touched it during the same period of time. All the blocks are then stacked to form the MP
The most common setting of TPO, and used by professional traders, is 30-minute time interval.
What are the features?
- Period selection : daily/weekly/monthly/quarterly / Yearly / date to date, with custom daily time range
- Intraday(5min to 4hours)/ Daily/Weekly/monthly update to see the evolution of the different levels of the current session.
- Possibility to choose only the buying or selling candles, or the delta
- Possibility to highlight the different sessions of the main World Stock Exchanges (IB/Full Session)
- VPOC/VAH/VAL/Median Display
- Highlighting of the value area (VA)
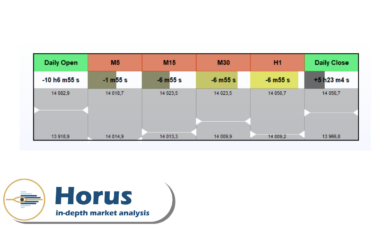
- Multi-display of the opening / closing
- Naked VPOC display
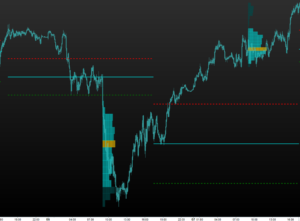
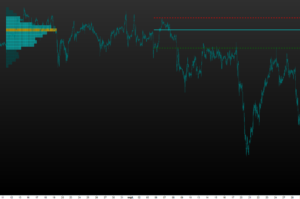
Daily cash session
Daily cash session with OPR (1h) highlighted
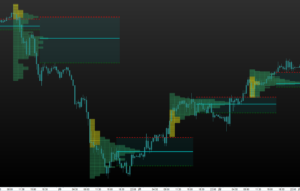
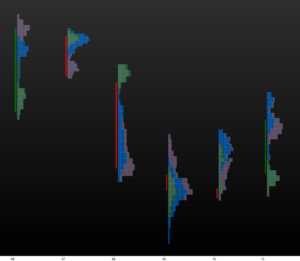
Weekly cash session with daily update
Monthly cash session with weekly update
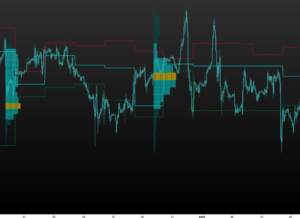
Date to Date session
Daily session with main stock exchange session highlighted and the price being hidden
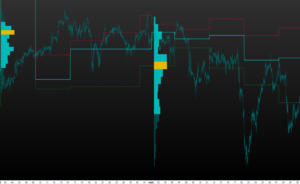
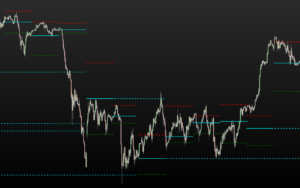
Daily session with naked vpoc displayed


clnh59 (verified owner) –
Very nice indicator. It allows a very fine analysis and has several options. Impressive and a tool that is now indispensable in my trading.