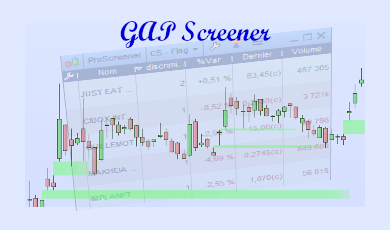
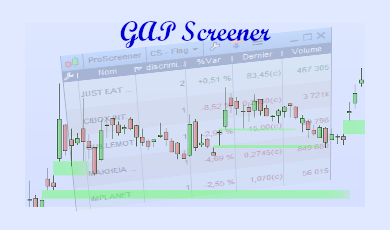
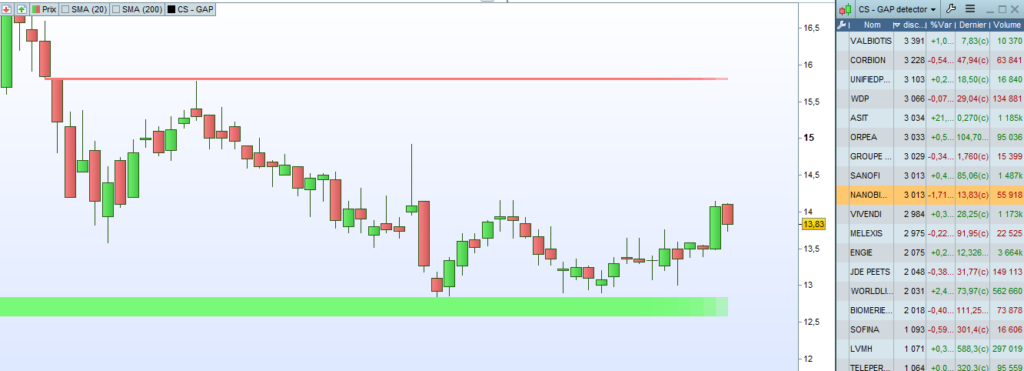
This screener finds GAPs in any timeframe.
Stocks are classified according to a discriminant:
- a discriminant over 3000 indicates a stock with a GAP under the price and another over the price.
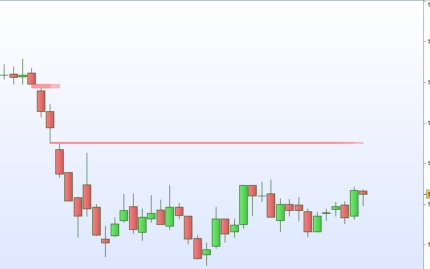
- a discriminant between 2000 and 3000 indicates a GAP over the price.
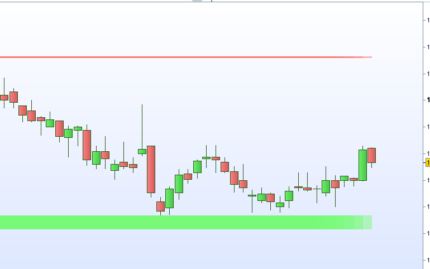
- a discriminant between 1000 and 2000 indicates a GAP under the price.
Advantage:
- an indicator is available to draw GAP on the graph.



Reviews
There are no reviews yet.