This indicator detects a horizontal resistance or bearish oblique resistance.
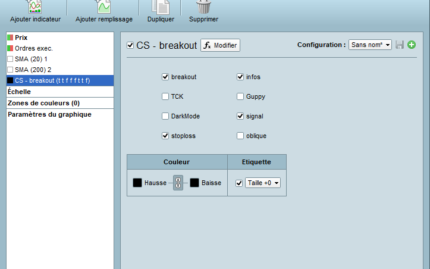
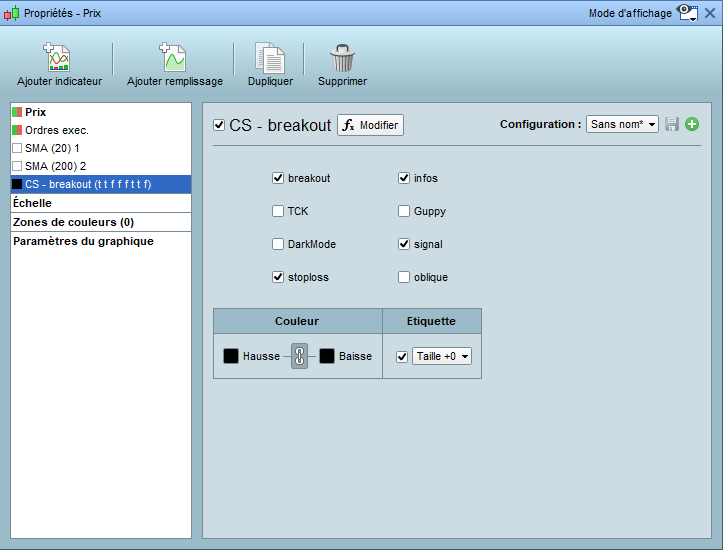
After the indicator installed in the price chart, there are options in the configuration page :
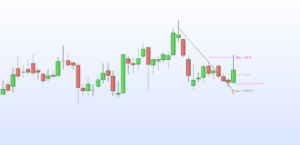
- breakout : view informations about breakout, horirontal resistance and bearish oblique resistance on the chart.
- infos : view inormations about volume, MA200 and MA20 in DAILY timeframe ( MA50 in WEEKLY timeframe).
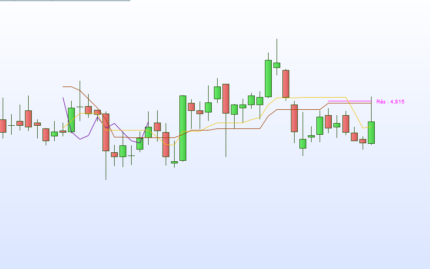
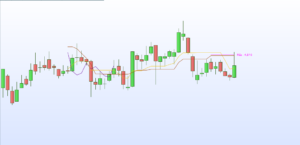
- TCK : view Tenkan, Kijun and Chikou on the last candles.
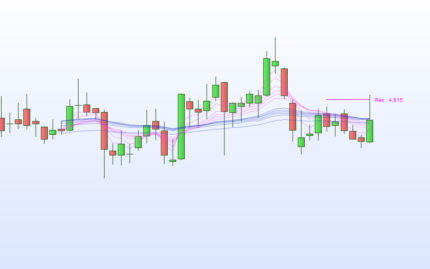
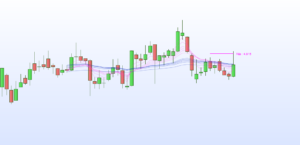
- Guppy : view Guppy on the last candles.
- DarkMode : view informations in white for those who have a dark Theme in PRT configuration.
- Signal : draw an arrow when there is a breakout.
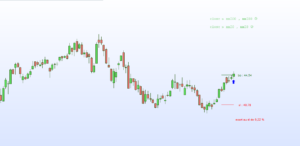
- stoploss : view a possible Stoploss if there is a breakout of the horizontal resistance.
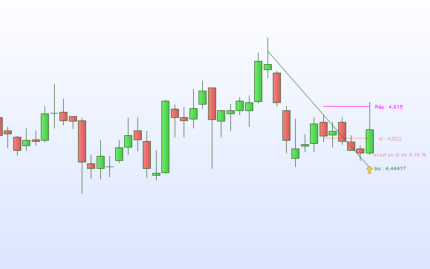
- oblique : draw the bearish oblique resistance if the algo finds one.
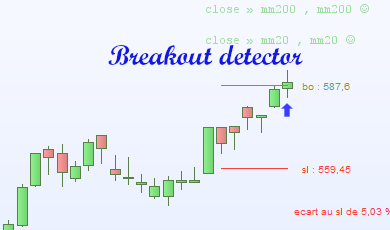
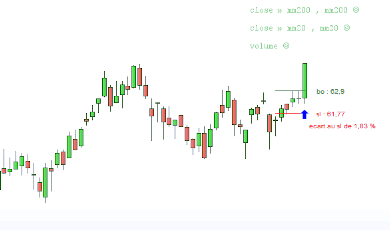
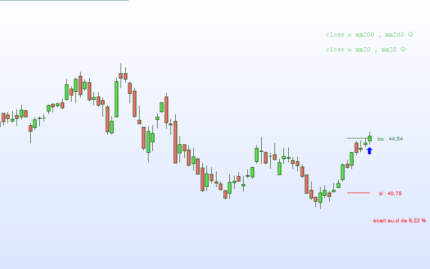
For the breakout, the algo indicates “bo” if the price is above the resistance or “rés” if the price is under.
If the price is above a horizontal resistance, the indicator give a possible Stoploss and the distance between the price and the stoploss.
The indicator draws 3 types of arrows :
- A yellow arrow means the price is over the bearish oblique resistance.
- A green arrow means the price is over a horizontal resistance. The oblique resistance is hide.
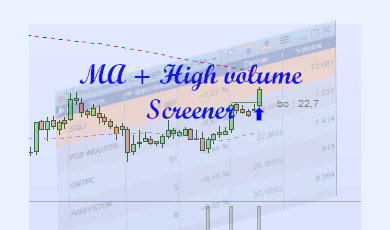
- A blue arrow means the price is over a horizontal resistance and there is volume for this breakout.
In the video below, you have an example of the use of the “Breakout detector” and “Trend intraday” indicators:
Advantages:
- a screener is available for detecting different breakout.
- the indicator can be used in many timeframes.


Reviews
There are no reviews yet.