

10 x Profit & Loss Option Master Strategiser Features:
Unlock the full potential of your trading strategy whilst tracking your open net Profit and Loss on up to 10 positions, while mastering key Greeks—Delta, Gamma, Theta, Vega, and Rho—along with cumulative Greek calculations for comprehensive risk analysis. Gain insights into each position’s Breakeven point, Cumulative Breakeven for multiple positions, and Expected Moves along with critical metrics like OTM (Out of the Money) probabilities.
Using the sophisticated Black-Scholes-Merton model (factoring in dividends) for precise option pricing you can stay ahead with a clear understanding of your Maximum Profit and Maximum Loss potential.
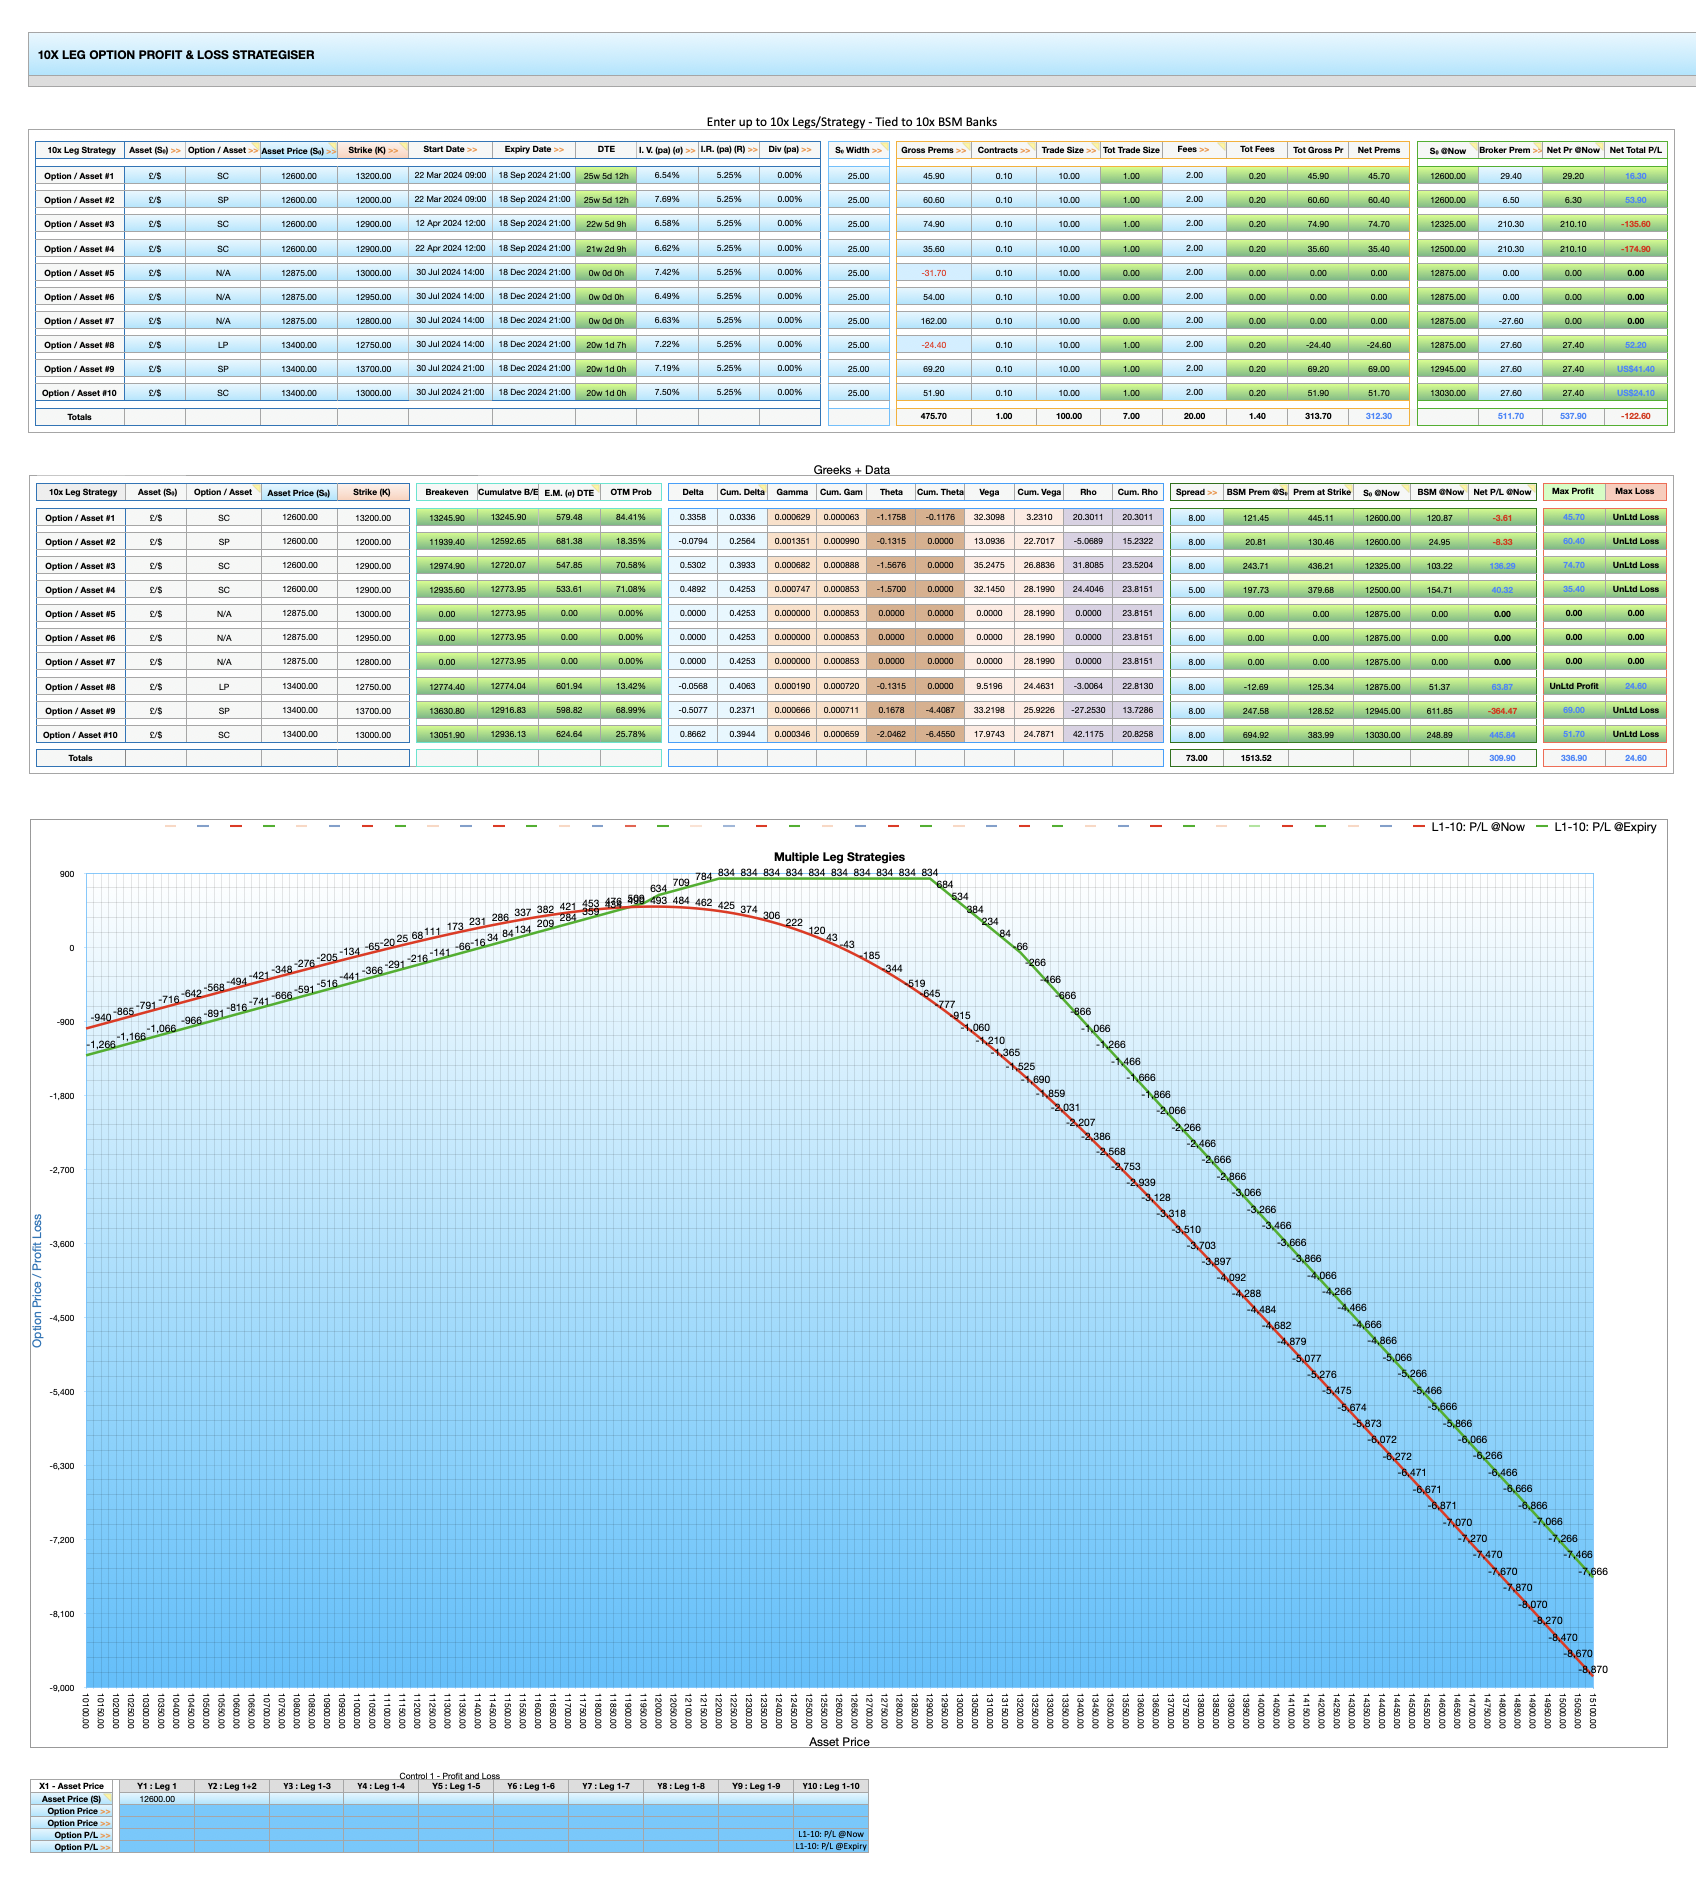
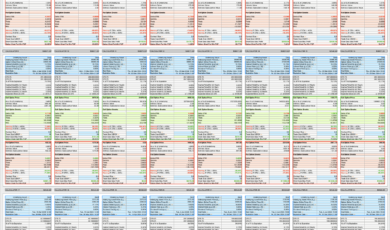
The top table allows for easy input of values like Strike, DTE, and I.V. in the blue fields. It then calculates the Premiums, Fees, and Profit & Loss results, displaying them in the green fields for easy reference.
The 10 x Profit & Loss Master Strategiser can handle up to 10 different option or underlying asset positions/legs. Despite the depth (in terms of rows in the spreadsheet), you actually only need to open the spreadsheet large enough to display the top two tables and lower blue chart to gain all the relevant info you need on your strategy. if you want a quick assessment of the Greeks you can scroll right to the green charts and display Greeks data as well.
Instructions / Explanation:
10x P&L Master Strategiser Features:
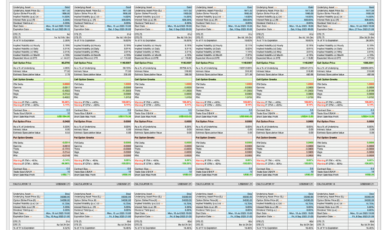
1. Simple yet Comprehensive Data Tables that display Premiums, Fees and the Profit and Loss, individually and cumulatively, along with the Greeks and other vital metrics for up to 10 open positions.
There are two tables. The top table accepts inputs such as Strike, DTE, I.V., etc. in the blue fields, and calculates the Premiums, Fees, and Profit & Loss results, which are displayed in the green fields.
Any changes to the Implied Volatility (I.V.) can be updated and the tables and charts will integrate the change as it will for any of the other normal BSM input (Underlying Asset Price, IR’s, DTE) adjustments. Note the Underlying Asset Price can be coded to provide the Yahoo Finance live prices too.
The lower table calculates the Greeks and BSM (with Dividends) Prices of the Options.
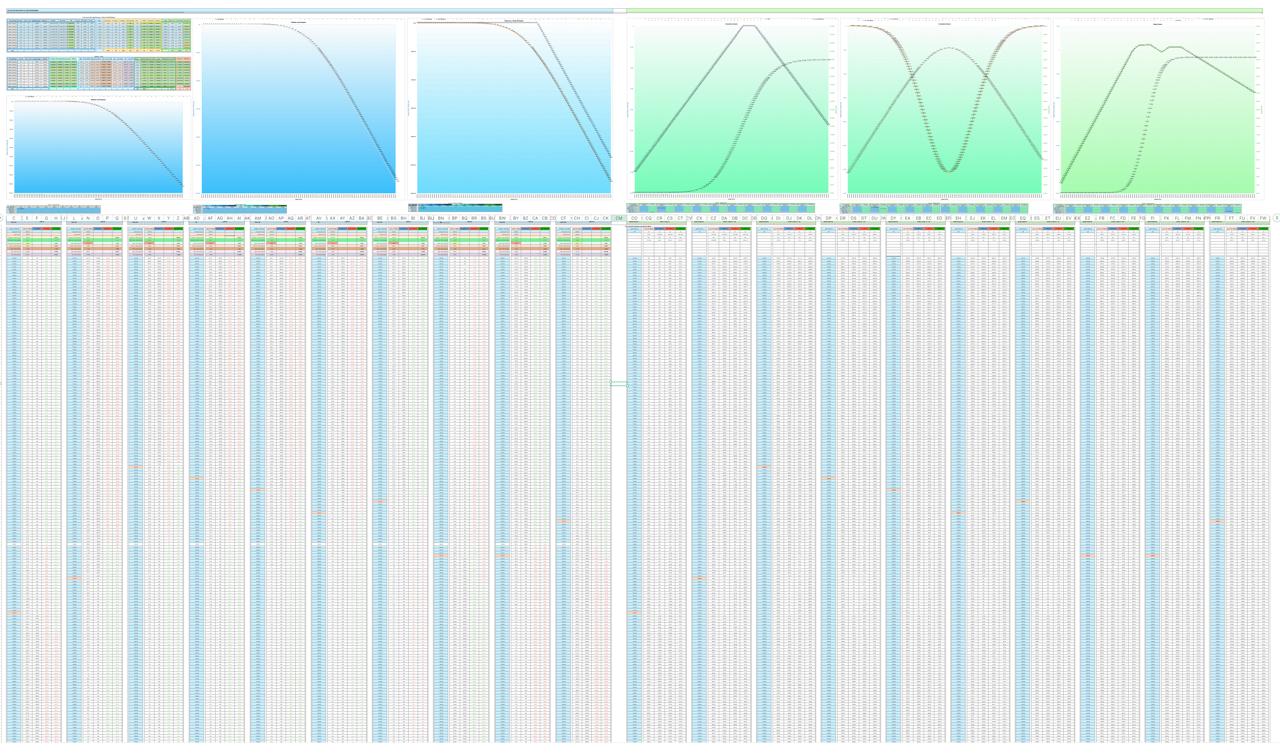
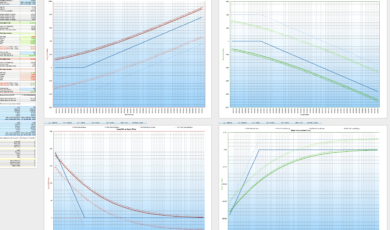
2. Comprehensive Large Charts for Real-Time Decision-Making:
The Master Strategiser displays Individual and/or Cumulative Underlying Asset or Option Prices (at the current moment and at expiry), along with Profit & Loss calculations (at the current moment and at expiry), against asset prices. This data is presented in the charts, covering:
• Options Price @Now
• Options Price @Expiry
• P/L @Now
• P/L @Expiry
for Long Calls, Short Calls, Long Puts and Short Puts.
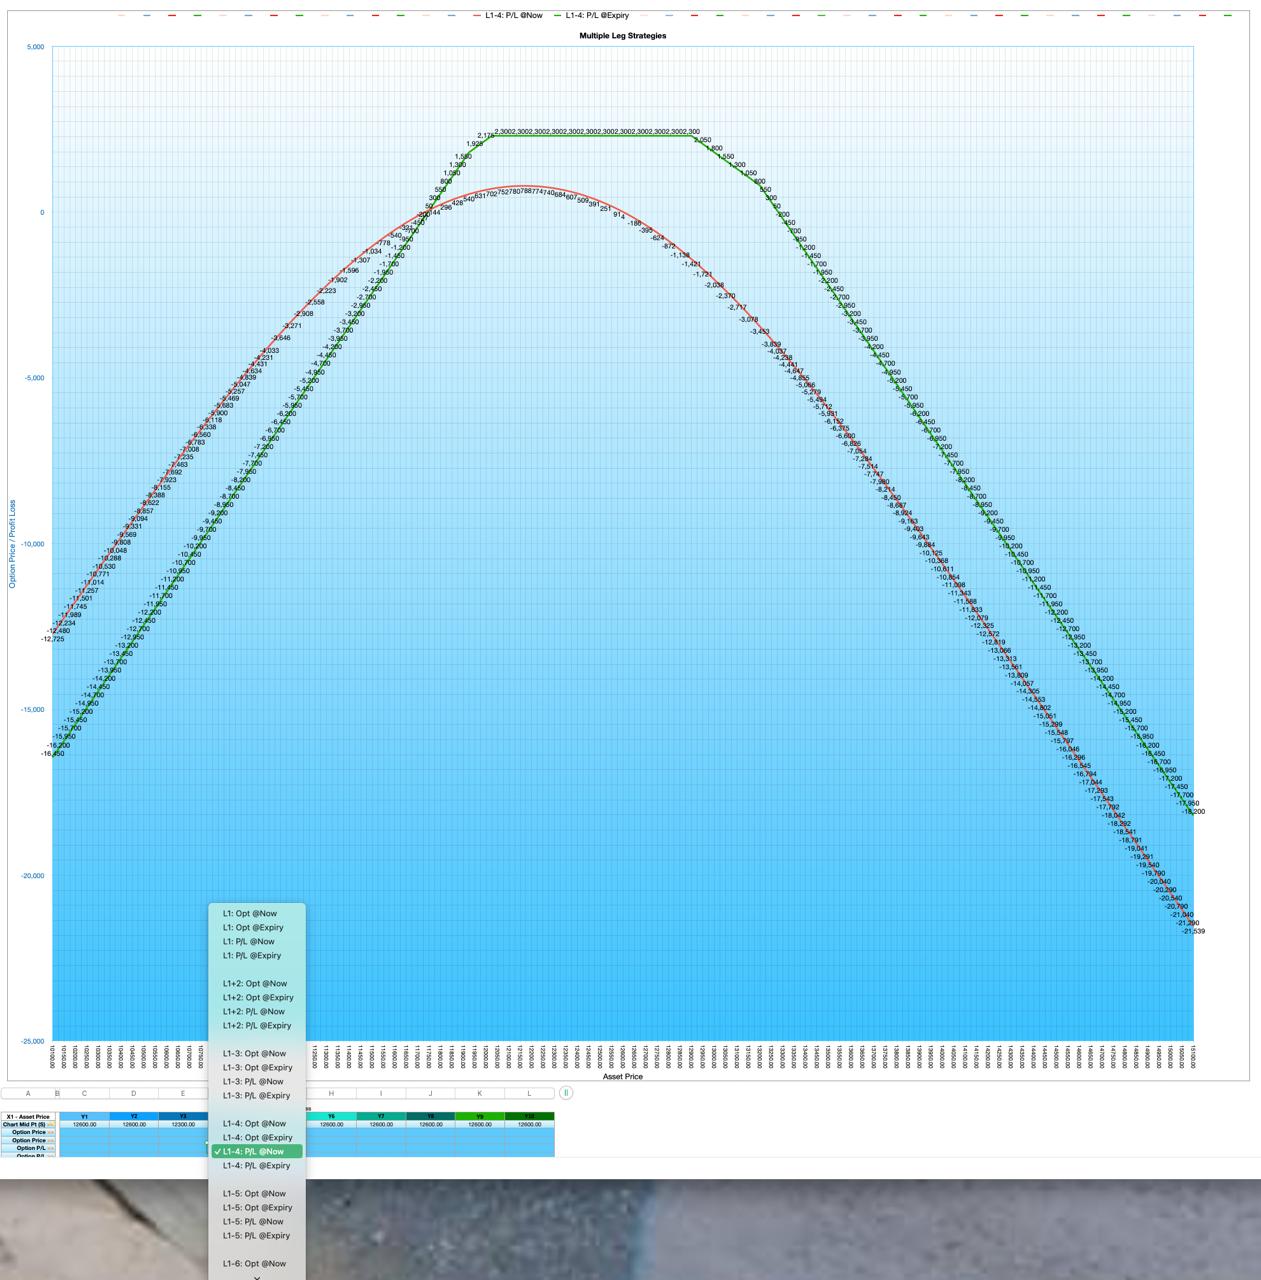
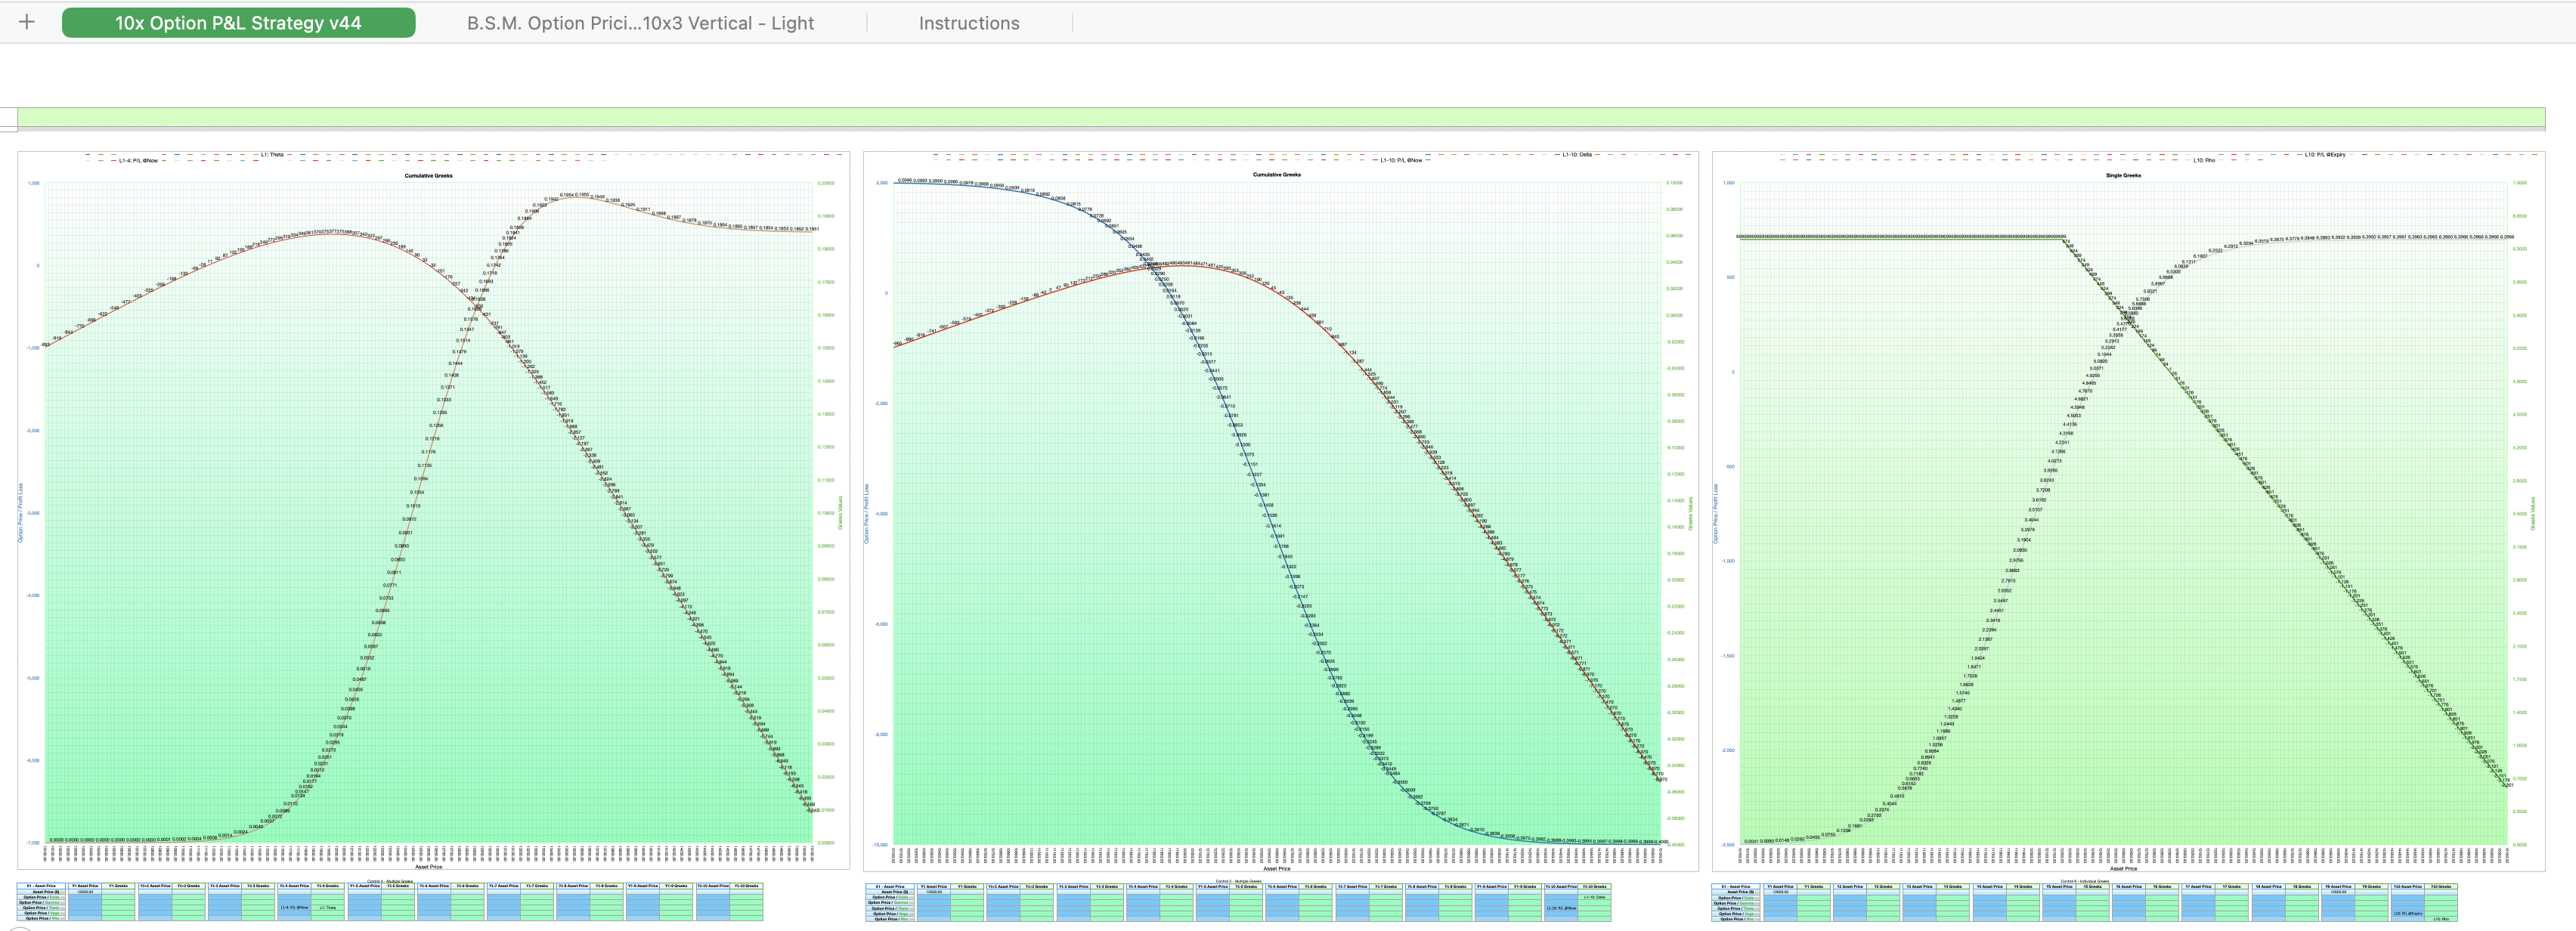
The 10 x Profit & Loss Master Strategiser features 6 individual charts plotting Long Call, Short Call, Long Put, and Short Put Prices (or eg an underlying asset if your’e hedging) against a wide range of Underling Asset Prices. There are 3x green Charts to plot the above as well as individual or cumulative position Greek Derivatives, comprising Delta, Gamma, Theta, Vega, and Rho, for each of these option types above.
The first 2 blue charts display Cumulative Option data (eg Legs 1 to 4 for an Iron Condor) and the third blue chart displays single option Legs. Ditto for the 3 green charts but with the added benefit of being able to plot the individual and cumulative Greeks data along with the option prices.
2 (i). Full Size Charts & Wide Asset Price Range:
My calculator accommodates a wide range of asset prices. Adjustable Automated Asset Width selection in the top table enables you to determine the full financial impact of a 50% market move on the Option Price @Now and @Expiry and on your Profit & Loss @Now and @Expiry and be forewarned of just how much risk you are taking on as a Short Seller.
. The Charts and accompanying Tables have been built specifically with a very wide width in Asset Prices.
Eg: With an Underlying Cable (£/$) Asset Price of 1,2600, and a setting with a 25-tick (adjustable) increment allows the calculator to work out option prices from just above the 1.5100 Strike down to the 1.01000 level, ensuring you’re prepared for various market scenarios.
Eg: Set the S&P 500 with a 25-tick (adjustable) increment and a strike price (K) of 4300. This configuration allows the calculator to calculate option prices all the way up to just below the 5575 Strike down to the 3200 level, effectively covering a potential 25% market decline. By adjusting the asset width to 50-point increments, the calculator can accommodate asset prices from 2100 to 6800, ensuring comprehensive coverage in option pricing even for a 50% market crash.
2 (ii). Chart Controllers:
Chart Controllers allow for the simple quick selection and plotting of any metric whether the underlying asset, an option, or a Greek derivative with 6 Charts.
3. Live @Now Pricing — Option Start Date cells can be set to live “@Now” to enable real-time monitoring of Call and Put Option Price changes in real time. (Computer CPU power dependent). Modify implied volatility (I.V.) and other variables, and witness the tables and charts adapt seamlessly.
4. Versatility in Option Pricing:
Check if your Broker is Under and/or Over Pricing Options. My calculator provides precise Option pricing to 2 decimal places. This accuracy helps you identify any discrepancies in your broker’s pricing, ensuring you get the best deal.
5. Implied Volatility Market Move Projections:
Gain insights into Market Moves with Implied Volatility projections for MInute, Hourly, Daily, Weekly and Monthly timeframes.
6. Expected Move:
Determine the Expected Market Move in points for your chosen time frame, down to the minute. Plan with confidence.
7. POP Calculations, Probability of Profit:
Know your odds of success with individual Short Call and Short Put probability calculations for your selected time frame, even down to the last minutes before expiry.
8. Greek Targeting:
Select Strike prices according to the likelihood of success based on Delta probabilities.
9. 0 DTE Calculations:
My calculator is capable of calculating option premiums for “0 days to expiry” (ODTE) right down to the last minutes before they expire.
10. Embrace Precision, Control Risk:
As markets become increasingly volatile the 10x Options P&L Master Strategiser is designed to help you navigate and anticipate Black Swan events, especially as a Short Seller. For instance, in the wake of unforeseen market shocks, like the 6-cent drop in Cable (£/$) following a political announcement, my Master Strategiser provides essential insights equivalent to a 500-point move. Take control of your market risk. In Option terms, this was equivalent of an explosive 500 point move and that was for the far dated contract.
Don’t let market uncertainties catch you off guard.
Take Control of Your Market Risk Now by Downloading my 10x Option P&L Master Strategiser.
Best of Luck in Your Options Trading,
Ian
B.Sc. Finance (Hons)
Reviews
There are no reviews yet.