
 INSTALACIÓN
PriceVision – NASDAQ 1D
Automated trading strategy for US Tech 100 Cash on IG / ProRealTime.
Based on a proprietary dynamic price-level model, working on the Daily timeframe.
Entries are made through pending STOP orders placed at calculated price levels. The strategy works Long & Short with a Stop & Reverse logic and only one position at a time.
Informations
- Instrument: US Tech 100 Cash
- Timeframe: Daily
- Trade direction: Long & Short
- Order type: Pending STOP orders
- Position management: Stop & Reverse
- Maximum simultaneous positions: 1
- Stop Loss: None
- Minimum position size: 0.04
- Minimum capital: Calculated dynamically with the included “Minimum Capital” indicator
- Platform: IG / ProRealTime – ProOrder
- Historical backtest: 03/02/1986 – 21/08/2026
- Backtest starting capital: €1,000
Strategy description
PriceVision is based directly on price behaviour, without requiring a large combination of conventional technical indicators.
At each new Daily bar, the algorithm uses completed OHLC price data to calculate an internal central reference price.
This reference is then processed through a proprietary mathematical transformation, from which the strategy derives two dynamic execution levels:
- one level for a potential Long entry;
- one level for a potential Short entry.
The strategy does not enter immediately at market.
Instead, it places a BUY STOP or SELL STOP at the calculated level, according to the current logical conditions.
The trade is activated only if price actually reaches the corresponding trigger.
The system continuously recalculates these levels and works with a Stop & Reverse approach: when the opposite configuration becomes valid and its trigger level is reached, the strategy changes direction.
The complete process can be summarized as:
OHLC data → central price → proprietary transformation → dynamic STOP levels → Long/Short conditions → Stop & Reverse execution
The exact mathematical transformation and internal logical conditions are proprietary and protected.
The user does not need to optimise or modify the internal model: the strategy is supplied with the required configuration and is designed to be used as provided.
No Stop Loss
An important characteristic of PriceVision is that the historical results shown below were obtained without using any Stop Loss.
No fixed, volatility-based or trailing Stop Loss has been added to improve the backtest statistics.
The results therefore reflect the strategy’s original entries and exits.
Positions are opened at the proprietary STOP trigger levels and are closed or reversed according to the strategy’s own logic.
Consequently, the reported Net Profit, Profit Factor and Maximum Drawdown are generated by the original trading logic itself, rather than by an externally optimised Stop Loss.
Results
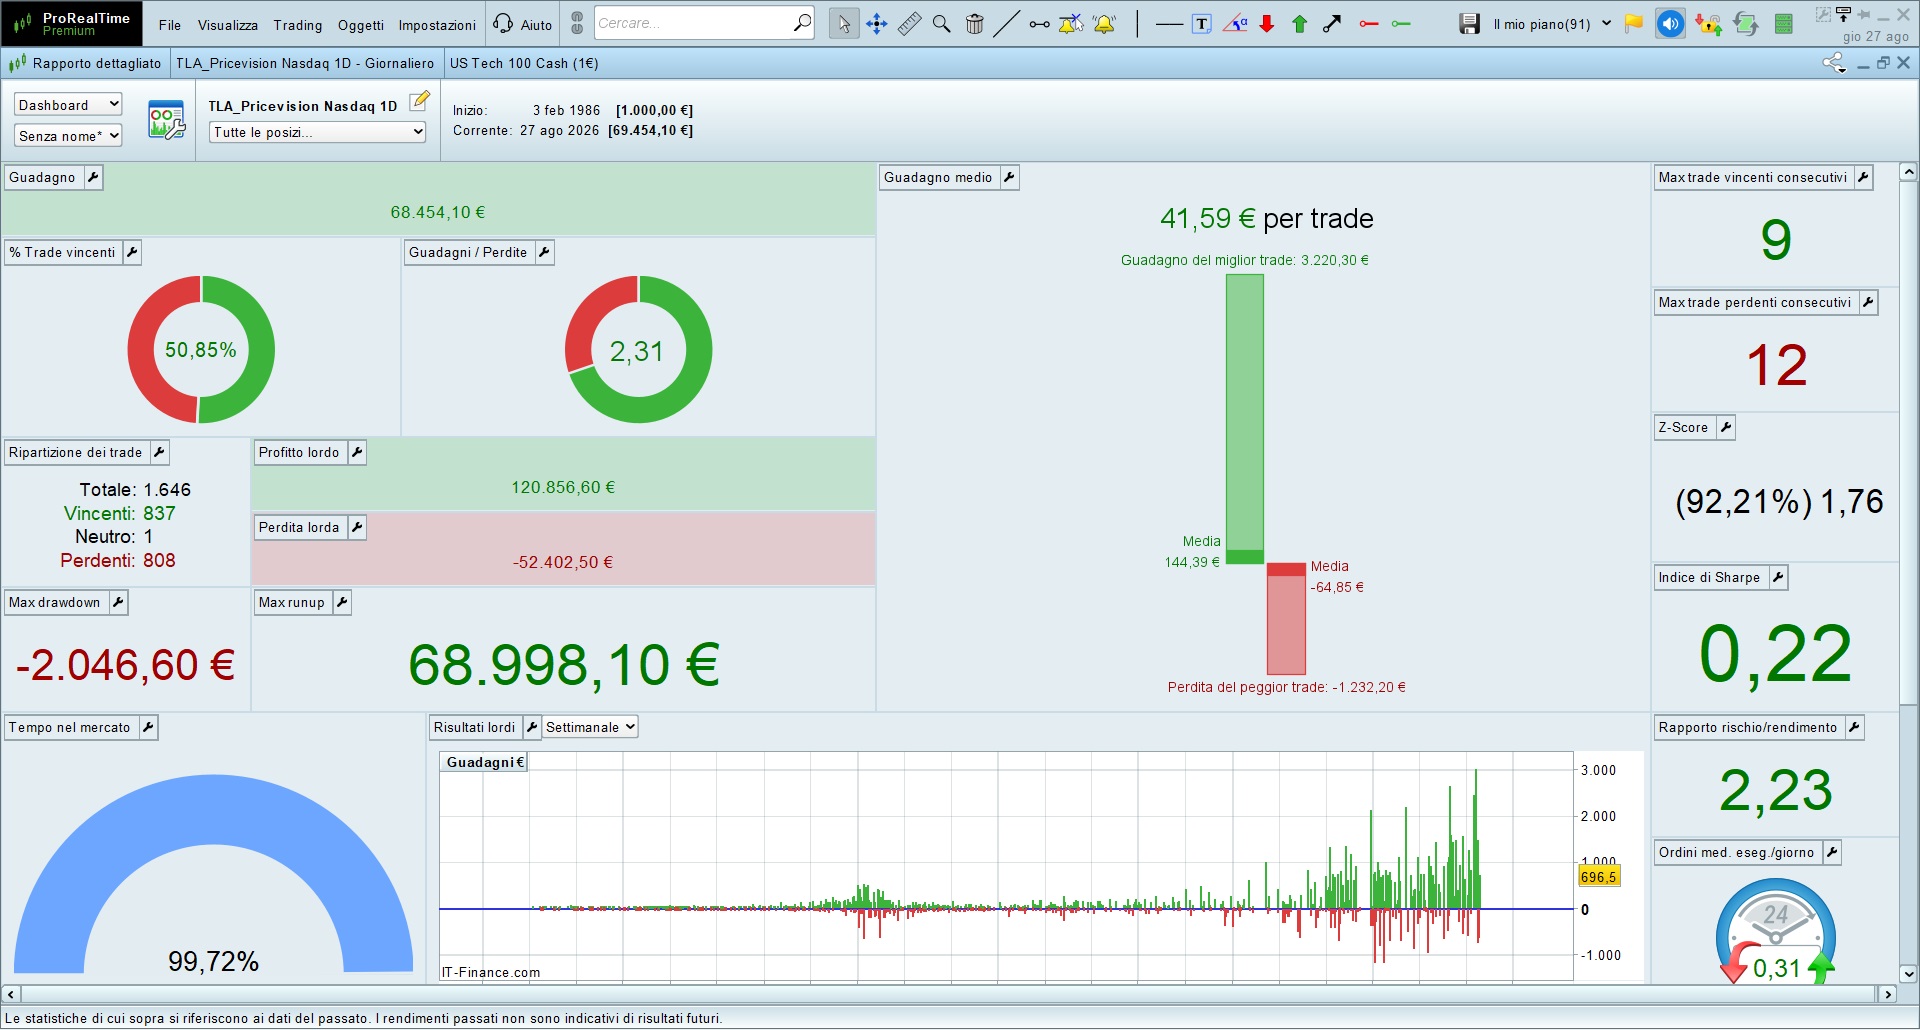
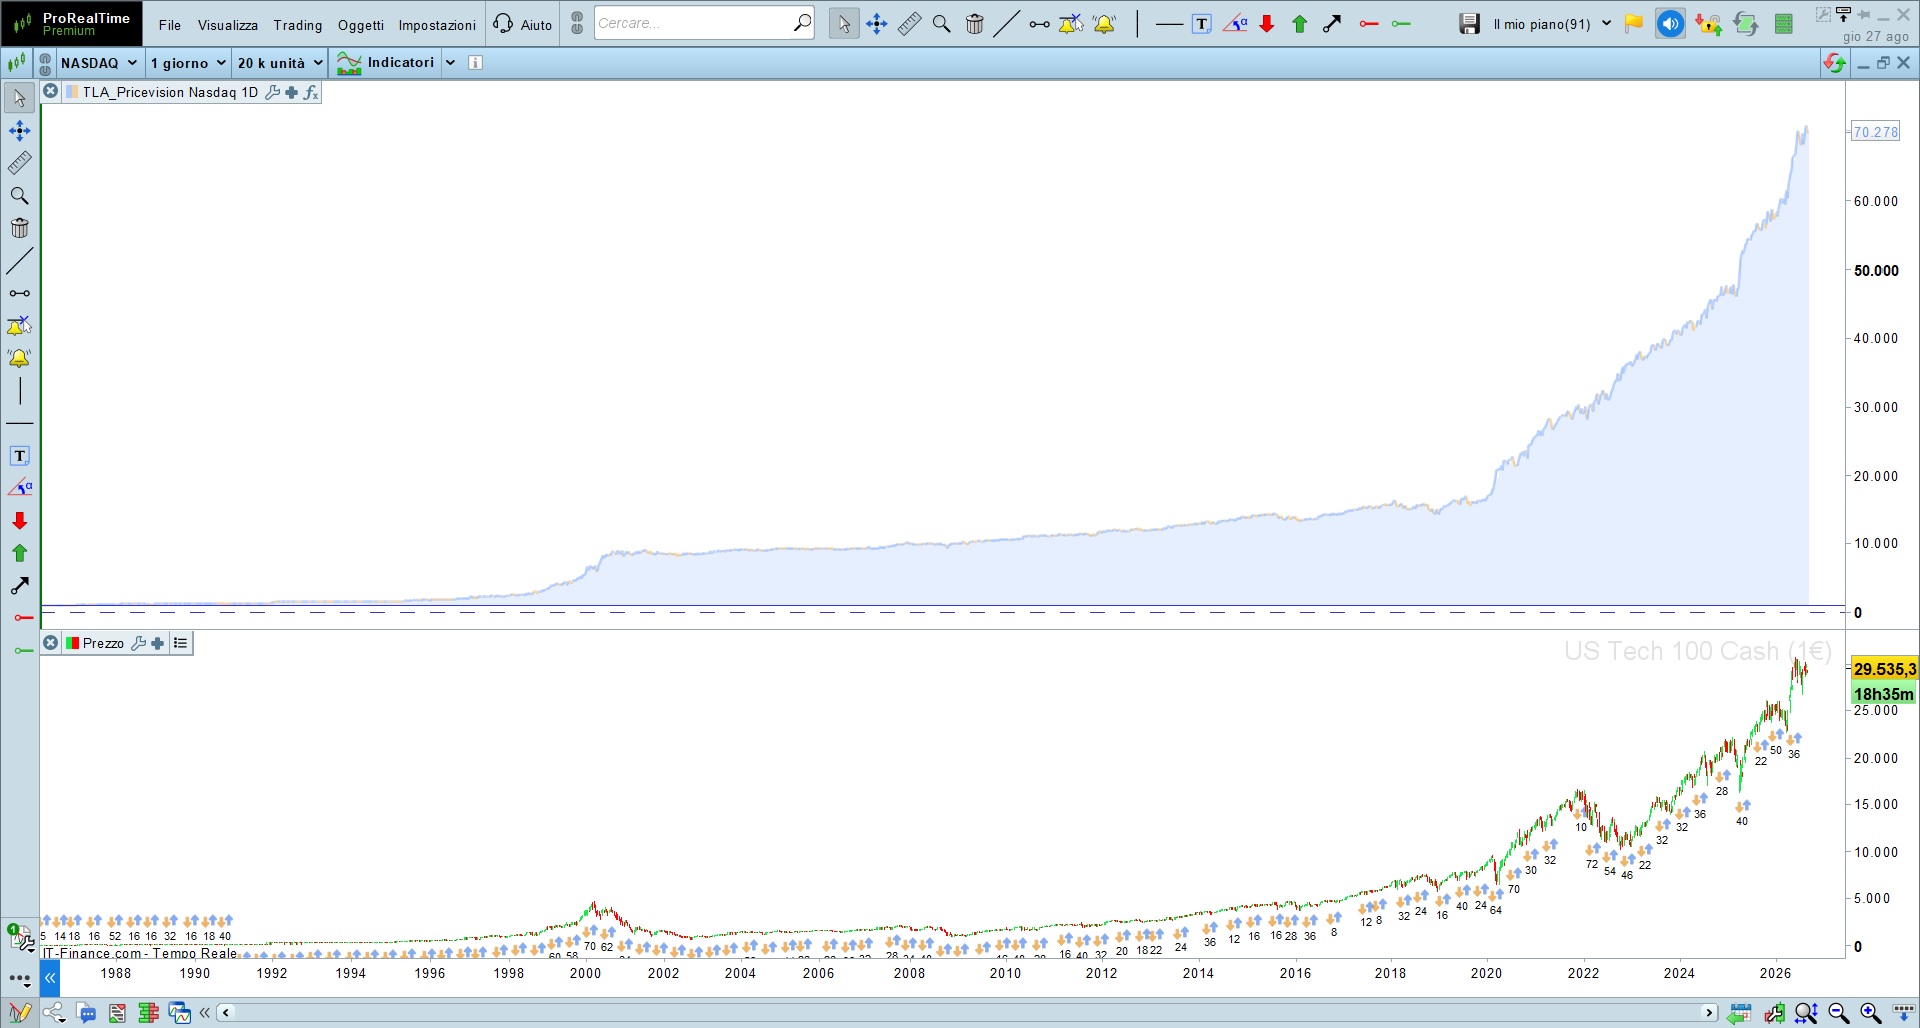
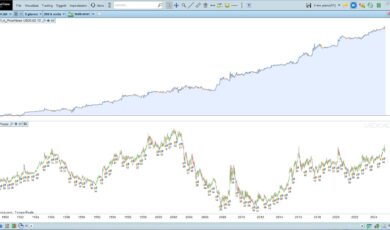
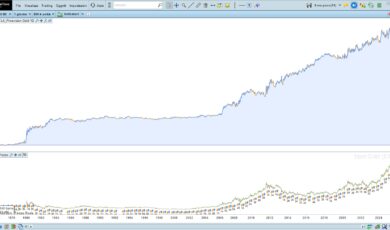
Historical results are based on US Tech 100 Cash, Daily timeframe, without reinvesting profits and without a Stop Loss.
Backtest period: 03/02/1986 – 21/08/2026
The strategy was tested over more than 40 years of NASDAQ history, including the Dot-Com cycle, the 2008 financial crisis, the COVID crash, the 2022 bear market and the recent technology expansion.
Main historical statistics
- Net Profit: €68,454.10
- Maximum Drawdown: €2,046.60
- Net Profit / Max Drawdown: 33.45
- Profit Factor: 2.31
- Total trades: 1,646
- Winning trades: 837
- Losing trades: 808
- Win rate: 50.85%
- Average profit per trade: €41.59
- Average winning trade: €144.39
- Average losing trade: €64.85
- Best trade: €3,220.30
- Worst trade: -€1,232.20
- Risk / Reward ratio: 2.23
- Maximum consecutive winners: 9
- Maximum consecutive losers: 12
One of the main characteristics of the historical test is the relationship between profitability and drawdown:
Net Profit / Maximum Drawdown = 33.45
With €68,454.10 of historical net profit and a €2,046.60 maximum historical drawdown, the strategy generated approximately:
€33.45 of cumulative historical profit for every €1 of maximum drawdown
Importantly, this result was achieved without using a Stop Loss to modify the natural behaviour of the strategy.
The historical drawdown therefore reflects the original sequence of PriceVision entries, exits and Stop & Reverse operations.
The strategy does not rely on an exceptionally high win rate. Winning and losing trades are almost equally distributed, but the average winning trade (€144.39) is more than twice the average losing trade (€64.85).
This produces a historical Profit Factor of 2.31 and Risk / Reward ratio of 2.23.
Minimum Capital
PriceVision includes a simple Minimum Capital indicator designed to help the user estimate the initial capital required for the selected position size.
The calculation is based on the highest price reached in the available historical series.
The capital model combines:
- a historical drawdown allowance equal to approximately 12% of the historical maximum price;
- an estimated margin allowance equal to 5% of the historical maximum price.
Therefore:
Minimum Capital = Historical Maximum Price × 0.17 × Position Size
The value automatically increases if NASDAQ reaches a new historical high.
This avoids publishing a fixed minimum-capital figure that could become obsolete as the nominal value of the index increases.
Minimum Capital indicator
minimumcapital = (Highest[barindex](high) * 0.17) * lotti

RETURN minimumcapital AS "MinCapital"
Before activating PriceVision, the user can load the Minimum Capital indicator on the same NASDAQ Daily chart and set lotti equal to the position size that will be used by the strategy.
For the minimum tradable position:
lotti = 0.04
the indicator automatically calculates the corresponding estimated minimum capital.
The displayed MinCapital value should be considered a historical risk estimate, not a guaranteed protection against future losses or margin calls.
Long-term behaviour
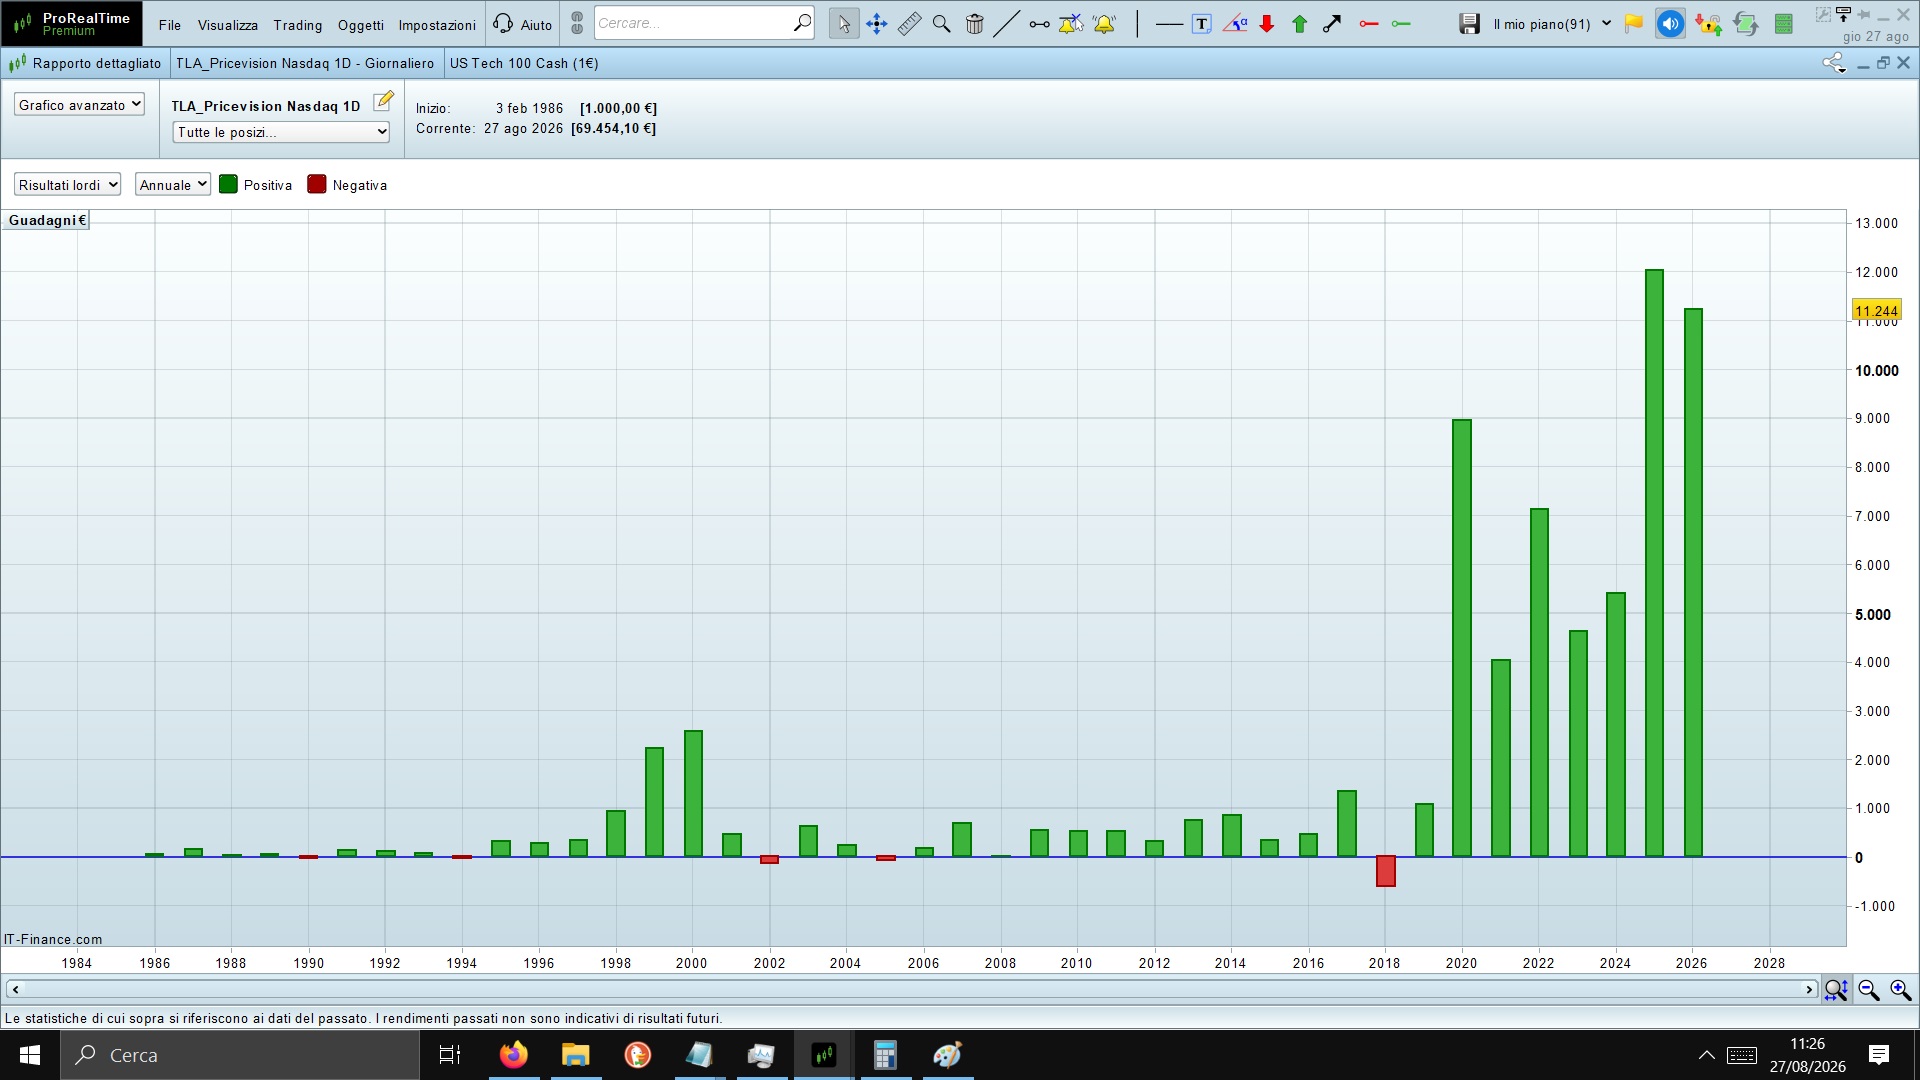
The annual report shows that performance is not distributed equally every year.
Some periods are relatively quiet, while stronger NASDAQ price movements can generate significantly larger profits.
This is a long-term systematic strategy, not a system designed to produce identical returns every month.
The purpose of the long historical backtest is to evaluate the same core algorithm across bullish, bearish, high-volatility and lower-volatility market environments.
Automation
PriceVision runs automatically through ProOrder.
Once activated, the system manages:
- calculation of the proprietary price levels;
- Long and Short conditions;
- pending STOP orders;
- trade execution;
- original exit logic;
- Stop & Reverse direction changes.
There is no additional Stop Loss logic modifying the historical entry/exit sequence.
No discretionary intervention is required for normal operation, and the proprietary internal calculation remains protected.
Disclaimer
The results presented are based on a historical ProRealTime backtest.
Past performance is not a guarantee of future results.
Future market conditions may differ significantly from those observed historically, and future drawdowns may exceed the maximum drawdown shown in the backtest.
The 12% historical drawdown allowance used in the Minimum Capital calculation is derived from historical behaviour and does not represent a guaranteed maximum future drawdown.
The absence of a Stop Loss means that adverse price movements can remain open until the strategy’s own exit or reversal condition occurs.
Margin requirements may also change depending on broker conditions and market volatility.
Real trading results may differ because of spread, slippage, liquidity, market gaps, execution conditions and broker-specific factors.
CFDs are leveraged financial instruments and involve a significant risk of loss.
Users understand and accept that they use the trading system under their own responsibility.


Valoraciones
No hay valoraciones aún.