

 SCHNELLE &
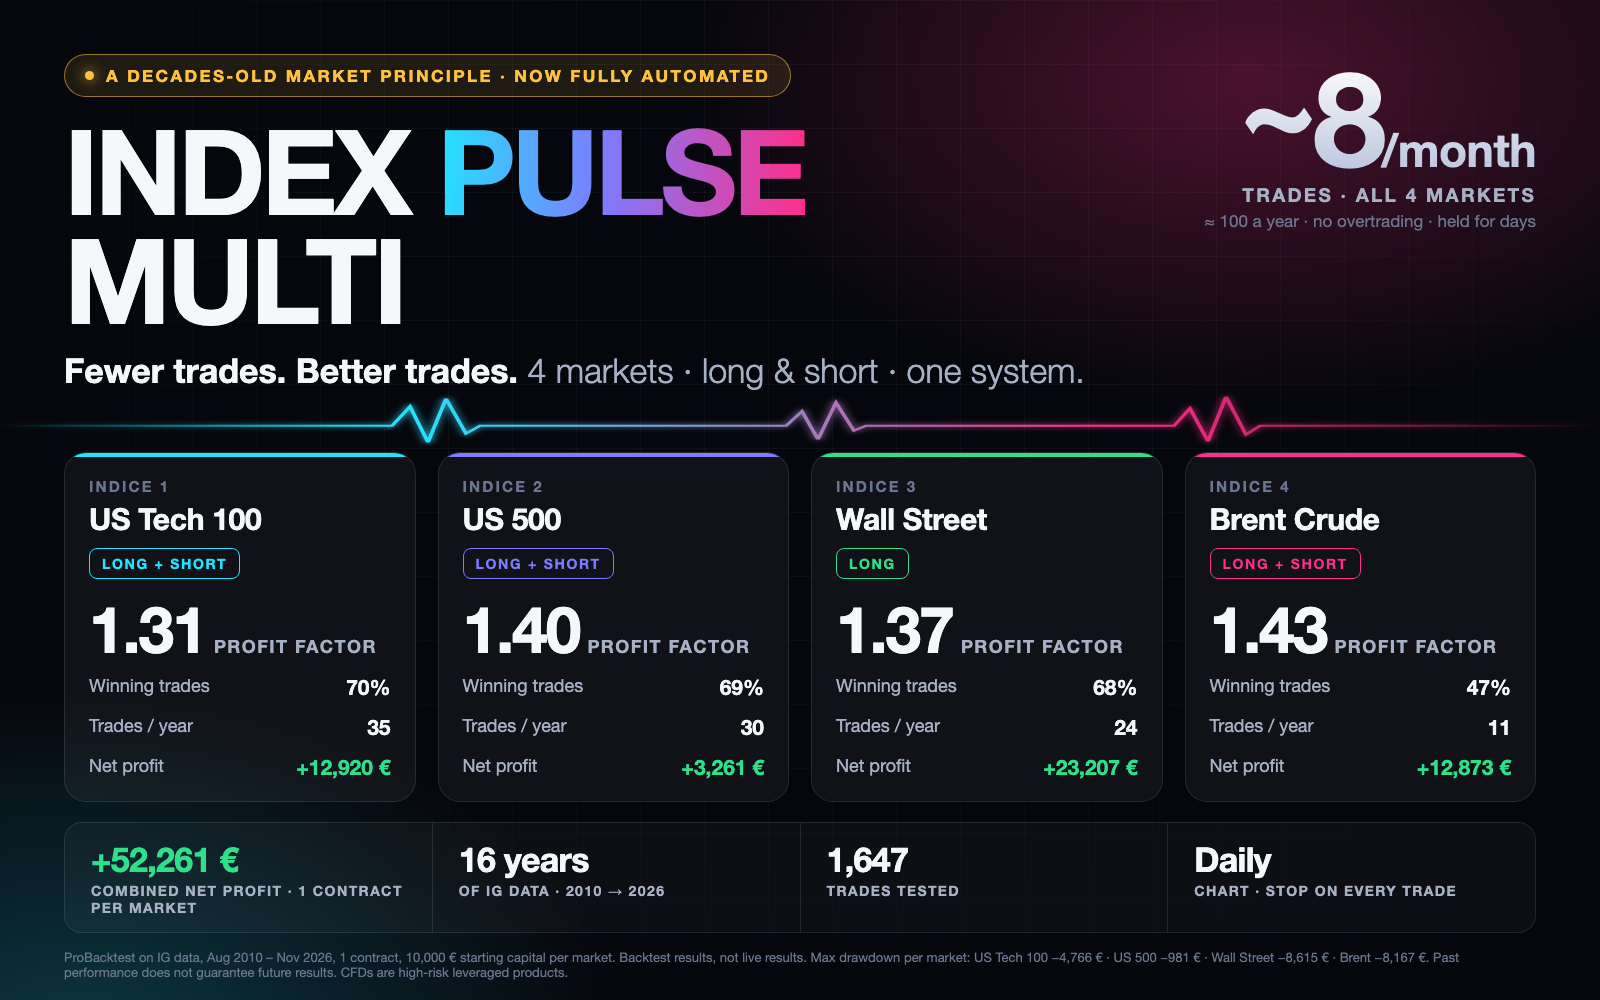
Fewer trades. Better trades.
INDEX PULSE MULTI is not a scalper. It does not trade every day, and that is by design.
It waits for a specific market condition, enters, and usually exits within a few days. On each market it takes roughly 10 to 35 trades a year (about 100 a year across the four markets). Run it on several markets and you will see activity most weeks.
It is built on a classic market principle that discretionary traders have used for decades. We turned it into strict, fully automated rules and tested them on 16 years of IG data, through the 2011 debt crisis, the 2015 and 2018 sell-offs, the 2020 crash, the 2022 bear market and the 2025 volatility.
What it does on each market
| INDICE | Market (IG, daily chart) | Direction | How it trades |
|---|---|---|---|
| 1 | US Tech 100 (Nasdaq) | Long + short | Buys pullbacks; sells short only in bear markets |
| 2 | US 500 (S&P 500) | Long + short | Buys pullbacks; sells short only in bear markets |
| 3 | Wall Street (Dow Jones) | Long | Buys pullbacks |
| 4 | Brent Crude | Long + short | Follows breakouts in both directions |
Two engines, one system. On the three stock indices it uses a pullback engine; on Brent it uses a breakout engine. You install one file and choose the market with INDICE.
On stock indices, short trades are rare on purpose. Indices rise over time, so the system only sells short in clearly falling markets. On Brent, long and short trades are roughly half and half.
Every trade has a protective stop from the moment it opens.
Results (ProBacktest, IG data, 1 contract, Aug 2010 → Nov 2026)
| Market | Trades | Winning trades | Profit factor | Net profit | Max drawdown |
|---|---|---|---|---|---|
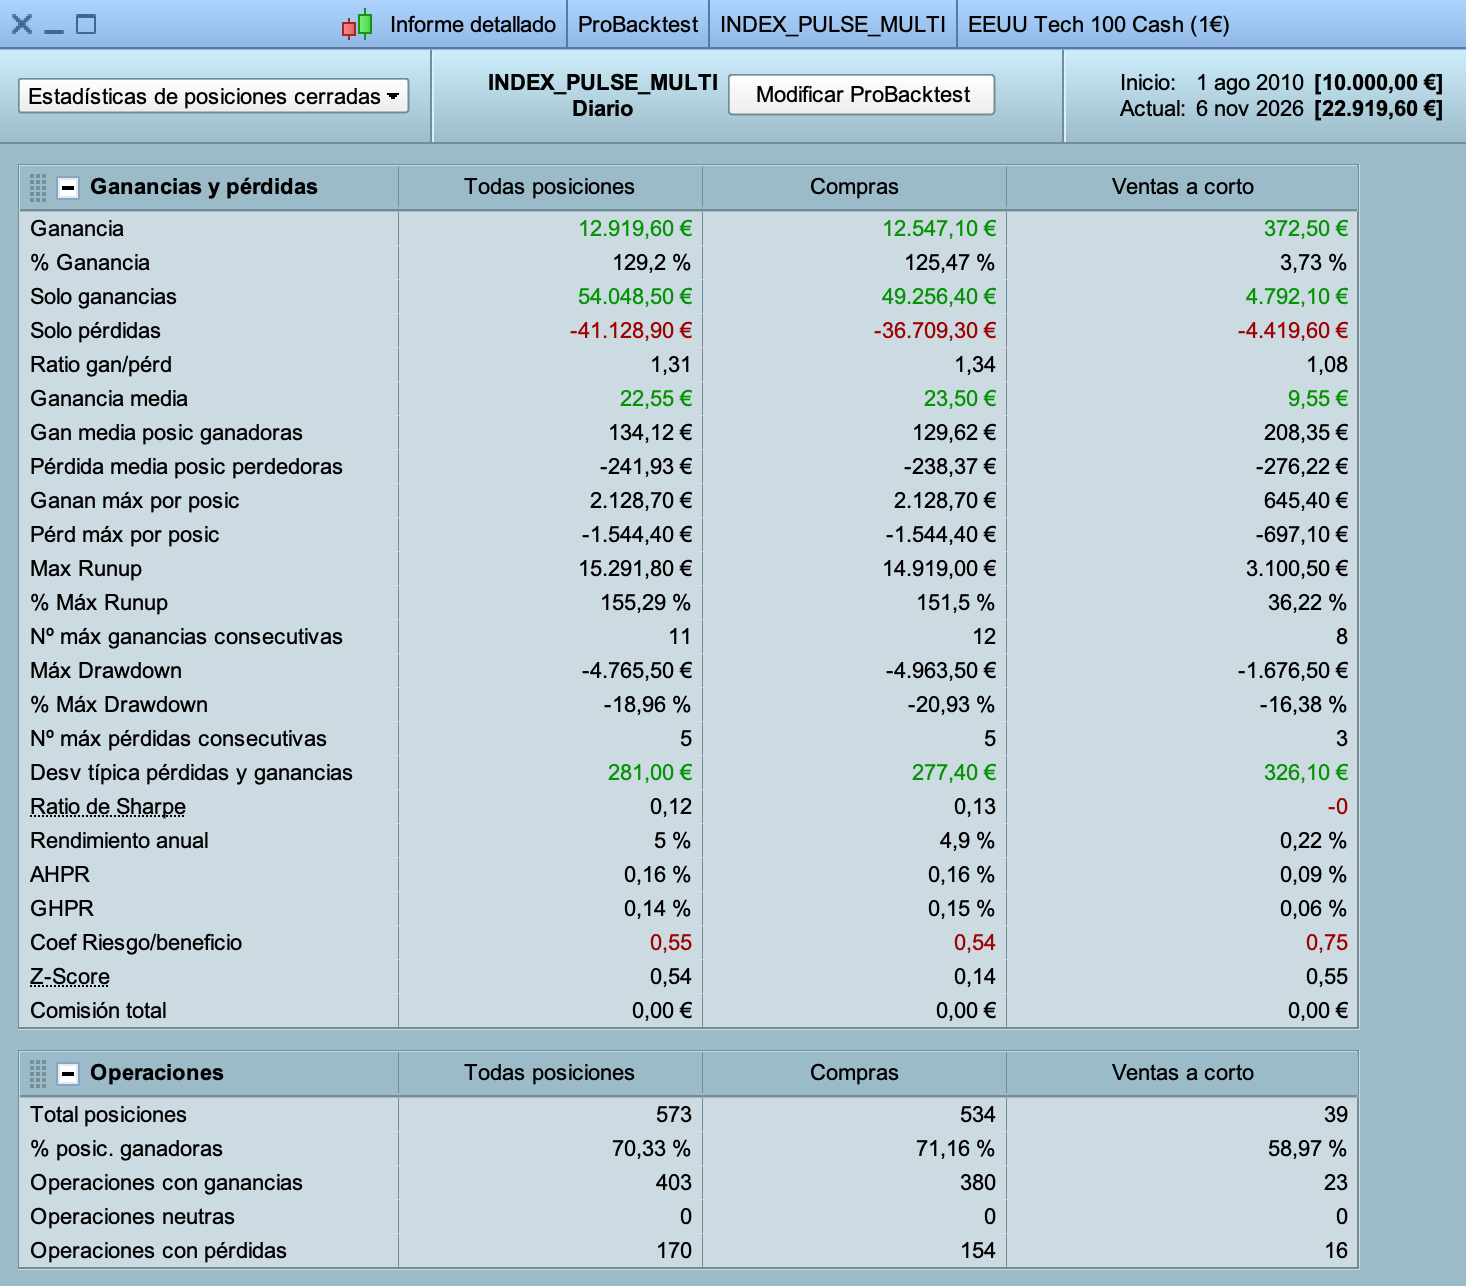
| US Tech 100 | 573 (534 long · 39 short) | 70.3% | 1.31 | +12,920 € | −4,766 € |
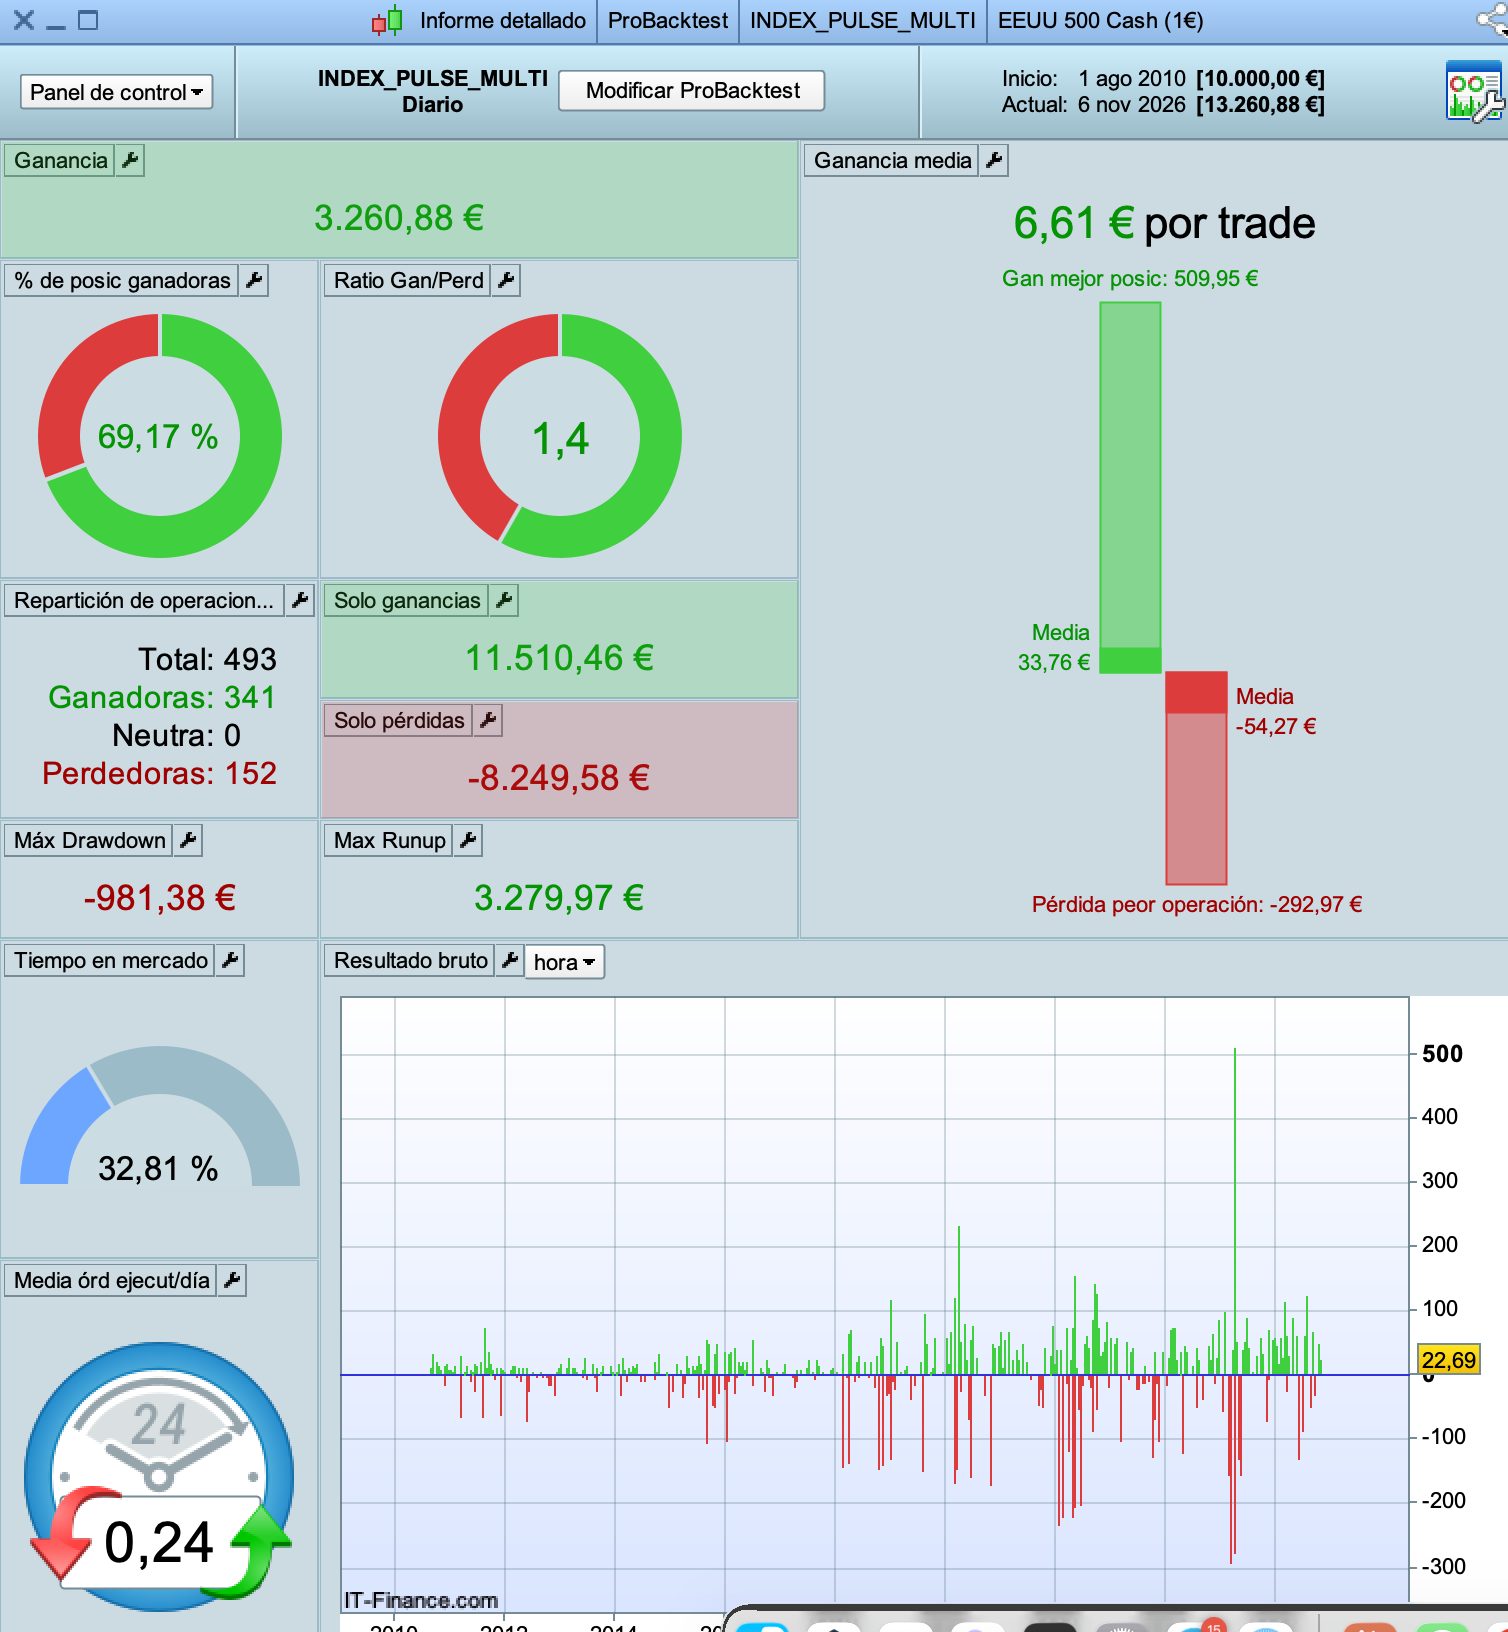
| US 500 | 493 | 69.2% | 1.40 | +3,261 € | −981 € |
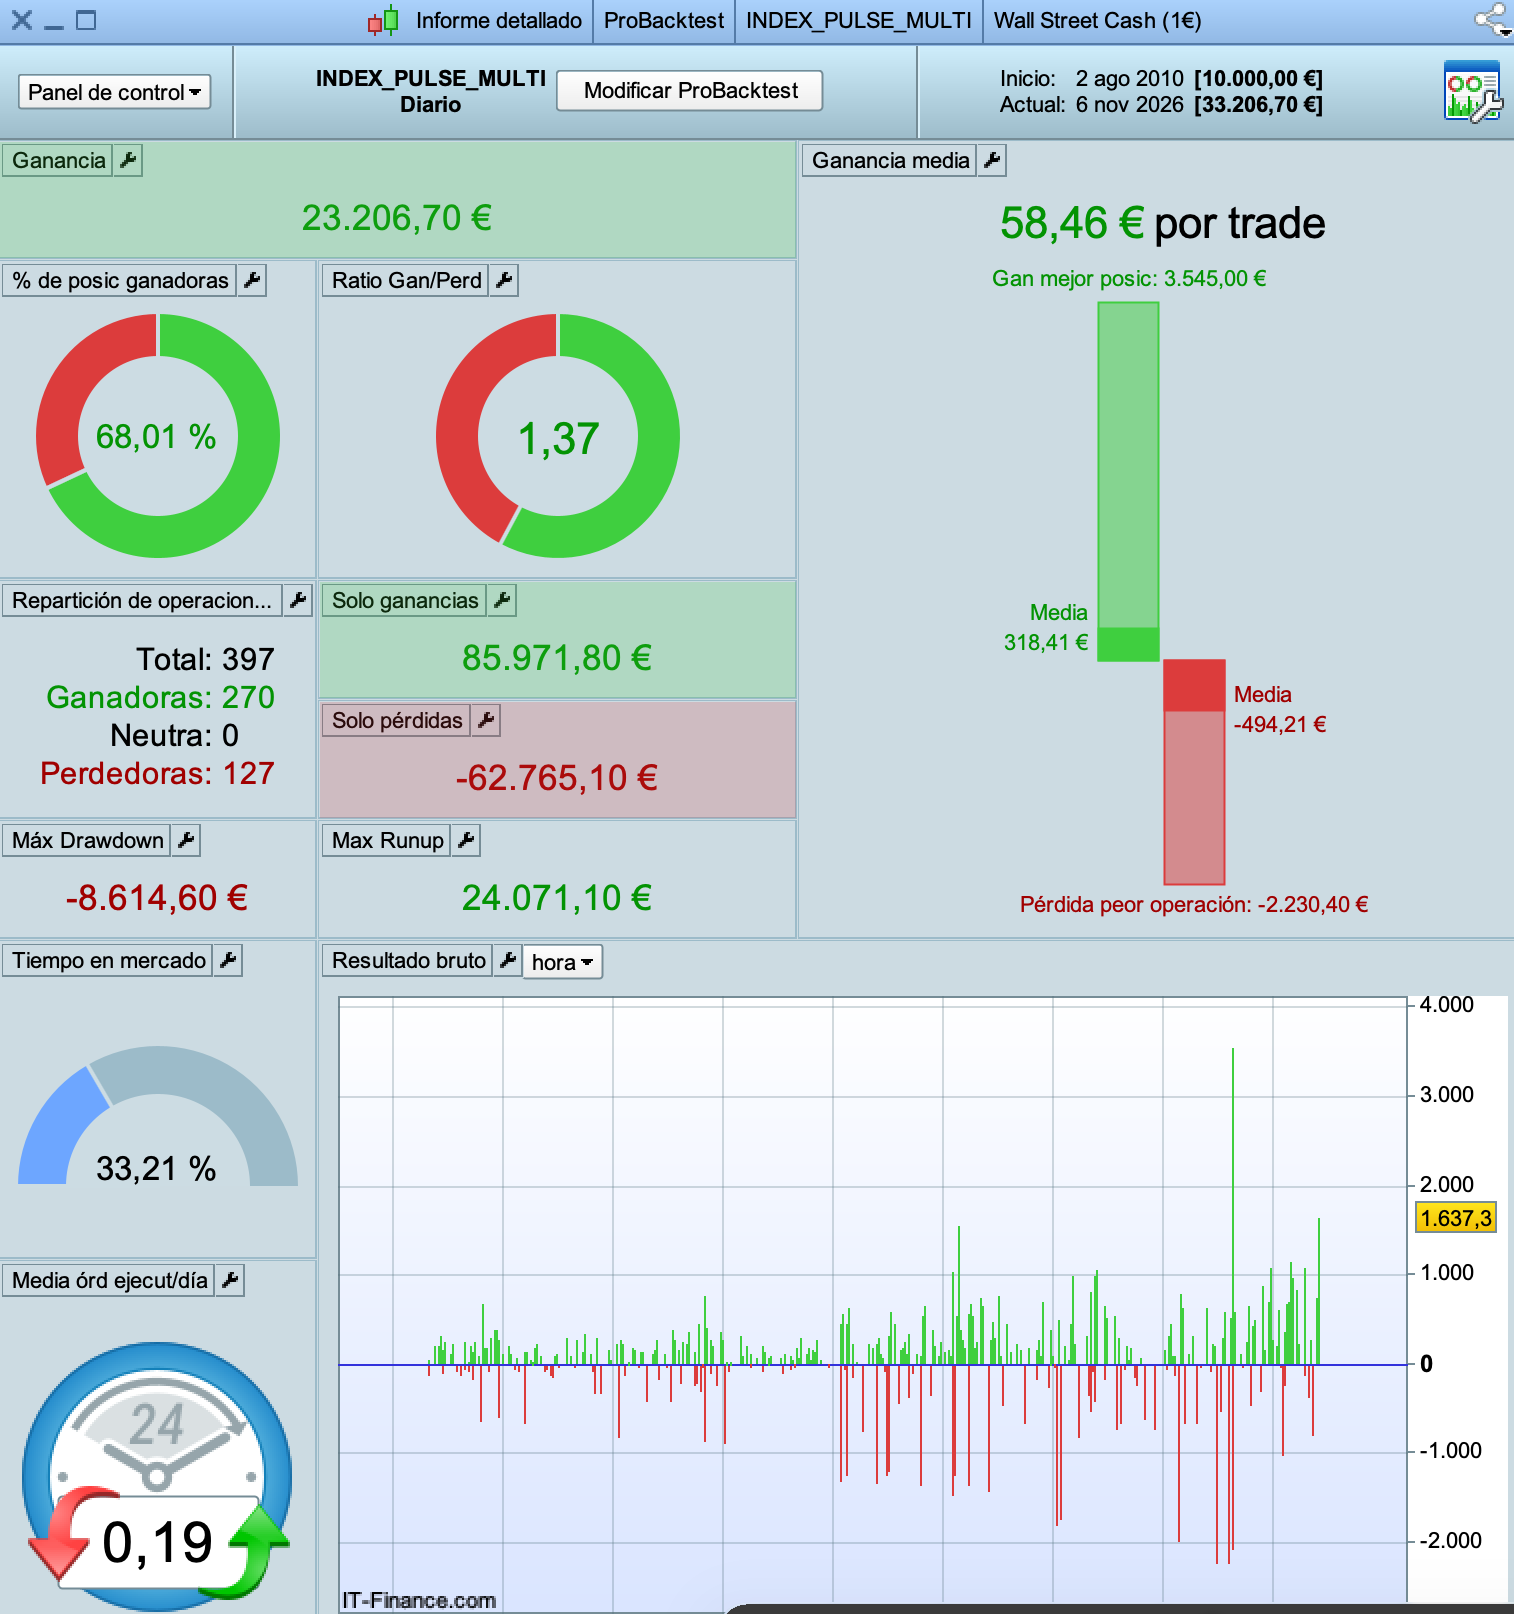
| Wall Street | 397 (long) | 68.0% | 1.37 | +23,207 € | −8,615 € |
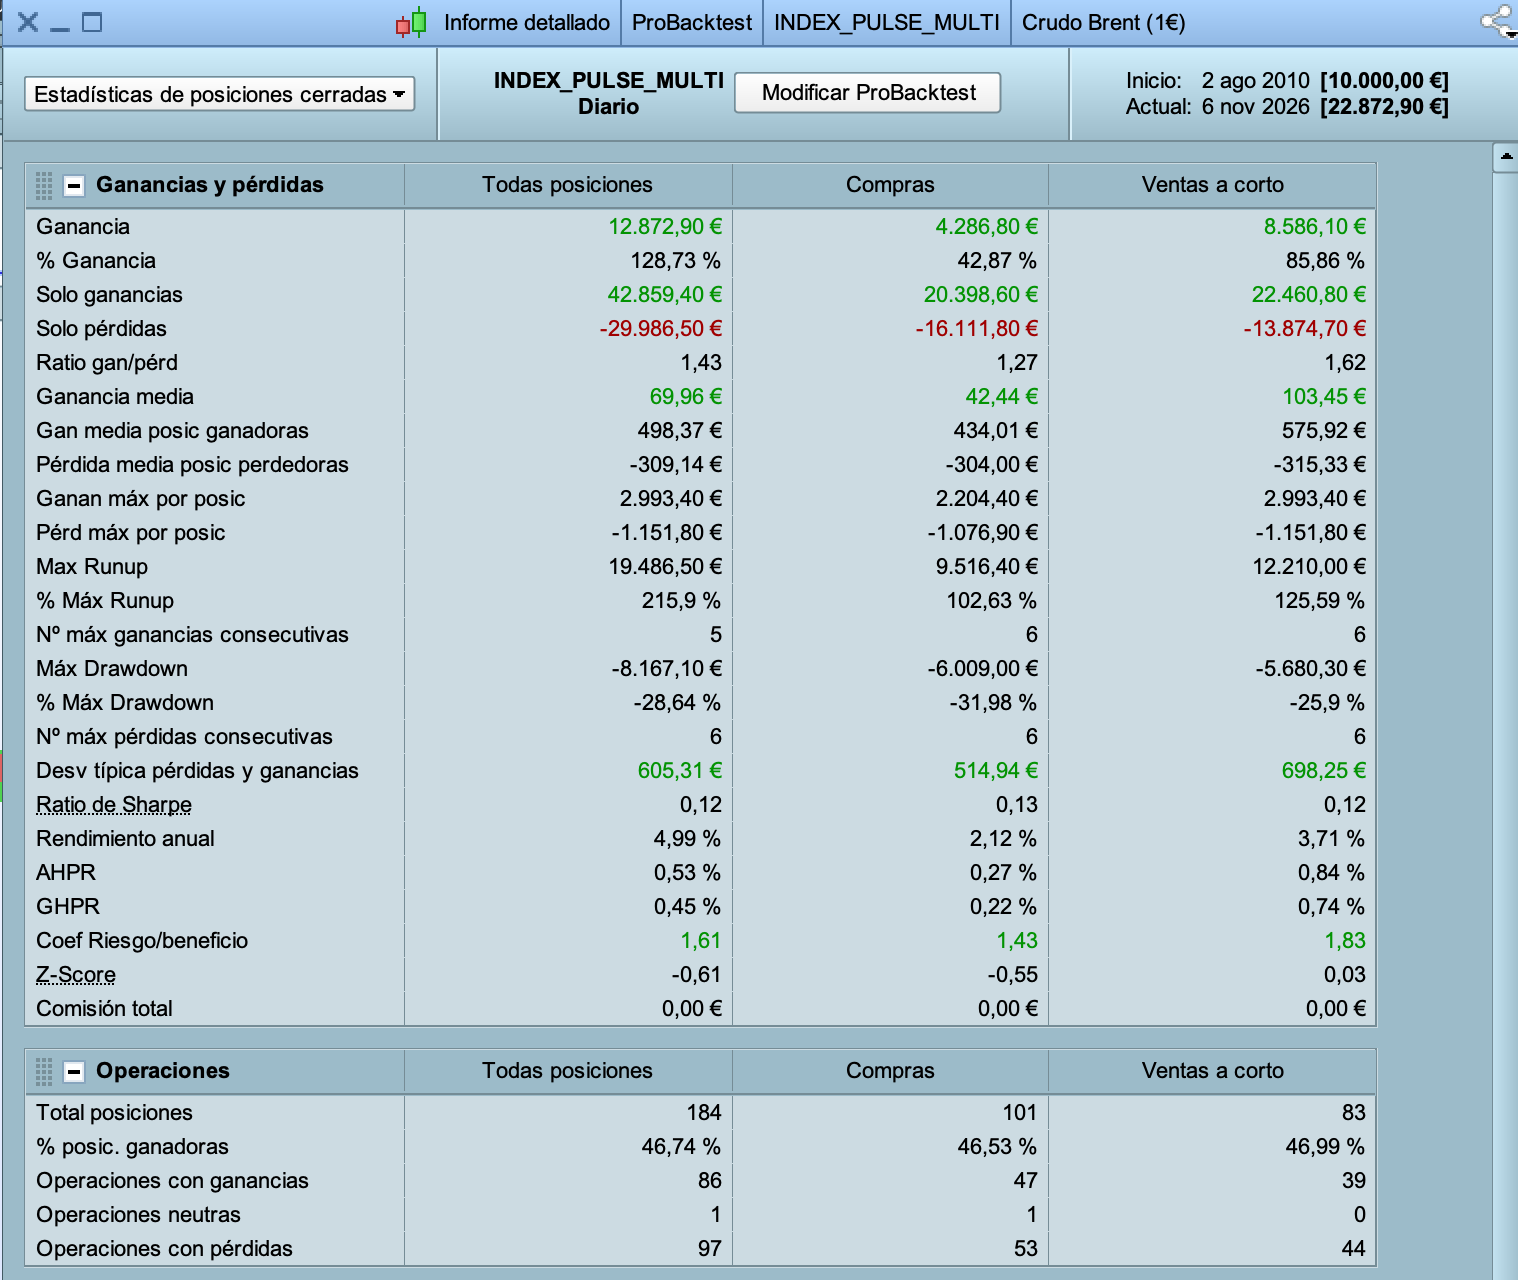
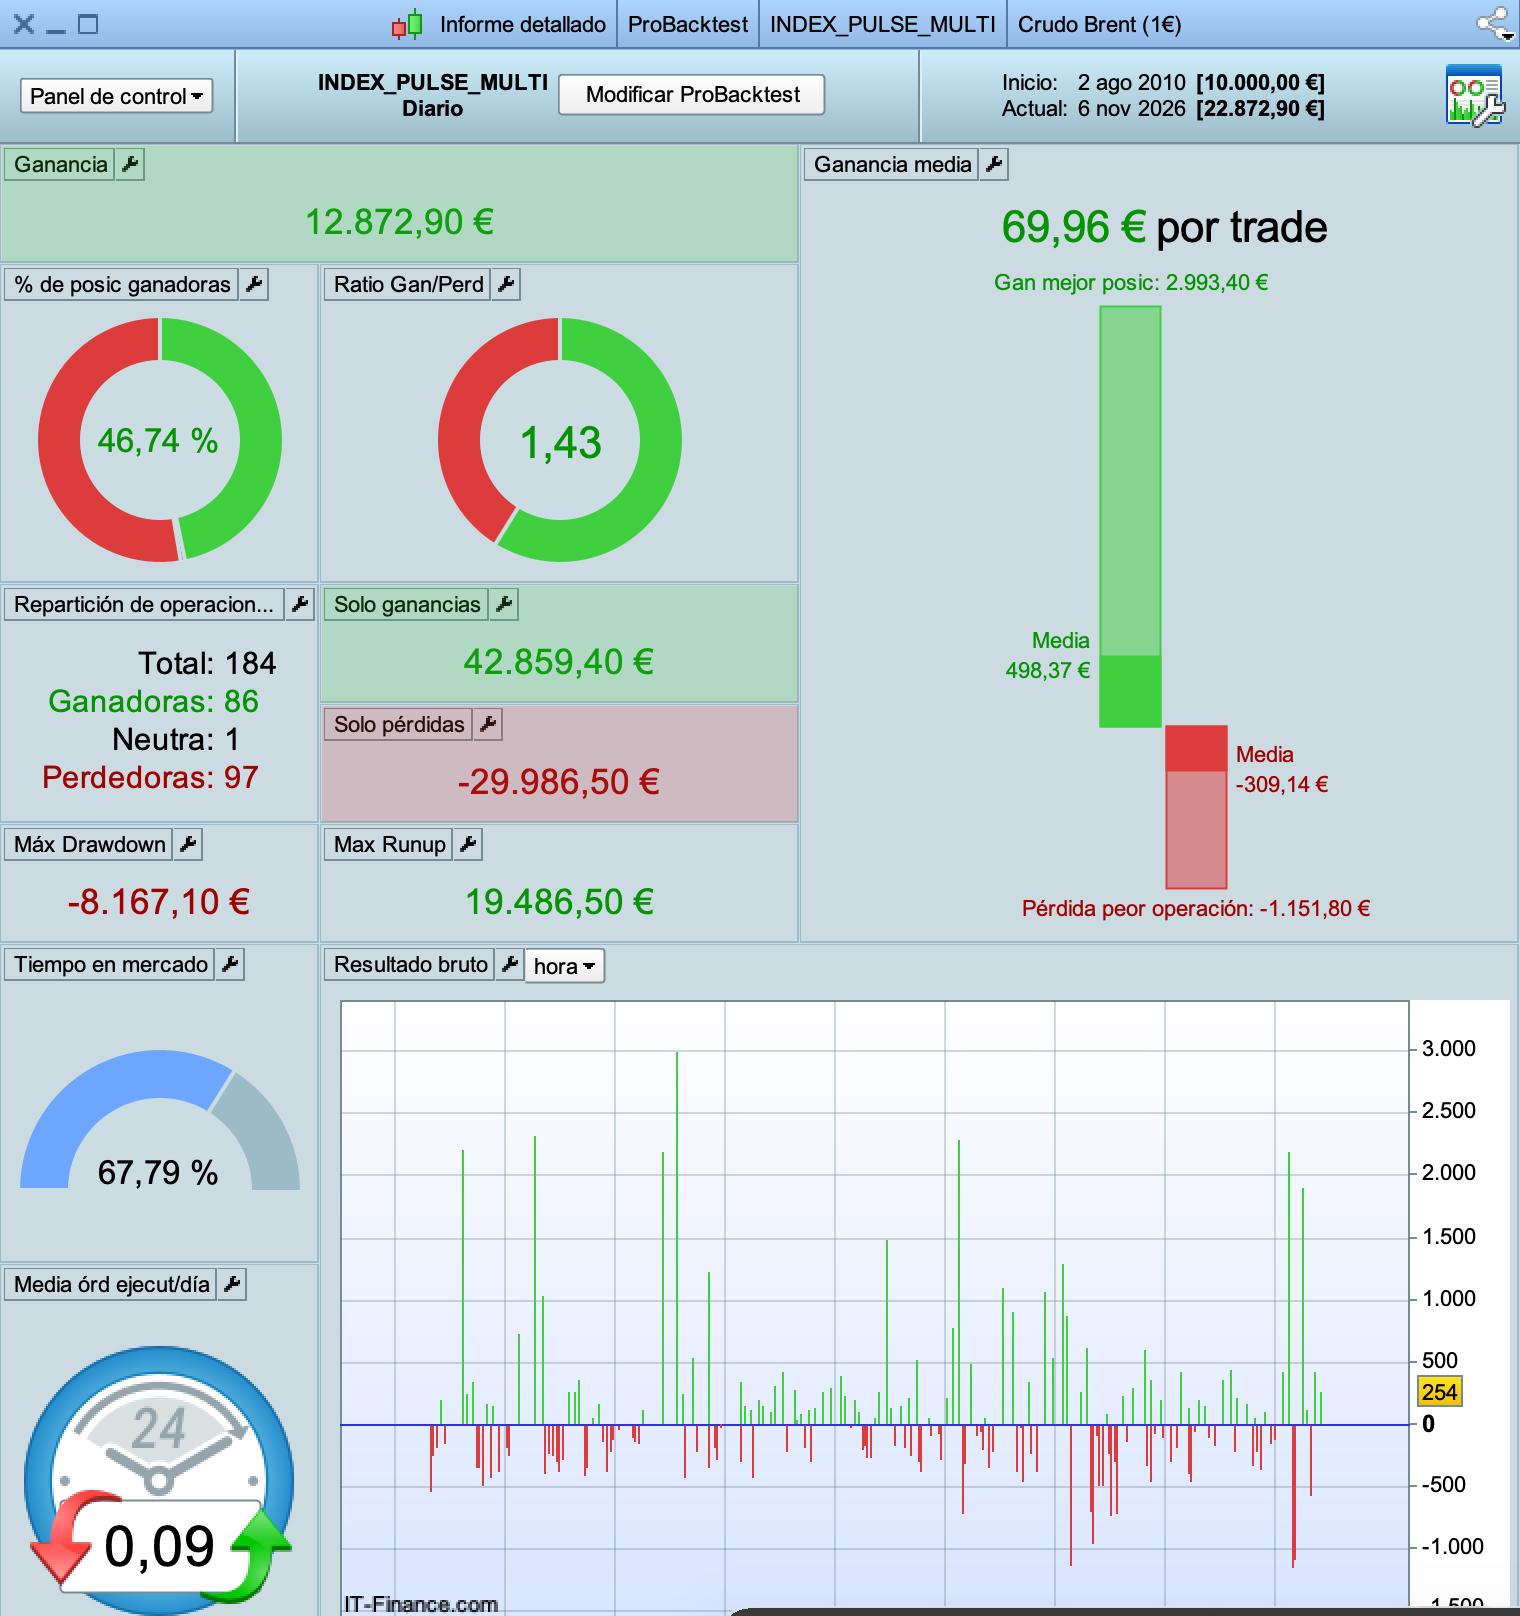
| Brent Crude | 184 (101 long · 83 short) | 46.7% | 1.43 | +12,873 € | −8,167 € |
On Brent the system wins less often (47%), but its winning trades are much bigger than its losing ones (on average +498 € against −309 €). That is how trend-following works, and it is why Brent has the highest profit factor of the four.
On Brent, the short side is the strongest: +8,586 € on short trades, against +4,287 € on long trades.
Setup in one minute
- Open the market on a daily chart.
- In Variables, set INDICE to the market’s number (table above).
- Set NCONTRATOS to your position size (1 = 1 € per point).
- Start it in ProOrder.
It ships with INDICE = 0, and with 0 it does not trade, so nothing happens until you choose a market. To trade several markets, run one copy per chart, each with its own number.
Technical sheet
- Platform: ProRealTime with IG (or another broker with ProRealTime)
- Markets: US Tech 100, US 500, Wall Street, Brent Crude (cash CFDs)
- Timeframe: daily
- Direction: long and short (short on US Tech 100, US 500 and Brent)
- Holding time: usually a few days
- Frequency: about 10–35 trades per year per market (about 100 a year across all four)
- Protective stop: yes, on every trade
- Accumulate positions: no (one position per market)
- Variables you can change: INDICE (market) and NCONTRATOS (size)
- Suggested capital per market with 1 contract: at least 3 times the maximum drawdown shown above for that market, or use a smaller size
- Installation: import, set INDICE and NCONTRATOS, start in ProOrder
Risk notice
All figures come from ProRealTime backtests (ProBacktest) on IG data; they are not live results. Live results can differ because of slippage, spreads, overnight financing and changing market conditions. Past performance does not guarantee future results. Drawdowns of 30% or more of the starting capital have happened in the backtest on some markets with 1 contract. CFDs are complex leveraged instruments with a high risk of losing money quickly. Only trade with capital you can afford to lose.


Bewertungen
Es gibt noch keine Bewertungen.